Hey Btc What Do You Want ?Hello TradingView community, Bitcoin continues to move within a well-structured rising parallel channel a pattern that has beautifully guided its trend since early 2024. Each touch on the rising support has offered meaningful rebounds, while the upper boundary has acted as a clear zone of supply and exhaustion.
However the current weekly setup suggests a shift in momentum that deserves attention. Price is now hovering near the rising support line, and although this zone has previously triggered strong bullish responses, the internal structure looks notably weaker this time.
1. Structure and Price Behavior-:
The recent rejection from the $114,700 resistance — which aligns with the mid-channel zone — shows how sellers continue to dominate near this region.
While the overall trend remains upward, each successive swing high has shown diminishing bullish strength, hinting that buyers are gradually losing control of the short-term momentum.
If Bitcoin fails to hold this rising support, it could shift the medium-term tone from accumulation to correction.
2. Resistance Dynamics-:
The $114,700 area holds strong confluence:
It coincides with multiple past swing highs.
It aligns with the median of the rising channel.
It represents a psychological round figure where institutional activity tends to appear.
This zone acts as a decisive line between continuation and reversal — reclaiming it could reinstate bullish dominance, but repeated failure would open the path toward lower supports.
3. RSI and Internal Momentum-:
The RSI (14) presents a clear bearish divergence, forming lower highs even as price carved new peaks. This ongoing divergence since early 2024 highlights a loss of internal strength — a common precursor to larger consolidations or trend reversals.
Recently, RSI also broke below its local support trendline, reinforcing the idea that bearish momentum is gaining traction beneath the surface.
4. Probable Scenarios-:
Scenario A -:Technical Rebound:
Bitcoin could attempt a short-term rebound from the current rising support toward the $110K–$114K zone. Such a move, however, might remain corrective unless accompanied by a visible increase in volume and RSI recovery.
Scenario B -:Deeper Correction:
A clean breakdown below the rising support would likely expose Bitcoin to the weekly demand zone between $75,000 and $70,000 — a region that historically attracted strong buying interest.
This area aligns with the 38.2% Fibonacci retracement of the larger advance, making it a technically sound demand pocket.
5. Broader Context-:
Despite near-term weakness, the macro structure of Bitcoin remains constructive. Corrections within rising channels are normal and often healthy — they reset sentiment, absorb excess leverage, and allow new institutional positions to build.
As long as Bitcoin respects the lower boundary of this channel, the broader bullish narrative remains intact. But a confirmed weekly breakdown could temporarily shift the trend bias toward medium-term consolidation before the next major impulsive leg.
Technical Summary-:
Pattern: Rising Parallel Channel
Resistance: $114,700
Support: Rising Trendline (~$97,000)
Demand Zone: $75,000 – $70,000
RSI: Bearish Divergence + Breakdown
Bias: Cautiously Bearish / Corrective Phase
Regards---Amit
Trade ideas

btc is ready to reloadAfter the recent increase, Bitcoin should activate more stop losses and eventually reach the $85,000-$87,000 range after a period of range fluctuations. After that, we expect the price to grow.

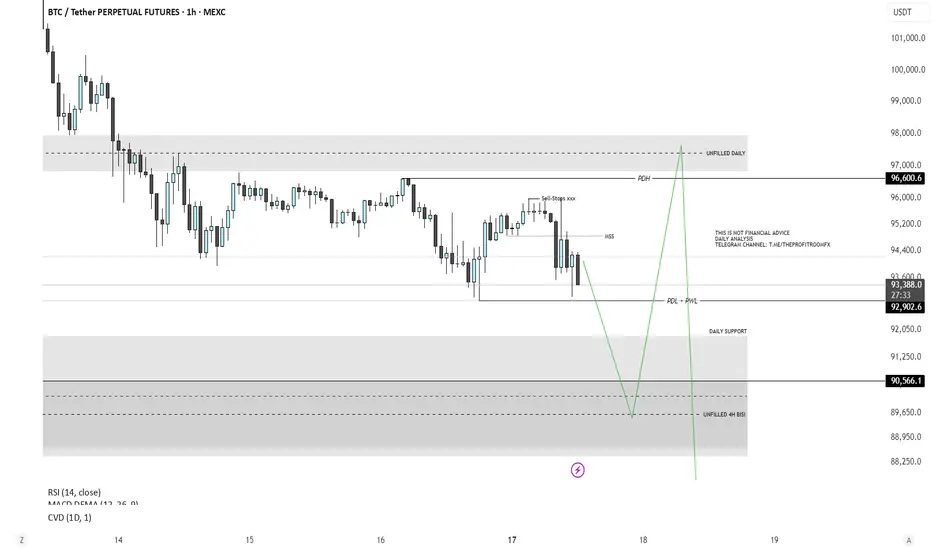
Bitcoin Analysis - Short & LongPrice is anticipated to sweep the previous day’s low (PDL) and previous week’s low (PWL), while also mitigating the unfilled H4 imbalance.
This aligns with a potential retest of the daily FVG support zone before initiating a move to the upside.
There is a clear draw on liquidity toward the buy-side, with both the previous day’s high (PDH) and an unfilled daily FVG serving as objective targets.
After filling this daily FVG imbalance, price is expected to continue delivering lower to address remaining inefficiencies on the sell-side, specifically around the 87,000 level, where another unfilled daily FVG is present.
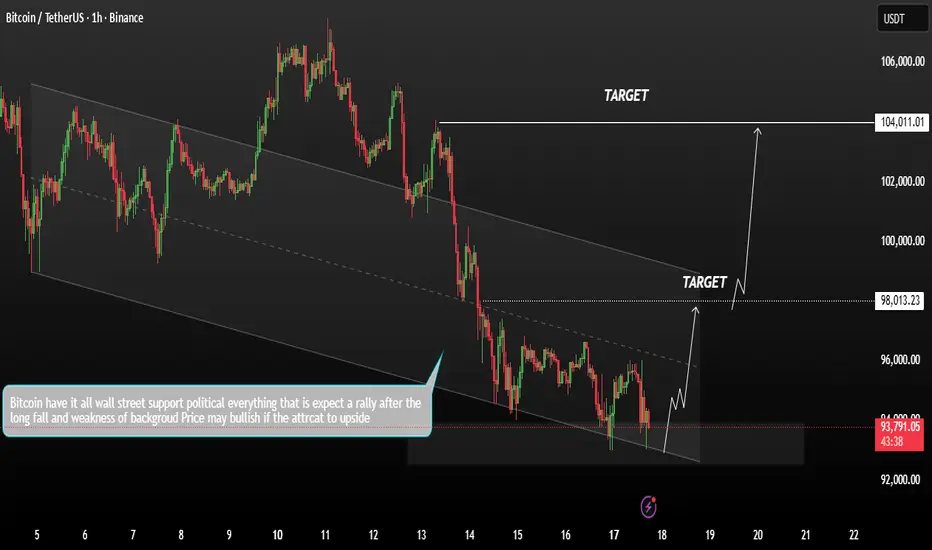
Bitcoin Potential short-term bullish reversalBitcoin is showing early signs of a potential short-term bullish reversal as price continues to respect the descending channel. The latest bounce from the upper boundary suggests increasing buy interest.
If the bulls manage to break above the key resistance level and price holds above the channel, the short-term bullish scenario remains valid. In that case, price could continue its upward movement toward the 98K – 104K upper resistance zone.
You may find more details in the chart,
Trade wisely best of Luck buddies.
Ps; Support with like and comments for better analysis Thanks for Supporting.
BTCUSDTBTCUSDT going to fall more in future. I think 88k coming in this running week. Lets see. Happy Trading ☺️ DYR

BTCUSDTP. - November 18, 2025Price is pulling back toward a clear support zone around 93,000, with a deeper support level near 92,000, while the nearest resistance sits around 96,200 along a descending trendline. The chart suggests a possible bounce from support toward resistance, but a break below 93,000 could open the way toward 92,000.
If trading this setup, the long scenario is higher-risk, as price is currently trending downward into support and could continue lower before reversing.

BTC/USDTWe are currently in a rising wedge pattern, which is generally considered a bearish setup. Despite multiple attempts, we've been unable to break above the $100k mark, which has proven to be a significant psychological barrier, accompanied by strong selling pressure. As we approach the new year, I believe there's a high likelihood we may see a pullback to the $75k level. However, this could set the stage for a strong reversal, invalidating the bearish scenario and paving the way for a move toward the $170k target. During this dip to $75k, we could also see a major altcoin season, with many altcoins potentially experiencing significant rallies.

BTCThis is the next major move for $BTC. In my view it will print an inverse head and shoulders pattern. Shorts will stack near support expecting a breakdown, but a massive bear trap is likely. The previous bull and bear traps on the chart highlight the same behavior.

btc_longhi
📈 signal BUY 🟢
🎲 Medium
📍 intry $94585.80
🎯 target $96487.02
🛑stop loss $92684.57
⚖️ ratio Risk/Reward: 1:1.00
please trade with a winner not me i am in loss monthly average.

BTC Crash Warning! BEAR Market is here!BTC’s market structure is deteriorating. Order flow continues to weaken, and buyers are failing to absorb even modest sell-side pressure. The question now is whether the recent rally has reached its exhaustion point—and the evidence suggests it may have.
In a worst-case scenario, the broader market could push Bitcoin below 70k, with deeper downside levels at 50k, 40k, and an extreme capitulation zone near 28k. These levels are not predictions but plausible outcomes based on current momentum and structural breakdown.
The larger narrative is shifting. Cycles are no longer behaving as cleanly as before, and the era of “easy crypto money” appears to be fading. Potential reversal zones exist, but as long as the bearish structure remains intact, they offer limited reliability. Each attempt at a bounce has been met with stronger sell pressure, indicating absorption by larger players.
On the other hand, the 94–85k region stands out as an area where we could see a relief rally. However, expecting it to produce a new all-time high is optimistic under current conditions.
For now, I remain strategically bearish, not emotionally bearish. My first downside target is 92–90k, with the remaining levels outlined above depending on how the market reacts at each structural break.
For now BULL Market is OVER!
#Bitcoin #BTC #BTCUSD #Crypto #CryptoMarket
#BitcoinAnalysis #BTCAnalysis #CryptoAnalysis
#BearMarket #CryptoBearMarket #BTCBearish
#BitcoinCrash #BTCDowntrend #MarketBreakdown
#OrderFlow #PriceAction #MarketStructure
#CryptoTrading #TradingView #TechnicalAnalysis
#ReliefRally #LiquidityHunt #TrendReversal
#RiskManagement #SmartMoney

BTC ShortBTC wants to go down again. Ride the fall. Targets on the chart. DYOR
Take a look all our previous successful trades.

$BTC looks ready for relief PUMPAs many I am fighting off bearish "feelings" - keyword being FEELING.
As with anything in life, we cannot always listen to our emotions, we HAVE to look at the data.
Here's what the data shows:
CRYPTOCAP:BTC is hovering over the range critical Fibonacci level of .618 = Bullish if we close the weekly above that - translation: the critical "unseen" support level of the .618 holds strong
BTC is consolidating on a massive block of support between 92-94k (check the tan box on my video) = BULLISH
The obvious bearish factors are we are below the psychological level of $100k and the fact we fell off the diagonal trend low support line (see video for diagonal black trend line).
I took a leveraged position before and after this video on CRYPTOCAP:ETH because I foresee it to pump harder than CRYPTOCAP:BTC during a relief rally, however, the Big Orange Coin looks like its bottomed out for now.
NFA

BITCOIN:LIVE TRADEHello friends
You know that this is a risky situation, so observe risk and capital management.
The price has risen after the decline, has collected good liquidity, and now it has fallen again, has collected low liquidity, and is waiting now that this floor has been made, to move to the specified targets. Of course, the opening of the US government is also effective.
Observe capital management.
*Trade safely with us*

17/11/25 Weekly OutlookLast weeks high: $107,526.18
Last weeks low: $93,034.53
Midpoint: $100,280.35
Bitcoins downtrend continues as price reaches a 6-month low of $93,000. This price action came as a result of a failed attempt to flip the $107,000-$108,000 level, as this area rejected the bears gained momentum sending BTC sub $100k big even level and the most worrying part of all for the bulls losing the $97,000-$98,000 level. On the Higher timeframes this new lower low sets up for a trend shift. Should any reaction from the bulls fail to flip the weekly high and rollover, I would then have confirmation of a bearish trend and trade accordingly.
Despite the US Government shut down coming to an end, it appears this has not been enough to get the market in a risk-on mood, at least not yet. This compounded with Nvidia earnings in midweek and the larger question mark about the AI industry as a whole has meant buyers are just not will to step in yet. My opinion is that IF Bitcoin trades into the $89,000-$92,000 area that is where support may be found, that's because we have an area of imbalance that broke the previous downtrend in April earlier this year during the tariff war.
This week I expect Wednesday 19th November to be a day of volatility, and some formation of a local bottom in Bitcoin, at least in the short term.
Good luck this week everybody!

BTC Daily View 17.11Hey friends! How’s your trading week starting off?
In my last Bitcoin post, I shifted my invalidation zone from 96,600 to 95,545 and said that if 95,545 breaks, then 96,600 won’t hold either.
Well… it broke — so I revisited the chart.
Now I think the correction after the drop should be bigger than I first expected.
For now, I’m looking at a move up toward 98,400, and then a possible continuation of the downtrend.
I still see two paths — along the orange and purple arrows.
❌ Invalidation zone: 94,850
⚠️ Not financial advice — just sharing my view.
Trade your own plan, always use stops.
⭐ Follow for updates
💬 Drop a reaction in the comments!

How much will Bitcoin fall?Bitcoin's future scenarios
Which scenario do you think is more likely?
Pay attention to levels and pricing
They can be decision points

Bitcoin viewThe chart shared illustrates as per Elliott Wave analysis setup combined with supply and demand (selling/buying) zones. Here’s a breakdown of what’s shown:
🧩 Elliott Wave Count
The labeling (A (a-b-c)–B (a-b-c)–C (1-2-3-4-5) (1–5) now we are in C(1-2-3-4-5) where we have completed C-3 Wave heading too C-4 Wave
🔹 Key Components:
Wave (a)-(b)-(c):
Indicates a corrective pattern (ABC Zigzag) where (c) is likely completing or nearing completion.
Waves 1–5 (in yellow):
Represent a downward impulse, possibly forming Wave (c).
Currently, it seems price is in Wave 4, with Wave 5 expected to follow downward toward the “Buying Zone.”
💰 Trading Zones:
Selling Zone:
Marked around the Wave 4 retracement area — typically a good place for short entries if price rejects this region.
Buying Zone:
Below, where Wave 5 (and (c)) is expected to complete.
A potential reversal area where buyers could step in.
Always follow Price-Action
⚠️ Disclaimer
This analysis is published here is for educational and informational purposes only. It does not constitute financial advice, investment recommendation, or a solicitation to buy or sell any financial instrument. All ideas and analyses shared here reflect the author’s personal opinions and are not endorsed by TradingView. Trading and investing carry significant risk of loss and may not be suitable for all investors. Always do your own research and consult a licensed financial advisor before making any trading decisions. The author and TradingView are not responsible for any losses arising from the use of this information.

The Market is at 80°C. What Happens at 100°C?Greetings, everyone.
Today, I don't want to talk about the news. I want to talk about what truly matters: market structure. Many traders are currently looking for a news event to explain the current lull and predict Bitcoin's next move. They are looking in the wrong direction.
Remember this: the news is not the cause of a move. It's just a convenient explanation handed to you after the move has already happened. For me, the chart is primary. And right now, it's telling a story that most people are not going to like.
The Global Picture: An Economy of Bubbles and Boiling Water
We live in an era of bubbles. We had the dot-coms, the tulip mania, and now we are witnessing the AI bubble. Yes, AI is a game-changer, and I am actively integrating it into all my processes - it would be foolish to deny this trend. But that doesn't change the fact that the markets are overheated.
The entire global economy right now feels like water heated to 80 degrees Celsius. It’s not boiling yet, but the boiling point is near. Something is about to happen, and the steam is getting ready to burst out.
The Market's Pulse: Where the Crowd Goes Wrong
And what about the crowd? The crowd isn't in Bitcoin anymore. They are trapped in altcoins, having resigned themselves to being "forever waiters." They are praying for an altseason, not realizing that the brief 20-30% pump we saw - that was the altseason. It has already become a meme.
I see endless posts about liquidations on social media. The sentiment is desperate. Most have already lost their futures positions or will lose them soon. What reigns in the market right now isn't fear or greed, but rather a slow realization that the bear market never really left.
The Main Setup on the Chart: A Classic Liquidity Trap
Now for the most important part - what is happening on the Bitcoin chart?
As you can see, we are sitting on a critical trendline support. Everyone sees it. Novices and retail traders see this as a clear "buy the dip" signal. And that is part of the game.
A deliberate trap is being set:
Consolidation : The price is being intentionally held near the support line to create an illusion of strength and to accumulate buyers' positions.
Stacking Stop-Losses : Market makers know that the crowd places their stops just below this obvious line.
Execution : Once enough liquidity has been built up, a sharp breakdown will occur. This will trigger a cascade of stop-loss liquidations, which will only accelerate the fall.
I remain fully on the bearish side until we see a confident break of the all-time high. I view any bounce from the current levels as an opportunity for a better entry into a short position.
What's Next?
What is my advice to myself for the next 2-4 weeks? Wait.
The market is preparing for a great cleansing. A wave of delistings of junk projects and meme coins - which serve no one but the exchanges that use them for hype - is coming. After this cleanse, there will be incredible opportunities to buy at very attractive prices.
Now is the time for deep research into the projects you truly believe in. It's time to get your limit orders ready and wait for the market to come to your prices.
Thank you for your attention.
Regards,
Your EXCAVO.
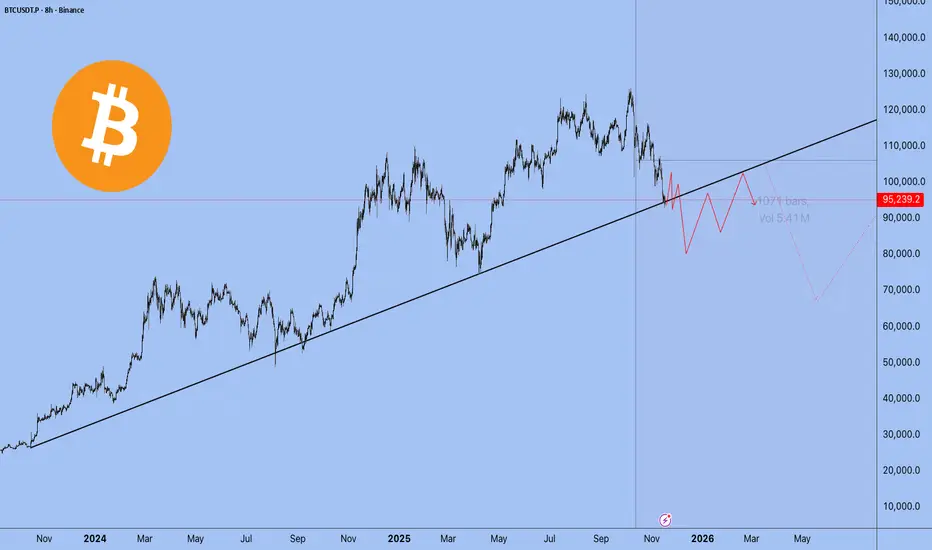
BTC Bearish TargetThe 1064 bar theory has played out perfectly assuming thast the BTC was in on 6 Oct 2025. Significant damage has been done to the macro structure since then. If we assume the Top was in on 6 Oct 2025 the 4 year cycle remains in tact and we can just the date range trend to predect the nect bottom date being 5 October 2026 (364 days from Top to Bottom) We use the FIB and other support/resistance to determine a possible price range of where the bottom could be. Based on 0.618 - 0.786 Fib retrancement it gives us a possible price range of 58329 - 39274 where the price of BTC will potentially bottom out. Looking at prior support/resitance we want to narrow this price range down to 58329-51043. Once we reach the predicted date the possible bottom price will be re-evaluated.
BTC is also currently breaking down from a accending wedge on the weekly with the measured move taking us to 47681.

Liquidity Basics: Equal Highs/Lows, Inefficiencies & POIsPrice doesn’t move randomly, it is always attracted towards liquidity.
Every wick, breakout, and fake-out tells a story of orders being filled.
If you can read where those orders are hiding, you stop trading noise and start trading intention.
Equal Highs & Lows — The Obvious Targets
Retail traders love to mark equal highs and lows as “strong support/resistance.”
Smart money sees them as fuel.
Above equal highs = cluster of buy stops.
Below equal lows = cluster of sell stops.
When price reaches them, it’s a collection of accumulated liquidity as a main driver behind that move.
Inefficiencies — Fair Value Gaps
Also known as Fair Value Gaps (FVGs) or imbalances, these occur when price moves too quickly, leaving unfilled orders behind.
Price often revisits these zones later to rebalance.
Spot them between large candles with no overlap, they often mark where institutions filled partial orders.
Points of Interest (POIs)
POIs are areas where liquidity and inefficiency converge , the zones of intent.
Look for:
Liquidity sweep of equal highs/lows
Return to imbalance or order block
Shift in market structure
That’s where high-probability setups occur.
Note:
Stop chasing every candle.
Start mapping why price moves.
Equal highs and inefficiencies are magnets, with proper plan and confluence this can represent your strong side of trading.

BTC & USDT.D - Who Follows Who?The eternal question in crypto, does Bitcoin lead USDT.D, or does USDT.D dictate Bitcoin’s moves?
At the moment, both charts are approaching critical inflection points.
CRYPTOCAP:BTC is retesting the $90,000 support, while CRYPTOCAP:USDT.D is nearing the 6.4% resistance.
As long as BTC holds above $90K and/or USDT.D remains capped below 6.4%, the bulls can still take over, paving the way for another impulsive rally across the crypto market.
But if these levels break… we may be in for a deeper correction before the next leg up.
So, who will make the first move? 🧩
⚠️ Disclaimer: This is not financial advice. Always do your own research and manage risk properly.
📊All Strategies Are Good; If Managed Properly!
~Richard Nasr

EVERYONE SELL NOW BTCUSDBTCUSD made a spike sharp retracement after the BOS and created an inducement and price made a pull back to reject from the ob zone with sharp rejections am looking forward to sell from this zone holding till new low is created87k is my measure target....

BTC | Monthly Cycle Exhaustion? Short Target to 78,275Bitcoin is currently trading around $95,800, and based on the higher-timeframe structure, I’m positioning for a bearish correction.
Setup
Entry: 95,800
Stop-Loss: 130,945
Target: 78,275
Risk-to-Reward: ~1:2 but inverse logic (stop is wider intentionally)
Why Short?
On the monthly chart, Bitcoin has completed what looks like a 5-wave impulsive rally, showing signs of cycle exhaustion. Logically, a corrective phase (A-B-C or range) becomes more probable after such a structured move.
Probability Estimate
📉 Bearish continuation probability: ~70%
📈 Bullish breakout probability: ~30%
This idea is not financial advice — just a probability-based positioning for a potential macro pullback before the next expansion phase.
