Tuesday Asia Range AnalysisTuesday Asia is a 1% consolidation with single session M formation indicating lower movement.
Current areas of interest down include:
1 - previous day low sweep and/or vector candle 104,800
2 - Daily ADR low
3 - Previous low and remainder of longer term unrecovered vector candle
Trade ideas

Bitcoin Loses $107K Support — Liquidity Below $100K Now in FocusBitcoin’s price action continues to show notable weakness after losing the $107,000–$107,500 support zone, a critical structural level that previously held during prior consolidations. This breakdown increases the probability of an accelerated move toward the sub-$100,000 region, where a large cluster of resting liquidity remains.
From a structural standpoint, the $100,000 region is now the key level to defend. Wicks or short-term deviations below this zone could form a cyclical liquidity grab, but sustained trading beneath it would signal further downside continuation and potential expansion of the corrective phase.
Key Points:
- Support Breakdown: Loss of $107K–$107.5K confirms ongoing weakness.
- Liquidity Target: Sub-$100K region remains the next high-probability liquidity area.
- Critical Defense Zone: The $100K level must hold to prevent a deeper market rotation.
Technically, Bitcoin remains under bearish pressure as momentum continues to fade from recent highs.
What to Expect:
As long as Bitcoin trades below $107K, the bias remains bearish, with a likely sweep of liquidity below $100K before any meaningful reversal attempt. A strong reclaim above $107K would be required to restore short-term bullish momentum.

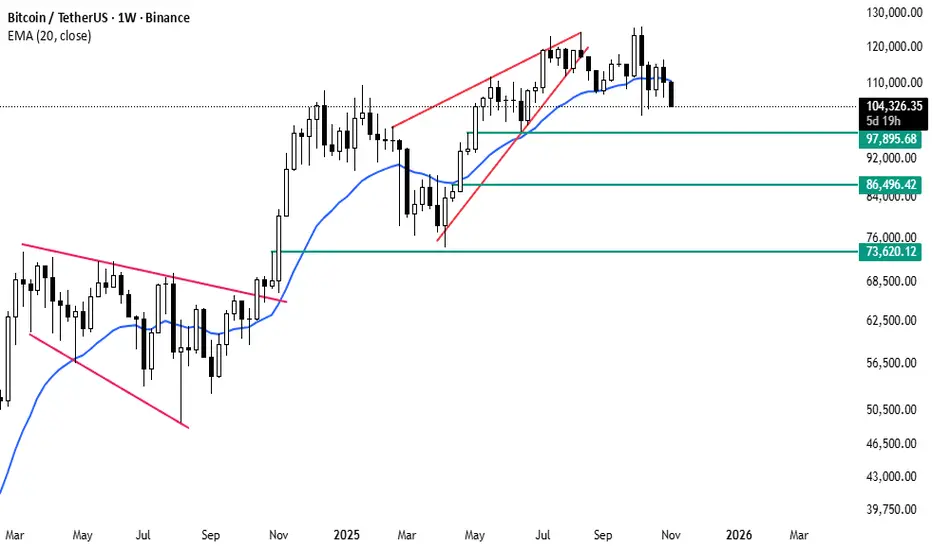
Bitcoin Weekly Analysis — Potential Pullback ZonesBitcoin is currently trading around $104,500, showing signs of weakness after failing to maintain the highs near $120,000. The weekly chart suggests that price is testing the 20 EMA, which has acted as dynamic support throughout the recent bullish trend.
If the current consolidation continues, possible pullback zones can be found at:
$97,900 – minor support and the first reaction level
$86,500 – major support aligned with previous demand area
$73,600 – key structural level from the last breakout base
As long as Bitcoin remains above the 20 EMA, the broader trend stays bullish. However, a clear weekly close below this average could open the door for a deeper correction toward the lower support levels.
This phase looks like a healthy retracement within the long-term uptrend, but confirmation from upcoming weekly candles will be crucial.
Bitcoin’s price is at one of its most critical moments yet!👋🏻 Hey everyone! Hope you’re doing great! Welcome to SatoshiFrame channel.
✨ Today we’re diving into the 4-Hour Bitcoin analysis. Stay tuned and follow along!
👀 On the 1-hour timeframe of Bitcoin, we can observe that after failing to break above its key resistance zone, BTC moved toward the multi-timeframe lows. Losing those lows created a selling pressure, pushing the price to retest its fundamental support levels. Currently, I’ve identified two critical zones in my analysis — a breakout from either one could provide a solid trading opportunity.
⌛ Bitcoin’s volume shows a strong bias toward sell positions, to the point where buyers are barely preventing the higher timeframes from entering oversold conditions. However, if this selling pressure and volume persist, Bitcoin could break the lower boundary of its recent daily range and continue downward. Volume data gives us the best insight into market behavior, allowing us to build effective scenarios.
✍️ There are two potential scenarios for Bitcoin that I’ll briefly summarize below — both can be used as setups for positioning.
🟢 Long Scenario: If Bitcoin breaks above the resistance zone at $108,072, completes a pullback, and shows an increase in buying volume with momentum entering the market, we can open a long position. This setup looks somewhat risky, so it’s better to enter with a smaller position size. The best trigger for a long entry is located around $111,180.
🔴 Short Scenario: If Bitcoin breaks below the key support level at $105,732, it could offer a short position setup — provided that selling pressure and bearish momentum continue. After the breakdown, we’ll need to wait for a pullback before entering the trade.
❤️ Disclaimer : This analysis is purely based on my personal opinion and I only trade if the stated triggers are activated .

BTC soonDear Traders,
here the targets i expect btc to visit :) lets see if this can play
i think another wipe is coming very soon beleive or not just wait and watch
do not listen to moonboyss
be smart

How to use bitcoin CME gap auto finder indicator on tradingview📊 Bitcoin CME Gap Auto Detection and Visualization Indicator
The Pine Script-based indicator Bitcoin CME gaps multi-timeframe auto finder is a TradingView tool designed for cryptocurrency traders and investors to automatically identify and visualize Bitcoin CME (Chicago Mercantile Exchange) futures market gaps across multiple timeframes.
The Bitcoin CME futures market often creates price gaps after weekends or holidays when trading resumes. These gaps typically represent market imbalances, and many traders believe that price levels where gaps occur are likely to be revisited in the future.
This concept is known as the "Gap Fill" theory, where such gaps are considered key price zones that may act as support or resistance levels.
Traditionally, manually identifying these gaps requires checking multiple timeframes and verifying weekend/holiday sessions, which is both tedious and time-consuming.
Indicator Link: Bitcoin CME gaps multi-timeframe auto finder
🔑 Key Features of the Indicator
Automated Gap Detection: Saves traders the time and effort of manually searching for and marking gaps.
Cross-Exchange Synchronization: CME gap boxes are displayed in sync on other Bitcoin charts such as BTCUSDT, BTCUSDT.P, and BTCUSD.
Multi-Timeframe Analysis: Displays gaps simultaneously across various timeframes (5m, 15m, 30m, 1h, 4h, 1D), providing multiple market perspectives.
Visual Clarity: Clearly highlights gap zones, with major gaps emphasized for quick trader recognition.
Strategic Trading Support: Provides essential information for developing and executing gap fill-based trading strategies.
CME Gap History: Allows users to review all past CME gaps formed in historical candles.
Alert Functionality: Sends real-time notifications when new gaps are detected, helping traders respond promptly to market changes.
⚙️ Main Functions and Usage
This indicator provides a wide range of customizable input options, allowing traders to adapt it to their specific analytical needs.
CME Gap Settings:
CME Symbol for Gaps: Specifies the symbol used to fetch CME futures data. The default is “BTC1!” (Bitcoin CME Futures).
Minimum gap percentage (%): Sets the minimum price movement recognized as a gap, allowing users to filter out minor fluctuations and focus on significant ones.
Display Timeframes:
Enables or disables gap visualization for each timeframe (5m, 15m, 30m, 1h, 4h, 1D). Users can activate only the timeframes they prefer to analyze.
Box Colors:
Customizable colors for each timeframe and gap direction (upward/downward), allowing easy visual distinction between gap types.
Box Extension Lengths (Bars):
Sets the number of bars the gap box extends to the right for each timeframe.
This visually illustrates how gap zones can remain relevant as future support/resistance levels.
Label Settings:
Show labels: Toggles the display of percentage labels for gaps.
Label position: Adjusts where the label appears inside the box.
Label text size: Controls the label font size.
Highlight Settings:
Highlight gap % (>=): Emphasizes gaps larger than a specified percentage, providing visual alerts for major gaps.
Highlight label text color: Sets the text color for highlighted gap labels.
Highlight box color: Defines the color for highlighted gap boxes.
Highlight box border width: Adds adjustable border thickness to highlighted gap boxes, making significant gaps stand out even more.
Alert Settings:
Enable Alerts: Toggles alert activation when gaps occur.
Alert Timeframe: Choose specific timeframes for receiving alerts or enable alerts for all timeframes.
🚀 How It Works
The indicator retrieves CME futures data (BTC1!) and compares the previous bar’s close/high/low with the current bar’s open across multiple timeframes to identify gaps.
It is specifically designed to detect gaps that occur when the market reopens after weekends or holidays.
Once a gap is detected, the indicator draws a box to visually mark it on the chart.
If the gap size exceeds the user-defined threshold, the box is emphasized using a highlight color and thicker border for greater visibility.
💡 Trading Strategies and Applications
Support and Resistance Identification:
CME gap zones often act as strong support or resistance levels.
Unfilled gaps may indicate potential price return zones, serving as signals for possible reversals or trend continuation.
Gap Fill Strategy:
Many traders believe that gaps tend to be filled eventually.
This indicator can help identify potential entry and exit points for gap fill trades.
For example, after a downward gap, traders might consider entering a long position when the price begins to recover toward the upper boundary of the gap and close the trade once the gap is filled.
Market Sentiment Analysis:
The size and frequency of gaps can reflect strong market movements or uncertainty.
Large gaps often indicate intense buying or selling pressure, and highlighted gaps help quickly identify these significant market events.
Multi-Timeframe Confirmation:
When gaps occur simultaneously across several timeframes, it underscores the importance of that price zone.
For instance, if a gap appears on both the 1-hour and 4-hour charts, traders should pay close attention to potential price reactions at that level.
Opportunity Detection via Alerts:
By enabling alerts, traders can monitor market changes in real time and act immediately when new gaps form — particularly useful for short-term or high-frequency strategies requiring fast decisions.
🚨 Cautions
Gap fills are not guaranteed: While gaps often tend to be filled, not all of them will, and some may take a long time.
Time zone configuration: Since the CME operates in specific trading hours, make sure the indicator’s GMT+9 timezone matches your local trading setup on TradingView.
Avoid using in isolation: Combine this indicator with other technical tools (e.g., moving averages, RSI, volume indicators) to enhance reliability and accuracy.
※ If you found the Bitcoin CME gap auto finder indicator helpful, please give it a like and follow.
BTCUSDT – Potential Bullish Reversal from Demand ZoneBINANCE:BTCUSD has rebounded from the key demand zone between $104,500–$106,000, showing early signs of recovery after a sharp decline. This area has acted as a strong support multiple times, suggesting the presence of institutional buying interest.
If price maintains above this zone, a potential short-term bullish reversal could unfold, targeting the $111,000–$112,000 resistance region. However, a clean break and retest above this supply zone will be crucial for confirmation of sustained bullish momentum.
In the mid-term outlook, a temporary pullback from the supply zone could occur before continuing its upward trajectory toward $115,000–$116,000, aligning with the overall market sentiment favoring risk assets.
Invalidation occurs if BTC breaks below $104,000, which would indicate continued bearish pressure and possibly deeper retracement.

BTCUSDT 4-Hour Chart Analysis. BTCUSDT 4-Hour Chart Analysis.
Current Pattern: BTC is in a falling wedge, with price making lower highs and lower lows, yet approaching the wedge’s support alongside the green demand zone ($102,000–$104,000).
Downside risk remains until the green zone ($104,000 area) is tested; strong support is expected there.
Resistance is at the upper falling trendline; a confirmed breakout above this would be bullish, with an upside target near $114,000–$123,000.
The chart projection suggests some more downside or sideways action, then a strong reversal if the green support holds.
If BTC loses the green zone, expect further weakness, but if price rebounds, a significant rally could follow.
DYOR | NFA

Bear Market or Healthy Flush? What MOST People Are MissingEvery time Bitcoin dips, the same old debate comes up: is this the start of a bear market or just a healthy correction?
Here's a scenario that MAY play out, and is one that MOST retail traders aren’t watching.
This isn’t a prediction, but a rather a keen observation. Right now, the charts are giving mixed signals, and that’s exactly why it deserves a closer look.
🔹 What’s Really Happening
After three pushes into the highs, Bitcoin’s daily chart is showing a clear bearish RSI divergence. That usually hints at fading momentum.
At the same time, price fell below the 50 EMA band (1 standard deviation) and got rejected right at the EMA line.
This setup looks almost identical to what happened in May, and back then it led to a solid mid-teens pullback before the trend recovered.
So far, this move from $115K down to the $96K–$98K zone is roughly a 15–17% correction. That’s painful, but still normal inside a bullish cycle.
To call it a bear market, BTC would need to break below that 2024 trendline and print lower lows. That has not happened.
🧭 Why It Matters
This is where traders often get it wrong.
Corrections like this are meant to reset sentiment, clear leverage, and test conviction.
They are not always trend reversals. Sometimes, they are the fuel for the next move up.
If BTC reaches that 2024 trendline with RSI oversold and a bullish divergence forming, that could mark the next major long setup to watch.
📊 Key Zones
Resistance: 50 EMA band (~$115K)
Support: $96K–$98K
Trigger to watch: RSI divergence + trendline retest
Until Bitcoin reclaims the 50 EMA zone, the near-term bias stays cautious.
But this still looks like a healthy flush, not a bear turn.
🪽 Stay sharp, trade smart, and let the charts guide you, not your emotions.

BTC/USDT — 1H Chart AnalysisTechnical Bias: Bullish Reversal Setup
Analysis Overview:
BTC is showing strong signs of a potential bullish reversal after retesting the key $99,000 support zone, which has historically acted as a high-volume demand area. The current structure suggests absorption of selling pressure with narrowing spreads and stable volume — a classic VSA accumulation signal.
Key Technical Insights:
Support Zone ($99,000 – $100,000): Price rebounded from this zone with visible buying tails and decreasing spread on down bars, indicating professional demand stepping in.
Resistance Zone ($114,000 – $115,000): Previous double-top area highlighted in green; this will be the next major resistance where profit-taking may occur.
Volume Behavior: Volume dropped during the last downward push, suggesting a lack of selling momentum — a bullish sign within VSA logic.
RSI Recovery: RSI bouncing from the oversold region confirms early momentum shift to the upside.
Trade Setup:
Buy Entry: Above $106,000 (confirmation of reversal structure)
Target Zone: $114,500 – $115,000
Stop Loss: Below $105,000 support
Risk–Reward Ratio: ~1:5, favoring long bias
Conclusion:
BTC holds a higher probability of upside continuation, supported by strong demand near support and weakening supply pressure. A sustained close above $106,000 will likely trigger a momentum rally toward the $115K resistance area.

Scalp Long – BTC💎 Scalp Long – BTC
RSI is deeply oversold, especially on the 1H timeframe, signaling exhaustion of selling pressure.
Buying volume has reappeared, suggesting a potential retest of the 110,000 zone previously broken.
🎯 Plan:
→ Enter after confirmation of bullish reaction from support.
→ TP: 110,486 | SL: 106677 | RR: 1 : 3.8
Momentum favors a short-term rebound.
Keep entries precise, trail SL as price rises.
Patience and clarity — only execute once the setup confirms.

“BTCUSDT – Watching for a Bullish Reversal from Demand Zone”After hitting the 105,600–101,500 demand zone and forming a reaction, I expect a potential bullish leg from here.
The main resistance area to watch is 113,600, which acts as a strong supply and structural pivot.
If price can break and close above 113,600, we could see continuation toward 116,900 – 118,000.
But as long as 113,600 holds, a short-term rejection or consolidation is still possible.
Key Levels:
• Demand: 105,600 → 101,500
• Resistance: 113,600
• Next Target: 116,900 – 118,000
The daily candle needs to close above 106,200 today.

Example of a Trading Style
Hello?
Hello, fellow traders.
Follow me to get the latest information quickly.
Have a great day.
-------------------------------------
While it's ideal to always close a trade in profit, this isn't always the case.
Therefore, you should maintain your trade by locking in profits through fractional trading.
Based on the trading information provided by the exchange, once a trade has turned into a loss, it's likely to take a considerable amount of time to turn into a profit again.
Therefore, you should trade at different buy and sell prices.
However, this is a rather tedious process, so it's not usually done that way.
-
If you were to buy near the area shown on the chart, the estimated average purchase price would be significantly higher than the current price.
Therefore, you wouldn't be able to proceed with the trade.
Therefore, we must trade by purchase price.
The purchase prices for positions 1 and 2 are quite high, so we don't pay attention to them.
Since the current price is near the purchase price for position 3, if it turns into a profit, you can sell the amount you purchased near position 3 to lock in the profit.
By subtracting this profit from the purchase price for positions 1 and 2, you can minimize your losses.
This trading method is possible because the coin market allows trading in decimals.
The key here is to trade by purchase price.
You should not trade in units of the number of coins you purchased.
For example, if you purchased $100 at point 3 (106431.68), you should sell $100 when the price rises.
Trading this way will allow you to quickly recover from losses and even generate profits even during losses.
-
You can profit whenever volatility occurs, regardless of whether the asset (coin or token) you're trading is in a loss or a profit.
You should avoid increasing the number of assets (coins or tokens) you're trading without managing them.
------------------------------------------------
To do this,
1. Mark support and resistance points on the 1M, 1W, and 1D charts.
2. Develop a basic trading strategy using these support and resistance points.
3. Avoid greed and execute split trades according to your trading strategy.
-
Thank you for reading to the end. I wish you successful trading.
--------------------------------------------------

BITCOIN BTCUSDT TECHNICAL OUTLOOK
THE daily outlook is looking bearish ,the ema+sma strategy all above price .
the break of 110,607 and retest sent bitcoin selling on daily to 106,125$,this selloff will continue if we fail to hold daily support at 106,474 .
the next support zone will be around 96,950
the next support zone 75,285 ,
FUNDAMENTAL OUTLOOK.
Bitcoin is the world's first decentralized cryptocurrency, launched in 2009 by an unknown person or group using the pseudonym Satoshi Nakamoto. It allows peer-to-peer transactions without relying on banks or central authorities. Bitcoin transactions are recorded on a public ledger called the blockchain, which is maintained by a network of computers (miners) that validate and secure transactions through cryptographic proofs.
What is Bitcoin?
Bitcoin is a digital currency that enables secure and transparent transfers over the internet.
Not owned or controlled by any single entity—it operates on a decentralized network.
Uses blockchain technology to maintain a permanent, public transaction record.
Supply is capped at 21 million coins, making it a scarce, deflationary asset.
Network Security and Hash Rate: The computing power devoted to mining, indicating network strength and resilience.
Transaction Volume and Adoption: Growth in users, wallets, and real-world usage reflect demand.
Supply Schedule: Bitcoin’s issuance halves roughly every four years, reducing new supply and potentially driving scarcity.
Institutional Interest: Investment flows from funds, corporations, and ETFs show confidence and liquidity.
Regulatory Environment: Legal clarity or restrictions impact market sentiment.
Macro Factors: Inflation trends, fiat currency strength, and geopolitical uncertainties influence Bitcoin as a store of value or risk asset.
Summary
Bitcoin is a decentralized digital currency secured by cryptography and maintained on a blockchain network. Its fundamentals include the network’s security, supply scarcity, adoption rates, institutional interest, and macroeconomic influences, all of which shape its price and long-term value proposition.

BTCUSDBitcoin dropring this week to test 100.000$
We will see going to 90.000$ soon if dont keep 110.000$ leves this week

Volatility Period: Up to November 10th
Hello, traders!
Follow us to get the latest information quickly.
Have a great day!
-------------------------------------
(BTCUSDT 1D chart)
This volatility period is expected to last from November 3rd to 9th.
First, we need to check the movement between November 3rd and 5th.
While the key question is whether the price can rise after finding support at the important support and resistance level of 104463.99-108353.0, it's crucial to check for support around 106431.68 within that range.
This is because the 106431.68 point is the DOM(-60) level.
-
The DOM indicator is a comprehensive evaluation of the DMI, OBV, and MOMENTUM indicators.
DOM(-60) indicates that all three indicators have reached their lows.
Therefore, support is necessary to confirm the possibility of a bullish reversal.
If the price rises after the DOM(-60) indicator first appears and then touches the DOM(-60) indicator again, it is highly likely that the price will fall without finding support.
If the price rises after finding support at the DOM(-60) indicator, it should follow a period of sideways movement to confirm support.
-
Therefore, what we can do now is take the time to determine which direction the price deviates from the 106431.68-108353.0 range and where it encounters support and resistance.
You need your own basic trading strategy to execute your trades.
No one else can do this for you.
This is because you need to tailor your trading strategy to your investment style to avoid regrets.
My basic trading strategy is to buy in the DOM(-60) ~ HA-Low range and sell in the HA-High ~ DOM(60) range.
However, if the price rises in the HA-High ~ DOM(60) range, a step-up trend is likely, while if the price falls in the DOM(-60) ~ HA-Low range, a step-down trend is likely.
Therefore, a split trading strategy is required.
-
The formation of the DOM(-60) indicator indicates a buying opportunity. However, as previously mentioned, this is the second time the indicator has fallen below the DOM(-60) level since its formation, increasing the likelihood of further declines.
If the price falls below 104463.99 and continues to decline, it is expected to meet the M-Signal indicator on the 1M chart and re-establish the trend.
At this point, the key area to consider is support, particularly around the left Fibonacci level of 2.618 (87814.27) to the left Fibonacci level of 3.14 (93570.28).
If the price declines and a new HA-Low indicator is formed, support around that level is crucial.
-
You can profit by trading whether the price is in an uptrend or a downtrend.
However, the trading period may vary depending on the trend.
Therefore, you should check the flow of funds and determine whether trading is possible based on the support and resistance levels currently established.
To continue the uptrend by breaking above a key point or range,
1. The StochRSI indicator must be trending upward. If possible, it should not have entered an overbought zone.
2. The TC (Trend Check) indicator must be trending upward. If possible, it should remain above the zero level.
3. The On-By-Sign-Operative (OBV) indicator must be trending upward. If possible, it should remain above the High Line.
When all three indicators above are met, an uptrend is highly likely.
Currently, the On-By-Sign-Operative (OBV) indicator is located near the Low Line, following the EMA 3 > EMA 2 > EMA 1 > OBV.
Therefore, we can see that selling pressure is dominant.
However, since it's located near the HA-Low indicator, you should pay close attention to the situation.
If it finds support in the DOM(-60) ~ HA-Low range according to the basic trading strategy, it's a good time to buy.
-
Thank you for reading to the end.
I wish you successful trading.
--------------------------------------------------
- Here's an explanation of the big picture.
(3-year bull market, 1-year bear market pattern)
I'll explain more in detail when the bear market begins.
------------------------------------------------------
