BTC SHORTBTCUSDT – Short Position Still Valid
Price continues to respect the bearish structure after the reversal.
We rejected the mitigation zone and stayed below the Alligator EMAs, confirming continuation.
• Short remains active
• Invalidation: Any 2H close above 89,632 – 89,892
• Structure: Lower highs + compression under resistance
• Expectation: Continuation lower after wedge breakdown
Targets:
1. 88,900
2. 87,700
3. 82,160 (main objective)
Still watching for a possible stop-hunt into the red zone, but bias remains bearish unless invalidated.
Trade ideas

BTC/USDT 4H Chart Review🧭 1. Main Market Structure
The chart shows:
A broad downward channel that has been in place since the end of October.
The price bounced off the upper line of the channel, made a local upward impulse (orange trend line), and then broke it, returning back towards the lower regions of the channel.
➡️ This means that the dominant trend is still downward, and upward bounces are corrections.
🧨 2. Current Chart Situation
BTC has broken through:
the local uptrend (orange line)
fell below the 88,500–89,000 zone (green)
is heading towards further support levels
Currently, the price looks like a typical retest of the broken structure and a continuation of the decline.
🟩 3. Key Price Levels (S/R)
Resistance (upper – green):
91,600 – 92,000 – key level, a breakout would negate the local downtrend
95,000 – 97,500 – upper range of the descending channel
Support (lower – red):
85,300 – 85,800 – local support (price is currently reacting here)
83,000 – 83,100 – strong horizontal support
79,800 – strong support, historically strong in this timeframe
76,600
75,000 – lower band of a potential drop + near the lower boundary of the channel
➡️ The most logical downside targets are 83,000 and 79,800.
📉 4. Descending Channel (black) (lines)
The price has rebounded from the upper range of the channel and is heading towards the lower range.
The middle line of the channel has been broken down → a signal of trend continuation.
The lower boundary of the channel indicates a potential low around 75,000–78,000.
🔄 5. Stoch RSI
Currently oversold in the oversold zone, it is starting to curve upwards.
In a downtrend, long signals are weaker, but a short-term rebound is possible.
🧭 6. Scenarios
📉 Bearish scenario (more likely)
Technical rebound to 88,500 – 89,000
Rejection from this zone → continued decline
Targets:
83,000
79,800
Extremes: 76,000 – 75,000
➡️ This scenario is consistent with the trend and a rebound from the upper channel.

Bitcoin still in reactive phaseBitcoin’s relief bounce stalled right at the descending trendline, and the move up couldn’t break through the mid-96k supply zone. Momentum is cooling off again, and volume isn’t supporting a breakout.
Unless price can reclaim that trendline with conviction, the chart still leans corrective. Key areas to watch on the downside remain the mid-80k zone, with stronger support lower in the 70s where demand and volume profile stack up.
For now, BTC is still in a reactive phase. Bulls need a clean close above resistance to shift the structure. Until that happens, caution makes sense.
Bitcoin Comes Back to Life! Buyers Return With Full PowerIf I had to name a “warrior rising from the storm” , it would be BTCUSDT right now. After plunging to the 84k region, Bitcoin has just staged an almost 7% rebound back toward 93k, accompanied by news that big money from Wall Street is flowing back into crypto and overall fear in the market is calming down. The USD is no longer overly strong, and Bitcoin is once again being mentioned as a key gauge of market risk appetite .
Looking at the 12H chart, BTC has broken back above the bottom of the long-term descending channel and is now pushing into the Ichimoku cloud. This rebound isn’t a “spike and die” pattern — it’s a sequence of steady bullish candles with shallow pullbacks , showing that buyers are firmly in control. The scenario is becoming clearer: price may pull back to around 90,500 to gather liquidity and retest the cloud edge, before potentially bouncing toward the higher resistance region around 107,300 — the next equilibrium zone of the trend.
With the supportive news flow (institutional money re-entering, market accepting a new price base after the drop) and a technical structure showing BTC has temporarily escaped the free-fall phase , I remain biased toward buy-the-dip setups . The plan is to wait for short pullbacks for entries rather than trying to sell against a recovering bullish wave that’s clearly being “revived”.

BTC: The Bitcoin bounce is not a trend reversal🚫 The Bitcoin bounce is not a trend reversal
Here’s why the current move looks more like a liquidity trap than a real bullish reversal:
- Momentum is lagging — the rebound isn’t supported by strength.
- Liquidity spikes look engineered to squeeze short positions rather than coming from genuine buyers.
- ETFs are selling while BTC is pumping → classic exit liquidity behaviour.
- We remain in a bearish trend, and the current flag pattern is on the verge of breaking. Statistically, these patterns break down, with targets equal to the size of the previous leg.
- Price is rising while volume is falling → this is a hidden bearish divergence on volume.
🎯 What I’m seeing
It looks like many institutions were caught off guard by the depth of this downtrend, and now they’re trying to reduce exposure.
They appear to be engineering a bounce to attract retail FOMO, allowing them to exit with smaller losses — a classic liquidity extraction move.
As I’ve mentioned several times already:
👉 The primary trend remains bearish until Q2 2026, though we should expect bounces and manipulative moves along the way.
⚠️ My advice
Don’t deploy all your capital into a fake FOMO rally and become the institutions’ exit liquidity.
Wait for a proper bottom confirmation, such as:
A W pattern, followed by a successful retest with a higher low.
❌ Invalidation
This analysis becomes invalid only if the current pattern breaks upward with strong volume.
DYOR
TradeCityPro | Bitcoin Daily Analysis #242👋 Welcome to TradeCityPro!
Let’s move on to the Bitcoin analysis. Today is Saturday, and after yesterday’s drop, the market is ranging and resting.
⌛️ 1-Hour Timeframe
Yesterday, we saw clear signs of correction and bearish momentum in Bitcoin, and with a sell-off candle, the price dropped to the 89,082 level.
🔭 After reaching this zone, the correction has paused, and Bitcoin is now moving sideways near 89,082.
💥 On the RSI oscillator, we had a descending trendline that RSI respected very well.
✨ Now that this trendline has been broken, RSI is testing the 42.25 resistance level.
⚡️ If RSI breaks above this level, we will have the first signal of bullish momentum returning to Bitcoin.
🎲 If we get that confirmation from RSI, we can then look for a long trigger on the Bitcoin chart itself.
🧩 Once BTC breaks the short-term structure it forms by then, we can open a long position.
🎯 However, since today is Saturday, I personally prefer to wait and avoid opening any trades until the new week starts.
💡 Still, I’ll stay behind the chart, and if the bullish scenario plays out, I will open a long position.
📊 For a short position, we can enter on a break of 89,082, but honestly, many altcoins paired with BTC have much better short triggers right now.
❌ Disclaimer ❌
Trading futures is highly risky and dangerous. If you're not an expert, these triggers may not be suitable for you. You should first learn risk and capital management. You can also use the educational content from this channel.
Finally, these triggers reflect my personal opinions on price action, and the market may move completely against this analysis. So, do your own research before opening any position.

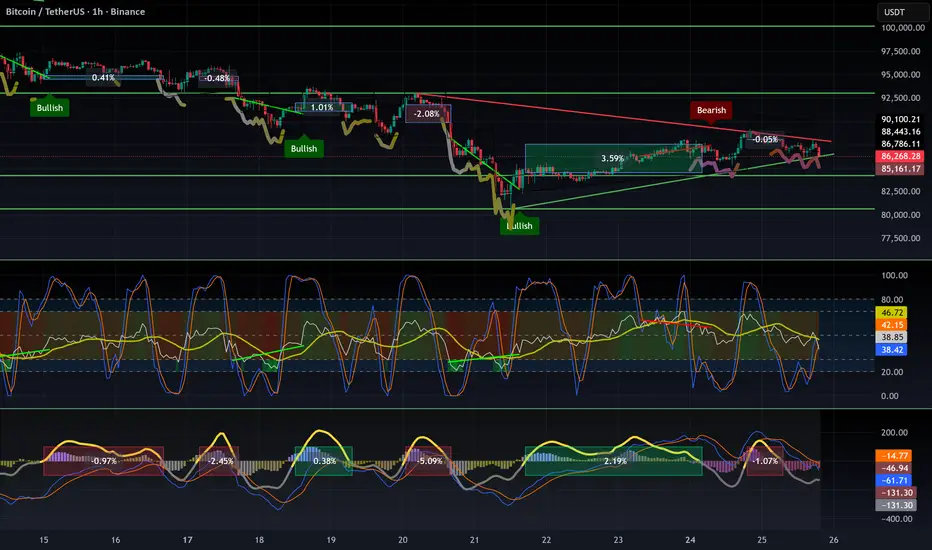
TradeCityPro | Bitcoin Daily Analysis #243👋 Welcome to TradeCity Pro!
Let’s move on to today’s Bitcoin analysis. The market is still ranging because it’s the weekend, but today there is a strong chance of movement.
⏳ 1-Hour Timeframe
After the drop to the 88,890 zone, the market formed a range structure yesterday, and Bitcoin is now preparing for its next move.
✔️ Bitcoin’s volume was very low yesterday (Saturday), and this low volume has continued today as well.
💡 However, since we’ve recently seen New York session volatility on Sundays, today we may also see movement.
💥 With RSI pulling back to the 50 level and failing to stabilize above it, bearish momentum can enter the market.
🧩 If RSI enters the oversold zone, this bearish momentum will increase even more.
🎲 If 88,890 breaks, opening a short position is logical, and the price may move toward 85,818.
⚖️ But today, the market can also give us a long setup.If the 90,022 level breaks, we can look for a long position.
🎯 The next resistance levels for Bitcoin are 91,974 and 93,609.
✨ The most important note for both triggers is VOLUME.The breakout must be supported by increasing volume.
📊 If volume stays this low and doesn’t improve, the probability of fake breakouts increases significantly.
🔭 But if the breakout happens with rising volume, the trend can continue smoothly.
❌ Disclaimer ❌
Trading futures is highly risky and dangerous. If you're not an expert, these triggers may not be suitable for you. You should first learn risk and capital management. You can also use the educational content from this channel.
Finally, these triggers reflect my personal opinions on price action, and the market may move completely against this analysis. So, do your own research before opening any position.

Uptrend confirmed It's best to operate from confirmations, even when you know you're right
I have all the confirmations I need to confirm the we are in an uptrend on Bitcoin

Daily Bitcoin Trade | Thu(Dec-04-2025) | ShortThu(Dec-04-2025) | Short
LEV: 50x
EN: 92990
SL: 93926
TP: 90489
This is my setup for today. This setup may fail. be careful, because this trade is risky!
This is not an offer to buy or sell.

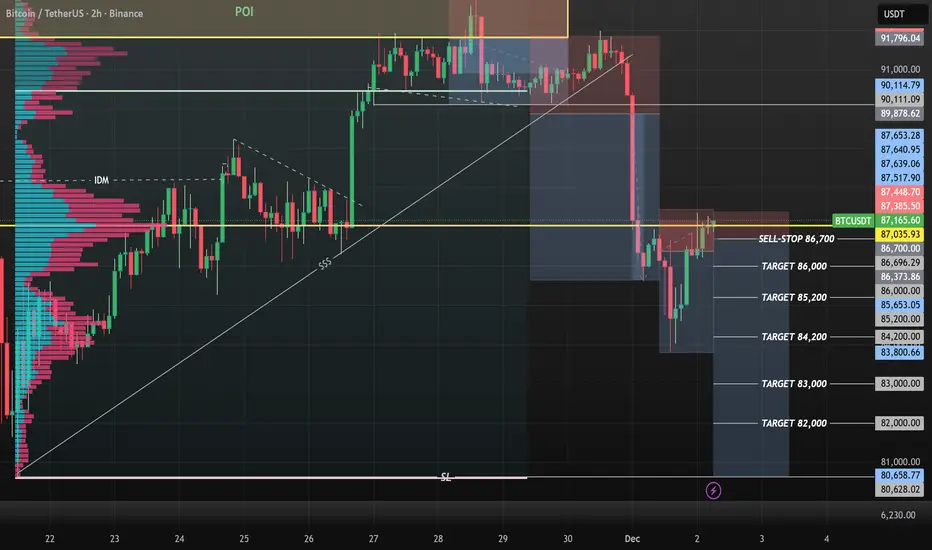
BTCUSD SELL WITH SELL-STOP ORDER!!!BTCUSD completed +2,000pips from my yesterdays analysis and predictions today we have price still ranging at my POC point level am looking forward to sell from 86,700 area using min confirmations under my POC key level to sell from there to 80k.....
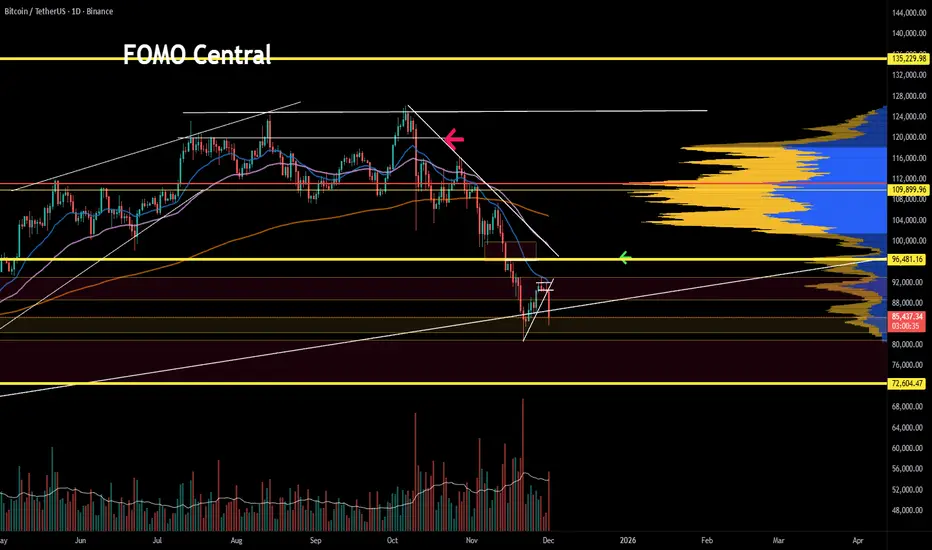
Bitcoin (BTC) Update, is price at resistance ?Bitcoin reversed sharply into the point of control and is now consolidating under the channel-high resistance that has held for several days. This suggests buyers are losing momentum.
As long as BTC stays below this resistance, the market remains vulnerable to filling the lower inefficiency and rotating back toward the 78,000 support.
Key Points:
- Consolidation under channel-high resistance
- Short-squeeze rise filled lower inefficiencies
- Single-print region below remains vulnerable
What to Expect:
A clean reclaim of resistance is needed for upside. Failure opens the door to deeper corrective moves toward 78,000.

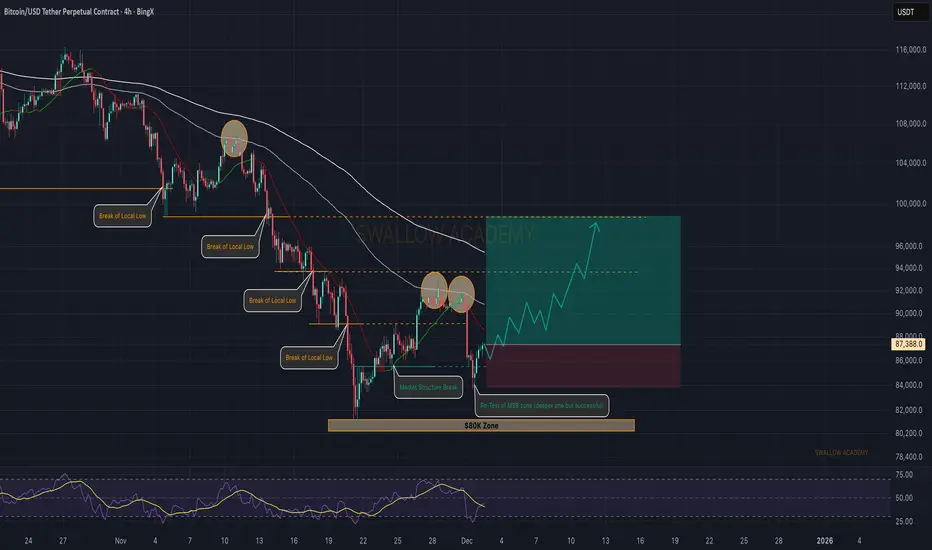
Bitcoin (BTC): Market Structure Break + Successful Re-Test | BuyAfter the deep downside trend we had on the Bitcoin, the price formed a decent market structure break (MSB), which reached the 100EMA and then went for a retest.
Now after the retest we are seeing a decent movement forming and price recovery happening, which can lead the price back to 100 EMA and then possibly break it as well.
Monday was bloody but the rest of the week should be green!
Swallow Academy
Bitcoin (BTC): All We Need Now Is Break of StructureBitcoin is accumulating currently where price is heading most likely for a break of structure (Which would confirm our bullish gameplan). As soon as we see the breakout we will be looking for a long position right there!
Swallow Academy
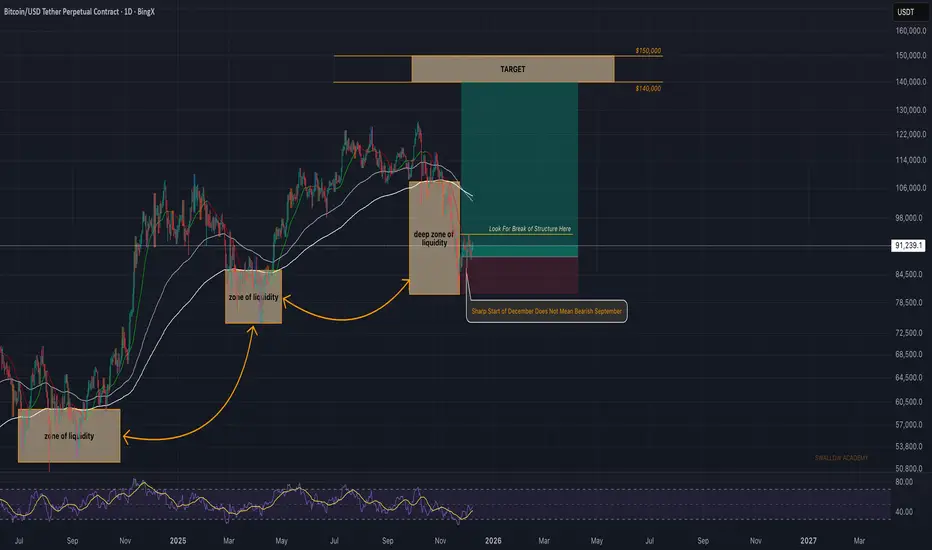
BTCUSDT - The BottomI am looking at $75k-$80k for a bottom before a push upward to $128k or hopefully beyond

BTC analysis 8 DecBTC – Bullish Outlook with Planned Laddered Entries
📌 Overall Trend
My higher-timeframe bias on Bitcoin remains bullish.
I expect the current pullback to create liquidity for continuation to the upside.
⸻
📥 Laddered Buy Zones
I am planning to accumulate in three key demand zones:
• $90,500
• $88,650
• $85,907
These levels align with previous reaction zones and liquidity pockets that could serve as bases for bullish continuation.
⸻
🔍 Entry Criteria (Very Important)
I will NOT enter blindly into these zones.
For each level, I will wait for:
✔ CHoCH (Change of Character)
✔ Break of Structure on the 15-minute timeframe
Only after a clear shift in market structure will I execute entries.
This filter significantly increases win-rate by avoiding ignored or weak zones.
⸻
🎯 Trade Plan Summary
• HTF trend: Bullish
• Looking for a corrective move into demand
• Entry only with 15m CHoCH + BOS confirmation
• No confirmation → no trade

Bitcoin Weakens After H&S Pattern: Next Stop, 89k?Hi!
It looks like price recently formed a pretty clean Head & Shoulders pattern on the 15m timeframe. The left shoulder, head, and right shoulder are all well-defined, and price has already broken beneath the neckline with a clear shift in structure. Momentum is leaning bearish.
The chart also shows a large supply zone above (the red area), which rejected price strongly adding confluence that the top may be in for now.
The projections on the chart make sense: if the neckline continues to hold as resistance, we could see a move down toward the blue demand zone around 88.7k–89k. That’s the next major liquidity pool and likely where buyers might step in again.
Unless price reclaims the neckline with strength, the bias stays short-term bearish with continuation lower.

Bitcoin (BTC): Bounce From 100EMA | Respecting The ZoneBTC looks very bullish, especially with the recent bounce we had on 100EMA. The zone has been once again respected and now we are looking for further movement to upper zones.
We are keeping this gameplan until the March, that's about the max lenght we expect the markets to push, after that we should see the start of bear market.
Swallow Academy

How to use statistics and Pine Script to find a real edge.Are patterns really profitable, or are we just connecting random candles with a story?
Most of us started trading by seeing patterns on the chart: double bottoms, pin bars, three green candles, “smart money” footprints… but do we have any evidence they actually works ?
In this idea, I want to talk about the statistical significance of chart patterns, and how you can use simple statistics + Pine Script to move from “I think this works” to “I measured this edge.”
◼ Patterns are opinions until you define them
“Strong bullish candle”, “nice rejection”, “liquidity grab” – these are subjective words.
Statistics don’t work with feelings, they work with clear rules. Before testing anything, a pattern must be converted into something like:
Candle 1: bullish, body size > X% of price
Candle 2: low does not break previous low
Close of Candle 3 > high of Candle 1
Once you can write your pattern as strict conditions (true/false), you can: Count how many times it appeared, measure what happens after it appears, and decide if it’s worth trading or not. That’s where Pine Script becomes a powerful research tool.
◼ What does “statistical edge” actually mean?
A pattern is interesting if, when you look at many occurrences, you see a consistent tendency. For example, choose a simple question like: “When this pattern appears, where is the price on average after 10 bars?”
If you track that over hundreds or thousands of samples, you’ll get:
How often price is higher vs lower (win rate).
The average move (for example, +0.8% after 10 bars).
How volatile or noisy the results are.
This doesn’t magically make a holy grail, but it tells you: Is this pattern better than random? Is it worth building a full strategy around it? Without this step, you’re basically trading based on screenshots and memories.
◼ Using Pine Script as your statistics magic tool.
Even without going deep into code, the logic in Pine Script is simple, here is a simple example that you can do.
A. Detect the pattern Whenever your conditions are true on a bar, mark that bar as a “pattern bar”.
B. Look forward in time For each pattern bar, check the price after N bars (for example 5, 10, or 20 bars later). Calculate the % change between the pattern close and the future close.
C. Aggregate the results Keep a running count: How many patterns triggered (sample size), How many ended positive (wins), The average % move after N bars.
D. Interpret the numbers If you find that your pattern appeared 800 times, and after 10 bars: 62% of the time price was higher, Average move was +0.6%... then you have something much more concrete than “this looks good on the chart.” You don’t need to turn this into a full strategy immediately. Even a simple statistical study like this already filters out a lot of illusions.
◼ Common mistakes when testing patterns
When you start doing this, it’s easy to fool yourself. A few traps to avoid:
Tiny sample size : If your pattern only occurred 15 times and 11 of them were winners, that 73% win rate is probably not reliable. Statistics start to mean something with large samples (hundreds or thousands of events).
Obsession with win rate : A 70% win rate means nothing if your winners are tiny and your losers are huge. You must look at: Average move, Distribution of outcomes (are there huge negative outliers?), How a realistic stop-loss / take-profit would behave. Sometimes a pattern with 52–55% win rate can be excellent if the average reward is larger than the average risk.
Overfitting the past : If you keep changing rules until the backtest looks perfect, you are no longer discovering a pattern – you’re forcing the past to agree with you. A healthier flow is: Start with a simple, logical idea. Define it clearly in rules. Test it on one market / timeframe. Check it on other symbols and timeframes without changing the rules.
If the edge survives in different environments, that’s much more interesting.
Using this approach will save you a lot of time and money in losses, do your research before taking a trade, make sure you have the statistical evidence if you want to trade a pattern.
i will be sharing more ideas on the use of Pinescript to improve your trading in the next days. make sure you follow me.
BTC at Crossroads: Consolidation Before the Next Leg Up?BTC at Crossroads: Consolidation Before the Next Leg Up?
After Bitcoin came out of the consolidation, the price is reluctant to rise further. The market remains uncertain about the future moves considering that the FED is expected to cut rates at the upcoming meeting.
Perhaps the US PPI data today will start the move considering that the market should speculate again regarding the FOMC meeting.
On the other hand, BTC is well positioned for an optimistic move. It may correct in this area before moving higher. This is a normal scenario.
It is also possible that the price will fall within the pattern even more considering that the markets are still volatile and unclear before we see the optimistic move resume again.
Main targets
98900
106300
114500
You may find more details in the chart!
Thank you and Good Luck!
❤️PS: Please support with a like or comment if you find this analysis useful for your trading day❤️

BTCUSDT Bullish channel holding strongAs observed on the chart, Bitcoin is trading within a newly formed ascending channel and is currently testing the lower boundary of this structure. This level represents a strategic support zone within the bullish technical framework, offering a favorable opportunity to consider initiating or adding to long positions with appropriate risk management.
Also if this channel resistance break to the upside then market is again bullish after a while.
DISCLAIMER: ((trade based on your own decision))
<<press like👍 if you enjoy💚

BITCOIN Bitcoin currently faces a major resistance at the 98,750 level, a zone that has repeatedly limited upward momentum. As long as the U.S. Dollar Index fails to decline and geopolitical risks remain elevated, Bitcoin is unlikely to show strong bullish continuation. Despite the lack of immediate strength, the market still provides attractive opportunities.
The 80,000 and 70,000 support regions are fundamentally valuable zones, especially if institutional buyers — such as BlackRock through ETF allocations — accumulate positions.

Bitcoin (BTC): 100 EMA Holds | Entering Into Bear Market SoonBitcoin buyers are not giving away that 100 EMA easily; they hold this zone and as long as we are above that mark, we are looking for one last bullish movement here.
Now if we talk about cycle times and how long each cycle has been lasting, we can assume that we are about to enter the bearish market, but one last push should follow before the dip.
So we are looking for a bearish market to start around Dec-March, as soon as we get that one last pump.
Swallow Academy

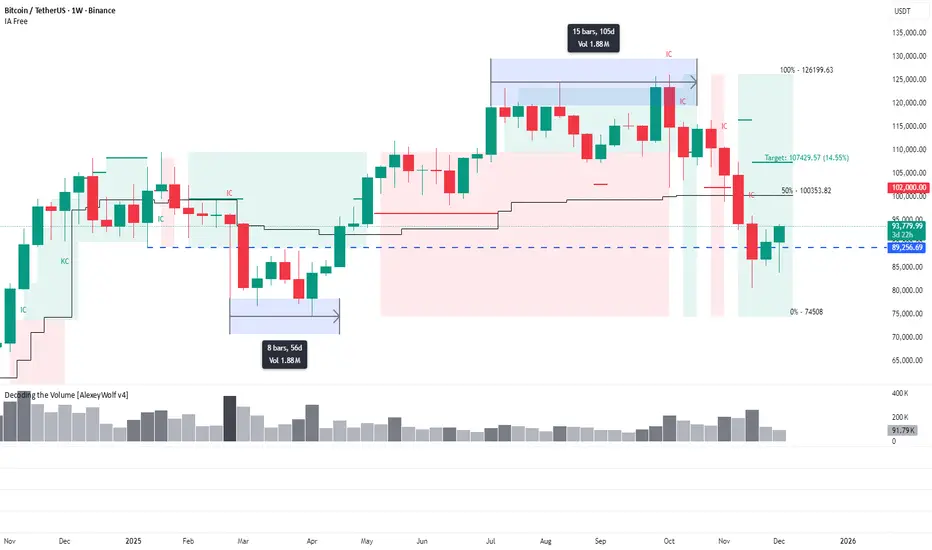
Volumes give clues: What the weekly range structure is showingThis analysis is based on the Initiative Analysis (IA) method.
Hello traders and investors!
On the weekly timeframe, Bitcoin remains in a sideways range. Notice how interestingly the price moved through its boundaries.
First, the lower boundary of the range at 89,256 was broken — and this is where a 1.88M volume was accumulated over 8 weeks .
Later, the price broke the upper boundary of the range, and the same 1.88M volume was distributed, but this time over just 15 days .
This indicates that there were far fewer buyers willing to buy at higher prices — the market needed almost twice as much time to distribute an identical volume.
Now the price has returned to the very zone where the first major volume was accumulated.
For more details about the 86,000–79,500 zone, see the related post.
Wishing you profitable trades!