My next trade! 🔎 What we do:
Identify high-probability setups
Break down price action with clarity
Focus on continuation plays, deviations, and market structure shifts
Keep learning simple, practical, and effective
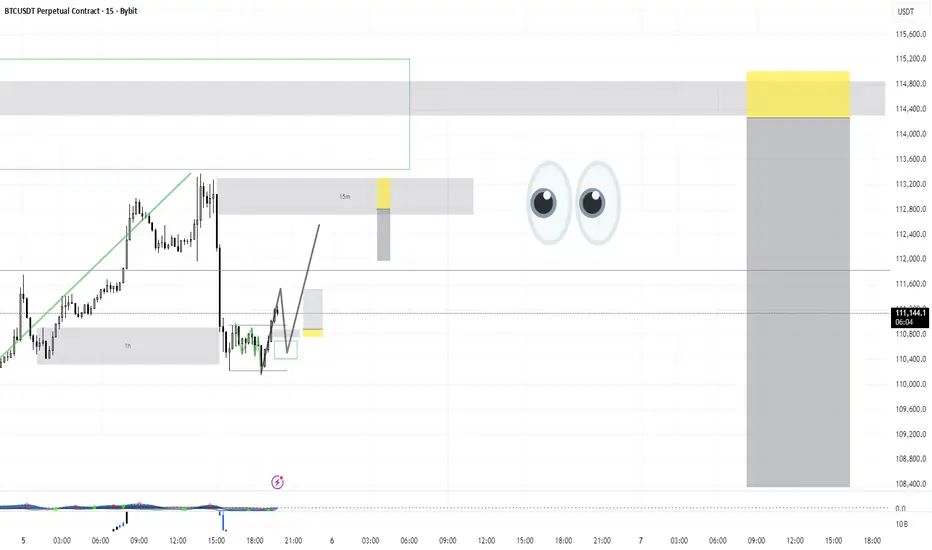
⚡ Today’s Trade Idea:
Setup: Simple continuation play from demand OR a deviation play from the consolidation range.
Entry Trigger: Waiting for a market structure change ✅ for confirmation before involvement.
💡 Mission:
Helping traders build confidence, discipline, and a solid edge in the markets.
BTCUST.P trade ideas

Bitcoin (BTC): Buyers Secured 200EMA | Going For $116-117KBTC finally managed to break above the 200EMA after multiple failed attempts — a key bullish signal we’ve been waiting for. Buyers have been showing strength since the reaction from the liquidity zone, and this breakout adds further confirmation to our bullish scenario.
Our next focus remains the bullish CME gap around $116K–117K. As long as buyers hold momentum above the 200EMA, continuation to the upside is the plan.
Swallow Academy

BTCUSDTHello Traders! 👋
What are your thoughts on BITCOIN?
Bitcoin has entered a corrective phase after printing a new all-time high and reaching the top of its ascending channel.
This pullback is expected to extend towards the key support zones, and in a deeper scenario, it could test the bottom of the channel.
As long as Bitcoin holds above these support areas and reacts positively at the lower boundary of the channel, the broader outlook remains bullish, with potential for new all-time high
However, a decisive break below the channel’s bottom would invalidate the medium-term bullish scenario and raise the risk of a deeper correction.
The current correction may provide a valuable opportunity for medium- to long-term traders to re-enter the market.
Don’t forget to like and share your thoughts in the comments! ❤️

BITCOIN → Breakthrough of the downward trend resistance... 120K?BINANCE:BTCUSDT.P formed a false breakdown of key support at 110,000 - 112,000 and returned to the whales' zone of interest. The chart shows the prerequisites for a possible end to the countertrend correction...
A false breakdown of the daily support of 110K - 112K provokes a local bearish rally, within which the price breaks through the downward resistance of the correction and tests 113.300. The growth was supported by positive signals from institutional investors, technical stability and a decrease in selling pressure.
The fundamental background is positive, the market is trending. The chart shows prerequisites for the end of the correction. However, the further outlook depends on the 112.0 - 112.5K area. if the bulls hold the price above this zone, the flagship may return to the upward movement and head towards 117K - 120K.
Support levels: 112.5, 112.0, 110.9
Resistance levels: 113.6, 114.6, 117.0
After breaking through the resistance of the descending channel, the impulse stops and most likely a fight for the 112K zone may form. If the price returns to the channel and consolidates below 112K, then Bitcoin may return to the downward movement, however, while the price is trading above this line, the bulls have a chance...
Best regards, R. Linda!

Short term accumulation at 110k, 123.7k PossibleThey scammed the weekly near to the top of the last candle and they can do the same with the monthly.
But it can also drop at 113k.
I will be waiting for further confirmation to Short, but not yet.
Lots of bears feeling confident given the monthly candle but the upwick of the monthly could go as high as this.
There is a 5 min supply zone there too.

BIG RISING WEDGE BTCUSDTA significant rising wedge pattern is forming in the BTCUSDT movement. A sell entry opportunity is available on BTCUSDT with a stop-loss position at the swing high on the H4 timeframe and a take-profit position at the nearest support area at $107,000 and the second support area at $100,000. Disclaimer: All risks are the responsibility of the trader, and this is solely my personal analysis.

My next trade idea! 🔎 What we do:
Identify high-probability setups
Break down price action with clarity
Focus on continuation plays, deviations, and market structure shifts
Keep learning simple, practical, and effective
⚡ Today’s Trade Idea:
Setup: Simple continuation play from demand OR a deviation play from the consolidation range.
Entry Trigger: Waiting for a market structure change ✅ for confirmation before involvement.
💡 Mission:
Helping traders build confidence, discipline, and a solid edge in the markets.

BTCUSDT Idea | Potential RiseHi there,
I expect prices to go up from the lower price range to the higher price range, reaching about 118,000-119,000. There might be a quick rise to this higher range, where prices could then start to fall. After this change in direction, prices could drop to around 102,000.
Happy Trading
K.
Not trading advice

TRADE OF THE WEEKEND! TRADE ME 🚨 In today’s video, I share my market outlook 📊 and highlight the importance of patience ⏳ when it comes to:
✔️ Planning your trades 📝
✔️ Executing with discipline 🎯
✔️ Weighing up cost–benefit before entry ⚖️
💡 Remember: Risk isn’t just about potential loss ❌ — it also signals which trades are worth entering ✅ and which to skip 🚪.
⚠️ Just because the market feels slow doesn’t mean we crank up the risk 🎲 and gamble away hard-earned gains 💵.
Right now, I’m watching 👀 the lower-high continuation play, but I’m also mindful of the recent selling pressure 📉 that could still play out.
🔑 I won’t be entering trades until I see clear market structure confirmation 🏗️.
BTC ANALYSIS📊 #BTC Analysis
✅There is a formation of Descending Channel Pattern in daily time frame in #BTC .
Also there is a perfect breakout and retest. There is an instant major resistance and major support zone and if #BTC breaks the resistance zone then we would see a bullish move
👀Current Price: $1,10,800
🎯 Target Price : $1,21,700
⚡️What to do ?
👀Keep an eye on #BTC price action and volume. We can trade according to the chart and make some profits⚡️⚡️
#BTC #Cryptocurrency #Breakout #TechnicalAnalysis #DYOR

112.8k/113k is possible before the dropThe weekly close will be bearish whatever happens, even if it ends green.
A few days enticing buyers who see the green weekly while taking weekend shorts would make sense.
But of course it can also drop here.

BTC Analysis 1H - Key Triggers Ahead | Day 32💀 Hey , how's it going ? Come over here — Satoshi got something for you !
⏰ We’re analyzing BTC on the 1-hour timeframe timeframe .
👀 On the 1H timeframe of Bitcoin, we can see that after yesterday’s news BTC moved upward but got rejected at the $112,300 zone. It then found support at the bottom of its ascending channel. Bitcoin is now waiting for tomorrow’s NFP release. The key level that price reacted to is $112,300 — a breakout above this zone could trigger another move to the upside. The current support is around $110,340, and if this level breaks, the next major support lies near $107,500.
⚙️ RSI key zones are at 36 and 70. If momentum breaks through these areas, Bitcoin could start a stronger move.
🕯 The size and volume of the recent red candles indicate selling pressure. However, when price bounced from the channel bottom, the bearish momentum weakened. If selling pressure increases and the support is lost, red candles may grow even larger.
📊 Looking at the 1H Tether dominance (USDT.D), after the recent drop it shows signs of a rebound and is completing its pullback on this timeframe. The key zones to watch are 4.39% and 4.47%. A breakout above these levels could bring significant trading volume into Bitcoin.
🔔 Alert zones for Bitcoin are set at $110,340 and $112,334. A breakout of either zone could provide us with trade opportunities. Keep in mind that the current structure is ranging and compressed, so it’s better to trade with lower risk.
❤️ Disclaimer : This analysis is purely based on my personal opinion and I only trade if the stated triggers are activated .

#BTCUSDT 2H ChartPrice has bounced off the 30mins demand zone and it currently ranging between the 100MA and the 200MA. MACD is turning bullish, EMAs are neutral. Price is currently expected to keep rising until the 112k level as a short-term target where we have a minor supply zone.

ETH: Drop from $4600"
On August 25, Ethereum turned downward from the $4,600 area on the 4-hour chart. Price confidently broke through several key levels and, by the time the third target was reached, touched $4,272. The maximum difference amounted to roughly $340 per coin — a move that highlighted both the strength of the trend and the importance of managing a trade step by step.
The key here isn’t just the result, but the discipline behind it. The algorithm marked profit-taking levels and guided the position, removing emotions from the process. This made it possible to follow the market’s flow instead of guessing at its chaotic swings.
For beginners, this approach is a shortcut that saves years of trial and error while learning basic patterns. For intermediate traders, it’s a tool that accelerates decision-making and minimizes mistakes. For professionals, it’s about saving time and maintaining discipline. For investors, it’s a clear way to monitor entry and exit points without being overloaded with noise.
The market will always test nerves. But when the process is guided systematically, trading shifts from emotional struggle to a structured, disciplined approach."

Bitcoin BTCUSDT 4H – Rejection at Resistance, More Downside Bitcoin is still trapped in a clear range between the red supply zone (111k–112k) and the green demand zone (108.5k–107k).
Price just tapped resistance again and showed rejection, giving us a possible lower-high formation. If momentum holds, the next move could be a drop back toward the green demand zone.
🔴 Resistance Zone: 111k – 112k
🟢 Support Zone: 107k – 108.5k
📉 Bias: Bearish if rejection holds.
---
💭 What do you think, traders?
Will BTC break above the red zone this time? 🚀
Or is another drop to demand coming soon? 📉
👇 Share your thoughts in the comments & don’t forget to like ❤️


Bitcoin Faces Bearish Reversal With Potential Dip Toward $98K !!Bitcoin (BTC) Market Analysis – Current Outlook
Bitcoin has stepped out of its primary bullish trend, after two successful resistance touches around $112K and $124K. This movement has established a potential double-top pattern, which historically signals a bearish reversal.
Currently, BTC is trading within a mini bearish trend, consolidating at a confluence zone that aligns with past market reactions. Price action is at a decision point:
Bullish scenario: A rebound from current levels and reclaim of momentum above $113K to $124K could negate the bearish setup, confirming that the recent move is only a corrective pullback.
Bearish scenario: Failure to hold this zone may trigger further downside, with potential continuation toward the $98K support area, which serves as the next major demand level.
BTC is now at a critical junction, and traders should watch for confirmation signals before positioning.

BTC/USDT 4hour chart update !! BTC/USDT
Downtrend Channel Broken
Bitcoin was moving inside a descending channel (highlighted).
The price has now broken above the channel, indicating a potential trend reversal from bearish to bullish.
Support Zone
The green area around $107,000 – $108,000 acted as strong demand/support.
BTC bounced sharply from this zone, confirming that buyers stepped in.
50 Red MA (short-term) → Recently crossed above price, but BTC reclaimed it, turning it into support.
200 Green MA (long-term) → Sitting around $114,000, which may act as the next resistance.
Trendline Support
An ascending trendline (black) is holding current price action.
As long as BTC respects this line, the short-term outlook remains bullish.
Resistance: $114,000 (200 MA zone) → first big hurdle.
Higher target: $118,000 – $120,000 if momentum continues.
Support: $110,000 (trendline) and $108,000 (demand zone).
📈 Outlook
Bullish bias as long as BTC holds above $110,000 support/trendline.
A break above $114,000 could trigger a push towards $118K – $120K.
If BTC loses $110K, risk of retesting $107K – $108K support zone.
DYOR | NFA

BTCUSDT (Daily)### 🔎 **Chart Context**
* Pair: **BTC/USDT**
* Exchange: **Binance**
* Timeframe: **1D (Daily)**
* Current price: \~**110,880**
* BTC has retraced from the **124,474 top** and is now stabilizing above the **111,920 support zone**.
* Projection points toward a **bullish continuation toward 138,000** after reclaiming mid-range resistance.
---
### 📊 **Key Observations**
1. **Market Structure**
* BTC printed a **higher high at 124,474** in August.
* Pullback into **111,920 support zone** has been defended.
* Structure remains **bullish** on daily timeframe as long as BTC holds above **100,000 – 111,000 range**.
2. **Support Zones**
* **111,920 – 110,530**: Immediate support, currently holding.
* **99,475 – 100,372**: Strong historical support cluster, high-volume node on VPVR.
* **88,765 – 90,500**: Deeper demand zone if broader correction occurs.
3. **Resistance Zones**
* **119,902 – 123,218**: First major resistance ahead.
* **124,474**: Swing high and liquidity cluster.
* **138,000 – 140,000**: Next big target & projected liquidity pool (aligned with chart’s TP).
4. **Volume Profile (VPVR)**
* Clear **volume gap above 120,000**, meaning once BTC reclaims **119,900**, price can accelerate toward **138,000**.
* Heaviest volume traded between **95,000 – 105,000**, forming a strong support base.
---
### 📈 **Bullish Scenario (Higher Probability)**
* Price sustains above **111,920 support**.
* Path:
* Retest 119,900 → Break 124,474 high → Rally into 138,000–140,000 zone.
* This aligns with projection, suggesting continuation after consolidation.
---
### 📉 **Bearish Scenario (Risk Case)**
* Breakdown below **111,920 – 110,530 support**.
* Next downside levels:
* **100,000 – 99,475** → Major support & volume shelf.
* **88,765 – 90,500** if selling accelerates.
* A daily close below **99,000** would shift structure to bearish mid-term.
---
### ⚡ **Trading Plan**
* **Long Setup (Preferred):**
* Entry: 111,920 – 110,530 support retest.
* TP1: 119,900
* TP2: 124,474
* TP3: 138,000–140,000
* Stop: Below 109,000
* **Short Setup (Countertrend):**
* Entry: Rejection from 119,900 – 124,474 zone.
* TP: 111,920 → 100,000
* Stop: Above 125,500
---
### ✅ **Conclusion**
BTC/USDT daily remains **bullish**, holding key support at **111,920**. The most probable scenario is **continuation toward 119,900 → 124,474 → 138,000**, with strong momentum if BTC reclaims **120K**. Only a breakdown below **100K** would invalidate the bullish trajectory.

$BTC Bounce Holds Strong: Eyes on $124.5K NextCRYPTOCAP:BTC is holding steady around $114,000 after bouncing right off the $111,600 support zone.
Buyers stepped in strongly at that level, showing they’re not ready to let the price drop further.
This green zone is acting as a solid base, and if BTC can continue to close above it, momentum is likely to shift back toward the upside.
The next key target sits near $124,500, which lines up with the last major swing high.
As long as we remain above $111,600, the market structure appears healthy, and bulls still hold the upper hand.
DYOR, NFA

Bitcoin Is Hiding Something BIG (Target Revealed)In Episode 17 of my Bitcoin daily analysis , we just hit a +2.3% gain from the last long trigger, and now BTC is pressing against a critical resistance. If this level breaks with volume, the next +2.7% move could be right around the corner.
In this video, I’ll break Bitcoin down across weekly, daily, and 4H timeframes to show you:
Why this resistance is so important 🔑
How I set my next upside target step by step
The role of volume, BTC dominance, and TOTAL2/TOTAL3 in confirming moves
Whether altcoins (like ETH and SOL) are about to outperform Bitcoin
❌ Don’t FOMO.
✅ Stick to risk management.
✅ Trade your plan, not your emotions.
If you found this analysis helpful, share it with your trading friends and let’s grow smarter together.

Bitcoin Quick Buy Opportunity for Quick TradersBTC,
Currently, Bitcoin is trading within a tight consolidation range, caught between a descending trendline and an ascending trendline on the 1-hour chart.
The price is forming a potential compression pattern, which often precedes a breakout.
while volume spikes indicate active demand around the green zone.
Additionally, there are visible whale buy orders and volume confirmation near the ascending trendline shown in the chart, strong enough to potentially push the price higher.
These orders are clustered around 110,650.
I will follow a strategy and enter from the same level.
My plan is as follows:
✅ Entry: Buy if price retraces to green line 110,650
🎯 Target 1: 111,250
🎯 Target 2: 111,600
Please keep monitoring this setup, as I use strategies based on observing supply and demand flows.
I will update you with any changes in entry points, targets, or shifts in order book dynamics.
Important Note:
This is not financial advice.
I am only sharing my own trades and personal analysis, which reflect my individual perspective.
Please always do your own research.
Good luck in your trades.
Best Regards 🌹
