BTCUSDT.P - December 2, 2025Bitcoin remains in a broader downtrend but is currently consolidating between resistance around 87,400–87,700 and support near 83,400. The chart outlines a potential breakout toward 91,375 if price can reclaim and hold above the consolidation range, with that level marked as the primary profit target. Conversely, a failure at resistance and a break below 83,400 would confirm renewed bearish momentum toward the lower profit zone around 80,000. Trend structure is neutral-short term within this range, and a decisive move outside the highlighted consolidation band is needed to confirm the next directional leg.
Trade ideas

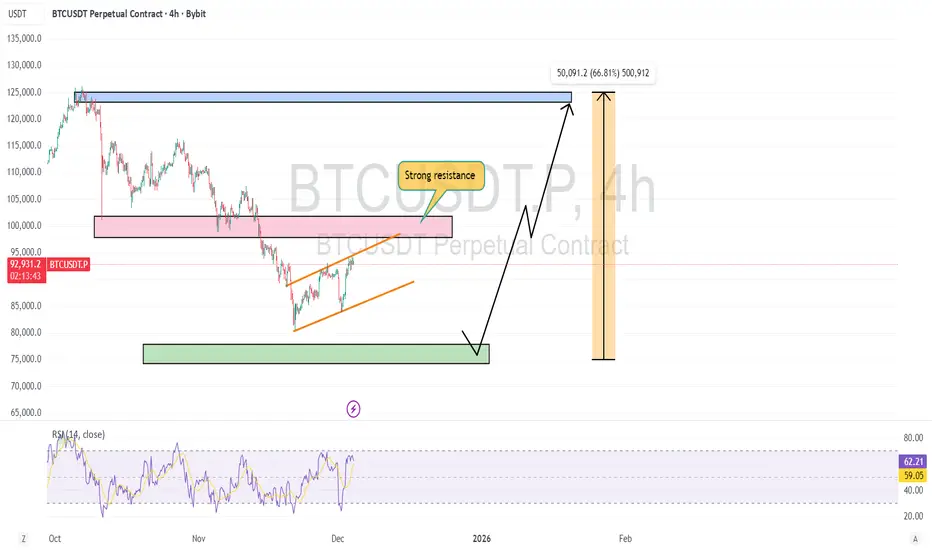
$BTC 4H CHART UPDATE 📌In my opinion, CRYPTOCAP:BTC has not fully recovered yet ✅
📌 CRYPTOCAP:BTC may turn bearish again from the STRONG resistance zone above ✅
📌I still have to say that a strong bull needs to touch a strong support zone🔥
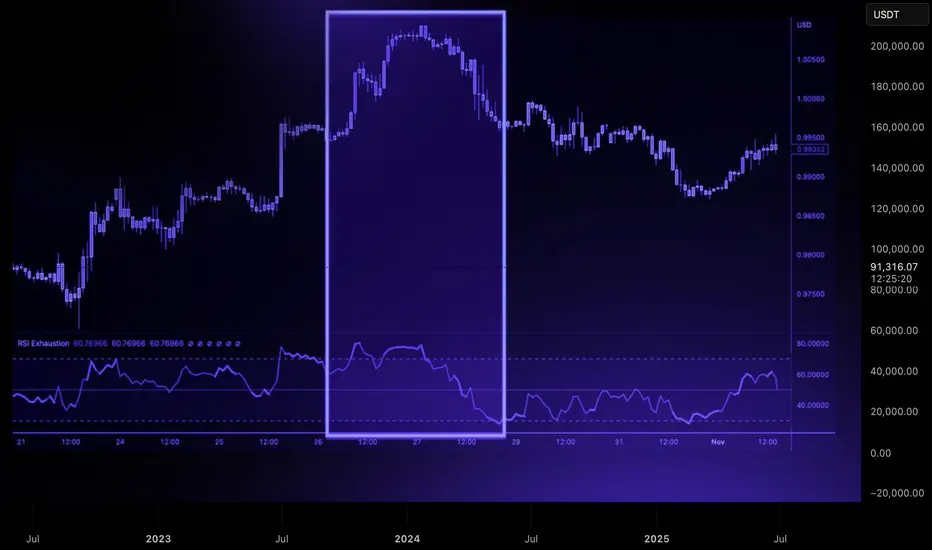
Trend Exhaustion: How to Spot a Reversal Before It HappensReversals rarely start with dramatic candles. They begin quietly, through subtle shifts in momentum and structure that most traders overlook.
A strong trend doesn’t collapse all at once. It loses strength in stages, and those stages are visible long before price turns in the opposite direction.
The first sign of exhaustion is weakening impulse strength. In a healthy trend, impulsive moves are clean and decisive, and retracements are controlled. When each new push produces smaller higher highs or lower lows, it signals reduced participation.
Buyers or sellers are still present, but the force driving the trend is fading.
The second clue lies in how price interacts with liquidity. Strong trends break key levels with conviction. Exhausted trends start reaching above highs or below lows only to reject immediately.
These sweeps show that the market is clearing liquidity without gaining follow-through, often trapping late entries and signaling that larger players are offloading positions.
A third indication appears when structure begins to fracture. An uptrend losing its higher-low sequence or a downtrend failing to maintain lower highs is a shift in narrative. A single break is not confirmation, but when it aligns with slowing impulses and liquidity failures, momentum is clearly changing.
Volatility then begins to compress. Candle ranges shrink, movement becomes less directional, and price enters a tightening pattern.
This compression often precedes expansion in the opposite direction. When a decisive candle breaks out of this cluster, the reversal typically accelerates.
Trend exhaustion is about recognizing when the conditions that supported continuation no longer exist.
By reading momentum, liquidity, and structure together, you can anticipate shifts earlier, manage risk more effectively, and position yourself on the right side of the next move.
A Bearish SentimentHey guys, Bitcoin on the 4H is setting up what looks like a textbook distribution pattern, and I'm leaning bearish here despite the recent bounce off $87,688.
Price is currently trading at $91,332, sitting in a really uncomfortable middle zone. We're above the short-term moving averages (EMA20 at $90,193 and EMA50 at $90,276), which on the surface looks bullish. But here's the problem: we're still firmly rejected below the EMA200 at $93,179, and that level's been acting as a ceiling for multiple sessions now. Every time we push toward $92,900-$93,200, sellers step in hard. That's your primary supply zone, and it's reinforced by the Bollinger Band upper limit at $92,918.
The indicator stack is where things get really interesting. ADX is screaming at 77.1, that's extreme trend strength, folks. But which trend? The MACD is still bearish at -286.85 versus signal at -284.68, telling us the momentum remains to the downside despite this bounce. More importantly, check out the Stochastic at 96.4, that's massively overbought on the 4H timeframe. When you see Stochastic that extended, you're usually near a local top, not the beginning of a rally.
Here's where it gets spicy: the MFI is sitting at just 22.9. Let that sink in. Price is pushing higher, Stochastic is overbought, but money flow is absolutely anemic. That's classic divergence, price going up on declining participation. Smart money's distributing into strength while retail's buying the breakout. I've seen this movie before, and it doesn't end well for late buyers.
Volume analysis supports the bearish thesis. We're running 30% above average at $26,852, which confirms active participation. But notice the wick structure: 18.4% lower wick shows buyers stepped in aggressively, yet we've got a 5.6% upper wick showing sellers immediately absorbed that pressure. In a healthy uptrend, you want to see small upper wicks and strong closes. This candle structure screams exhaustion.
From a structural perspective, we've formed a higher low (bullish), but we haven't confirmed a higher high yet (neutral to bearish). That makes this a potential bear flag rather than a reversal pattern. The Bollinger Bands are telling a similar story, we're trading just above the middle band at $90,391, but we haven't been able to sustain any momentum toward the upper band. That middle band is now acting as resistance rather than support, which is a bearish flip.
Support levels to watch: immediate support sits at the HMA55 around $90,540, then the EMA20 at $90,193. If those break, we're looking at a quick move back to the lower Bollinger Band at $87,864, which aligns with today's low of $87,688. That zone saw significant buying interest earlier, so it should provide a bounce, but if it fails, we could see acceleration toward the $86,200-$85,500 range where weekly support clusters.
Resistance is clearly defined: $92,918 (Bollinger upper), $93,179 (EMA200), and $93,500 (psychological). Any sustained move above $93,200 would invalidate this bearish setup and suggest we're heading for price discovery toward the $95,000 zone. But with current momentum and indicator readings, I'm assigning less than 30% probability to that scenario.
Trading setup: I'm looking at short entries in the $89,800-$90,500 range if we get a lower high formation on the 1H chart. Stop loss goes above $92,500 to give room for a false breakout. Targets are $87,800 (TP1), $86,200 (TP2), and $85,000 (TP3) for the aggressive traders. Risk/reward on this is roughly 1:2.5 to first target, which is acceptable given the confluence of bearish signals.
The internal market state shows bullish bias but only 38.6% directional confidence, that's essentially a coin flip, and when the algos are this uncertain, I fade the recent move. The 6-2 bull-bear stack sounds bullish until you realize that's only 75% agreement, and with ADX this high, we need near-unanimous confirmation for continuation.
Bottom line: this looks like a corrective bounce within a larger downtrend rather than the start of a new leg up. The combination of overbought Stochastic, weak money flow, bearish MACD, and resistance cluster overhead tilts the probabilities toward downside resolution. I'm giving this a 68% confidence bearish call, not slam-dunk territory, but enough edge to take a position with proper risk management.
What are you guys seeing here? Are you fading this bounce or waiting for confirmation above $93,200?

BTCUSDT KEY SUPPORT ZONES FOR LONG ENTRIESThe chart shows significant support that could present buying opportunities, while resistance levels above indicate potential profit targets.

BTC 15-Min Range: Fueling Up for 90Kthis is the 15-minute Bitcoin chart. The price is currently ranging between 85,000 and 87,000, and this phase is for gathering energy or Accumulation.
Main Analysis: This ranging movement is necessary to grab liquidity and prepare for the next big move.
The chart's potential is still bullish, and we expect that after this range is over, the price will break above strongly and repeat its move up to the 90,000 area!

BITCOIN - PRESSURE BUILDING - SHORT SQUEEZE INCOMING?Traders,
Bitcoin might be preparing a short squeeze. Let’s walk through the flow, structure, math, and correlations step-by-step so you understand what is happening and why it matters.
1. What Happened
Bitcoin dumped from 96k → 80.6k last week. Price then bounced and is now trading around 87k.
Under the surface:
Stablecoin-Margined Futures (USDT-M)
Since 27 Oct:
OI increased from 225k → 280k contracts
That’s +55k contracts (~24% increase)
CVD went down, not up
Meaning:
These new positions were mostly shorts
The market added leveraged short exposure during the dump
Interpretation:
USDT-M traders attacked the move lower aggressively. Increasing OI + dropping CVD = new sellers dominating, not buyers.
Coin-Margined Futures (BTC-M)
Since 27 Oct:
OI and CVD both dropped from 7.41B → 5.90B
BTC-M is usually “higher conviction” demand
A drop in BTC-M CVD means
Longs closing
Capitulation
Reduced bullish positioning
Interpretation:
Native BTC longs stepped aside. Short-term leverage traders pressed the downside.
Spot + Futures CVD (27 Oct → 21 Nov)
Spot CVD ↓
Futures CVD ↓
Price ↓
All making lower lows and lower highs
This was a clean, correlated downtrend.
2. The First Major Shift: Spot CVD Divergence
Since 21 November:
Spot CVD:
Higher highs
Higher lows
Rising together with price
Indicates real demand stepping in
Stablecoin Futures (USDT-M):
Still making lower lows
Still pressing shorts
Still fighting the spot buyers
This is the key:
Spot = real money
Futures = leveraged speculation
Rising spot CVD vs falling futures CVD = absorption pattern
Meaning:
Strong hands buy
Weak shorts keep selling
Price rises anyway
The pressure builds
Shorts eventually run out
The squeeze begins
This is one of the cleanest pre-squeeze structures you can get.
3. The Math: Fibonacci Rotation Logic
Let’s break down the structure.
(A → B → C Structure)
A = 116k (27 Oct)
B = 98.710
C = 107.403 (retracement)
The retrace sits at 0.5.
The reciprocal extension is 2.0
The 2.0 extension lands exactly at the 21 Nov wick (~81k)
This is a perfect harmonic rotation.
(X → Z → A Extension)
X = 06 Oct high
Z = 18 Oct low
A = 27 Oct high
Fibonacci extension from X → Z → A:
1.618 extension = 80.544
It matches the 2.0 from the ABC structure
It matches the 0.886 retracement on the HTF
Three independent mathematical signals hitting the same level. This is extremely rare and confirms the 81k zone as a rotation completion.
4. Structure Break
Since the 10 Nov low:
4H is making higher highs & higher lows
The descending trendline from 11 Nov is broken
Trend shifted from controlled downtrend → early reversal
Structure now favors continuation upwards as long as higher lows hold
Interpretation:
Sellers who relied on the trendline no longer have control.
4.5 Intermarket Correlation: Why Bitcoin Dumped When ES Dumped
Another important factor:
Bitcoin dumped because ES dumped.
From 12 Nov → 21 Nov:
S&P500 (ES)
Dropped from 6900 → 6525
–5.43% correction
Bitcoin:
Dropped from 107k → 80.5k
–24.77% correction
BTC acted as a ~4.5× levered version of ES.
BTC acted as a ~4.5× levered version of ES.
Correlation Data:
Rolling BTC/ES correlation increased from 0.38 → 0.74
Meaning BTC traded almost in sync with equities during the selloff
Why?
Risk-Off Mechanics
When ES sells off:
Equity funds de-risk
Macro algos rotate out of high beta
Volatility spikes
Systematic funds reduce exposure
Crypto is treated as “high beta tech”
BTC amplifies the move by a factor of 3–5×
Bitcoin didn’t dump because crypto was weak — It dumped because macro markets were risk-off.
Why this matters now
ES has stabilized
BTC stopped following ES lower
Spot demand started rising
BTC/ES correlation is dropping again (from 0.78 → ~0.55)
USDT-M shorts didn’t adjust
This is exactly when short squeezes start on BTC:
Macro stabilizes
Crypto regains independence
Shorts remain positioned for risk-off
Spot buyers take control
Price accelerates upward
This is a classic intermarket correlation unwind.
5. USDT Dominance (USDT.D) Confirms Risk Rotation
USDT dominance has turned down, which means:
Traders are deploying capital
Less stablecoin sitting idle
More risk-on appetite
Historically aligns with BTC beginning new legs up after HTF rotations
When USDT.D falls at the same time spot CVD rises, the market is shifting capital into crypto.
6. Targets: 118.5k → 124k
These are the next liquidity magnets.
Target #1: 118.5k
Confluences with:
1.141 extension of the 11 Nov → 12 Nov move
First major liquidity pool
First real “decision point” for the market
Target #2: 124k
Confluences with:
A weak high that will be swept
1.618 extension of the same 11→12 Nov move
Natural squeeze exhaustion zone
Perfect location for a Swing Fail Pattern
Rotation Logic
Shallow retraces → larger extensions (1.618 → 2.0)
Deep retraces → smaller extensions (1.272 → 1.414)
BTC currently fits the shallow retrace profile → favors strong extension
7. Other Pivot Points
Marked on the chart:
Minor LVNs
Minor-imbalances
CME Gaps
Expect reaction at each point.
8. Invalidation & Bearish Pathway
My invalidation is clear:
Trading below 80k invalidates the squeeze setup.
Below 80k, the absorption breaks.
If 80k is lost, the downside extension levels become:
74k
70k
64k
These levels are:
The natural downside extension pathways from the 11 Nov → 21 Nov swing
They form the mirrored rotation of the bullish structure
Final View
We dumped because macro went risk-off
Bitcoin amplified the ES selloff
Shorts loaded heavily into the move
Spot buyers stepped in first
A clean absorption pattern formed
Mathematical rotation completed at ~81k
Structure flipped
Risk metrics like USDT.D turned down
Correlation with ES is now unwinding
If Bitcoin continues to hold above 80k and spot keeps leading, the squeeze toward 118.5k → 124k becomes the most likely path.
Abbreviation List
BTC – Bitcoin
ES – S&P500 E-Mini Futures
OI – Open Interest
CVD – Cumulative Volume Delta
USDT-M – Stablecoin-Margined Futures
BTC-M – Coin-Margined Futures
HTF – Higher Timeframe
LVN – Low Volume Node
AVWAP – Anchored Volume-Weighted Average Price
PRZ – Potential Reversal Zone
SFP – Swing Fail Pattern
Fib – Fibonacci
CTA – Commodity Trading Advisor (systematic trend-following funds)
VIX – Volatility Index
Beta – Sensitivity of an asset’s movement relative to a benchmark
Risk-Off – Market environment where investors reduce exposure to risky assets
Risk-On – Market environment where investors increase exposure to risky assets
-----
If you enjoy this type of deep, data-driven breakdown—spot vs futures, CVD flow, intermarket correlation, and rotation math—drop a like and leave a comment. It helps me see whether these higher-level analyses bring value, and it motivates me to keep sharing them for free.

BTC/USDT 4H chart review📉 1. Market structure – short-term 4H trend
In the chart I see:
• Breaking the upward trend line (black diagonal) – a classic signal of weakening momentum.
• After the breakout, there was a quite strong downward impulse, which confirms that the intraday trend has turned bearish.
• The price is currently testing around USDT 89,500-90,000, where a reaction is emerging, but not strong yet.
👉 Conclusion: 4H is now in a bearish correction and the market looks ready to test further lower supports.
⸻
🧭 2. Support and resistance levels (from your chart)
Upcoming supports:
1. 89,500–89,000 – the current level at which the market is trying to defend itself.
2. 88 185 – clear red line, first logical support lower.
3. 86,001 – next demand level, big candle from the past.
4. 83,720 – deeper support to which the market returns when there is great fear.
The nearest resistances (which need to be recovered to return to growth):
1. 90,467 – first key resistance; now it will work as a "flip".
2. 91 923 – stronger resistance; This is where the declines began.
3. 94,223 - only breaking this level shows that the bulls are back.
👉 The market is currently sitting BELOW the key resistance of 90,467, so downward pressure is active.
⸻
📉 3. Analysis of candles and price behavior
• The last 4-6 candles are large red bodies, which shows the clear dominance of supply.
• After the breakout of the trendline, there is no strong pullback - this means that the bears do not allow for a rebound.
• The lower shadow on the last candle indicates buyer reaction, but no confirmation yet.
👉 If 89,500 is broken, a move to 88,185 is very likely.
⸻
📉 4. MACD – negative signal
MACD shows:
• Bearish cross – the blue line crossed the orange line from above.
• The histogram turns into red bars - the downward momentum is increasing.
• MACD is below zero → confirmed downward trend in the 4-H interval.
👉 MACD confirms what we see on the chart: momentum is falling and a rebound is unlikely without consolidation.

BTCUSDT.P - December 8, 2025Bitcoin is stabilizing after a prior downside leg and is now trading in a broad consolidation just above the highlighted mid-range support band around 88,500–90,000, with a clearly defined resistance zone at 97,000–98,000. A break and sustained close above that resistance would confirm a bullish continuation toward the projected 105,000–106,000 area, with invalidation below the 93,300 stop region. Conversely, rejection from resistance followed by a loss of the 88,500–90,000 support band would reassert the broader downtrend and open the way for a deeper move toward the lower 80,000s.

[SeoVereign] BITCOIN BULLISH Outlook – December 09, 2025As of December 9, I would like to share Bitcoin’s bullish scenario.
Below are the main factors supporting the current rebound.
- Detailed Technical Basis
1) Reaching the completion zone of the 1.902 DEEP CRAB pattern
In the Deep Crab pattern, the 1.618 or 1.902 levels are considered reversal zones,
and when the BC extension and XA ratio converge simultaneously, a strong retracement structure is formed.
This aligns with the typical pattern conditions in which the market attempts a meaningful rebound.
2) Overlap of key Fibonacci 0.618 ~ 0.886 retracement zones
The 0.618 ~ 0.886 levels, which serve as the basis for the mid-term trend, are currently overlapping near the price,
forming a strong buy-side defense zone.
This area has acted as a pivot for directional reversals multiple times in the past,
and it now carries sufficient probabilistic context for a similar reaction to occur again.
3) Detection of initial signals of market structure shift
Even as the price continues to decline, bearish momentum is slowing,
and a classic absorption pattern seen in oversold conditions is appearing in the volume structure.
This is not yet a confirmed reversal signal but can be interpreted as an early movement preparing for a rebound.
- Strategy and Target
Based on these factors, I have set the average target zone for this rebound at 92,450 USDT.
If upward movement unfolds, I will reassess whether to continue holding at that level.
I plan to gradually increase long positions based on the technical conditions described above.
Further updates to position management will follow depending on market movement and indicator changes.
Thank you for reading.

BTC Sell SetupBTC has swept the HTF 4H liquidity, i.e it has taken out the highs. ON 15 mint it has given a minor CHOCH indicating the reversal. ON 1H there is a clear RSI divergence as well, indicating this is just a extension move to grab liquidity. We are targeting 3:1 on the down side.

BTCUSDT.P – Bullish Reversal Targeting Key HighsPrice has swept the recent low near 89,934, triggering a sell-side liquidity grab and creating a Fair Value Gap (FVG) in the discount zone. This setup offers a high-probability long entry targeting the major swing highs from the previous structure.
• Direction: Long
• Entry Zone: 90,000 – 90,200 (Reaction within the FVG & mitigated sweep zone)
• Stop Loss: 89,600 (Below the swept low)
• Take Profit 1: 97,000 (Key previous high & major liquidity zone)
• Take Profit 2: 100,500 (Major swing high / equal legs expansion)
• Take Profit 3: 102,000 – 104,000 (HTF extension & liquidity target)
• R/R: Exceptional – Tight stop below sweep, aiming for significant higher-timeframe targets.
Key ICT/SMC Observations:
Liquidity Sweep Complete: Sell-side cleared below 89,934.
FVG & Order Block: Zone 90,000–90,200 provides premium entry.
Break of Structure: Awaiting move above 90,345 for confirmation.
Target Alignment: TP1 at 97,000 (previous high), TP2 at 100,500 (major swing), TP3 for full range expansion.
Bias is bullish while price holds above the swept low. Entry within the FVG targets a move back into the range, first toward 97,000, then 100,500+.

#BTC Rising Wedge📊#BTC Rising Wedge📉
🧠From a structural perspective, the daily chart correction is not yet over. Currently, it's within the blue resistance zone, so we still need to maintain a cautious approach.
➡️From a chart perspective, a rising wedge has gradually formed within the blue resistance zone. We generally use this model for corrections.
⚠️If we break through the blue resistance zone, it will turn into a support zone. Only then, with a suitable pullback, can we look for long trading opportunities.
🤜If you like my analysis, please like 💖 and share 💬
BITGET:BTCUSDT.P

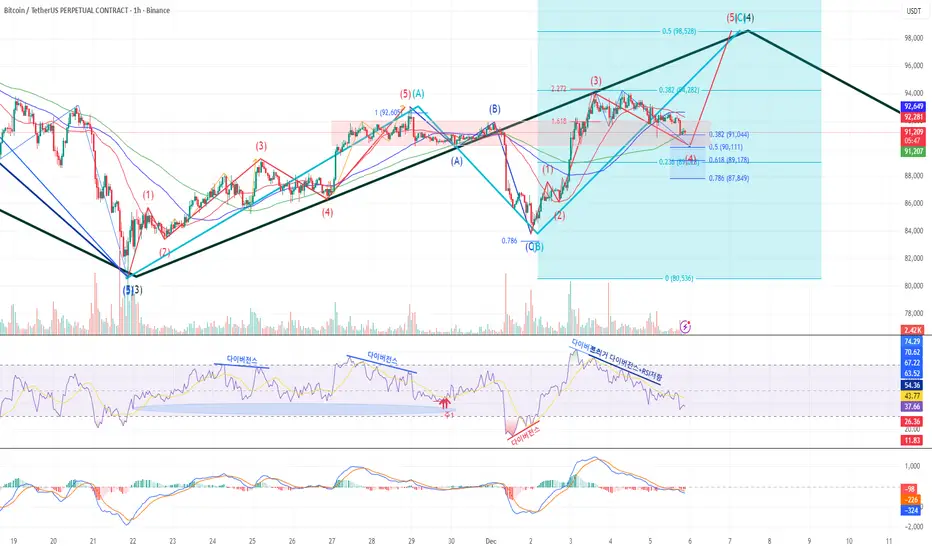
The larger Wave ④Bitcoin 1H Chart Analysis
Currently tracking a light blue ABC correction within the larger Wave ④.
Wave C is unfolding as a 5-wave structure; currently in Wave ④.
Adjusted the wave count this morning: what was initially labeled as Wave ① is now considered Wave ③, due to its extended size.
Wave ③ appears to have completed near the 2.272 Fibonacci extension.
A divergence formed, leading to the current Wave ④ pullback, which is finding support at a key supply-demand zone.
Watch for a MACD oscillator crossover — this could signal the start of Wave ⑤.
Focus on reactions at the support zone for trade decisions.
#BTC/USDT is currently strongly bullish#BTC
The price is moving in a descending channel on the 1-hour timeframe. It has reached the lower boundary and is heading towards breaking above it, with a retest of the upper boundary expected.
We have a downtrend on the RSI indicator, which has reached near the lower boundary, and an upward rebound is expected.
There is a key support zone in green at 92500. The price has bounced from this level multiple times and is expected to bounce again.
We have a trend towards consolidation above the 100-period moving average, as we are moving close to it, which supports the upward movement.
Entry price: 92990
First target: 93204
Second target: 93750
Third target: 94406
Don't forget a simple principle: money management.
Place your stop-loss below the support zone in green.
For any questions, please leave a comment.
Thank you.

BTC: Continue to Wait for an UptrendWe have been continuously signaling to go long on BTC, and all long orders placed below the 90K level have now started to generate profits. Next, we will continue to wait for a breakthrough above the 96K level to capture more profits.
I send out accurate signals every day to help you gain more profits. Don’t miss out!

#BTC Retests Resistance Zone📊#BTC Retests Resistance Zone⚠️
🧠As expected, the market found support near the short-term support level of 85358 and rebounded well. Currently, the price has retested the blue resistance zone. We should be wary of a potential pullback, so chasing the price higher here is not recommended. Instead, look for opportunities to short.
⚠️Note that if we successfully break through the blue resistance zone, we need to be cautious of a further surge.
🤜If you like my analysis, please like 💖 and share 💬
BITGET:BTCUSDT.P


BLACK SWAN322 and black swan
i cant tell more all in the chart. My last predict not in TV i predicted 10 october because i have signal from space)

BTC Trade Plan 06/12/2025Dear Traders,
appears to be a corrective bullish channel within a larger downtrend. This channel likely represents a pullback, increasing the probability of a downside continuation. The 94,500 – 98,500 zone is a major supply area that has acted as resistance multiple times and may trigger another rejection or fake breakout if retested. Should the price get rejected from this zone, the potential downside targets are 83,000, followed by 78,000 and 75,000. A bullish scenario becomes valid only if BTC closes a daily candle above 100,000, which could open the path toward the 105,000 – 110,000 resistance range. This is a market outlook and not financial advice — proper stop-loss and risk management are strongly recommended.
If this post helped you, consider boosting and sharing it. Thank you for the support.
Alireza!

Bitcoin 4H Update: Party's over... for now!Looks like BTC tried to break the top of its current channel (around $93.5k) but got firmly rejected by the :bear:
So, here’s the deal: Bitcoin needs to find its dancing shoes and make a big bounce from the immediate support line, which is hanging out around $92k. Let’s hope volume join the party.
If it can’t hold it, the next safety net is way down at the mid-range support around $89k

Bitcoin Eyes Technical Pullback Before Next Upward MoveHello everyone,
Bitcoin is pausing after a rebound from the 86,000 USD area, but upward momentum faces resistance around 92,000 USD—where a red FVG, old supply zones, and heavy volume converge. Every approach to this area triggers downward pressure, producing red candles near supply zones, showing that selling pressure remains significant.
Nonetheless, the macro backdrop supports buyers: a weaker USD, declining US bond yields, and expectations of Fed rate cuts in 2025–2026 help Bitcoin hold higher levels. ETF inflows are returning, institutions are buying on dips, while the broader market remains neutral without FOMO.
Technically, lower FVGs at 89,500–90,000, 88,000–88,500, and 86,500–87,000 USD provide reasonable retracement areas before the next breakout. The structure has yet to form a new high, upward momentum is weak, and selling pressure has slightly recovered; this technical correction is an opportunity for the market to gather liquidity.
Forecast: BTC may retrace to 89,500 USD, and if selling remains strong, it could test 88,000–88,500 USD. Subsequently, buying pressure should return, pushing BTC back toward the 92,000–93,000 USD resistance, continuing the long-term uptrend.

btc live tradeHello friends
Given the sharp upward movement we had, you can see that the sellers have made a high, which increases the possibility of a price correction, and we can witness a price increase in the price correction until the specified targets are reached.
This analysis is purely from a technical perspective and is not a buy or sell recommendation, so please observe risk and capital management.
*Trade safely with us*
