$AAPL📱 NASDAQ:AAPL Earnings This Week! 🍎
Apple’s earnings are right around the corner, and I’ve been noticing strong demand for the new iPhones even older models are still holding solid in the market.
After the latest iOS update, my older phone started slowing down a bit, which pushed me to upgrade (I use my phone daily for trading and keeping up with news). That experience alone made me realize how Apple continues to drive upgrades and repeat buyers.
With the holiday season coming up, I expect Apple products especially iPhones and accessories to stay in high demand. Accessories themselves are a massive market that shouldn’t be overlooked.
I’m also watching for retail traders to step in this week. Sellers seem willing to raise prices, so it’ll be interesting to see who takes profits and who rides it higher.
Let’s see if NASDAQ:AAPL delivers a strong report and keeps that momentum going. 🚀📊
Trade ideas

APPLE The Target Is UP! BUY!
My dear friends,
My technical analysis for APPLE is below:
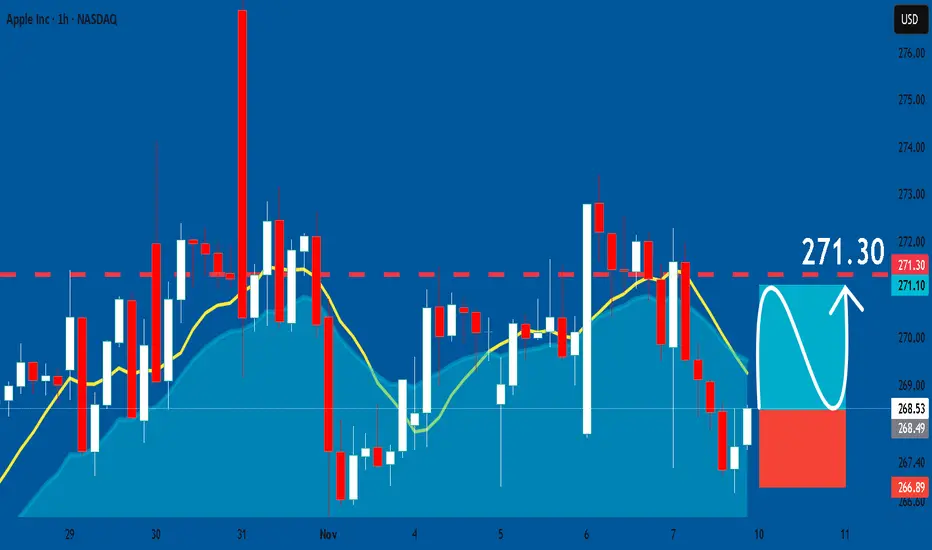
The market is trading on 268.53 pivot level.
Bias - Bullish
Technical Indicators: Both Super Trend & Pivot HL indicate a highly probable Bullish continuation.
Target - 271.24
Recommended Stop Loss - 266.96
About Used Indicators:
A pivot point is a technical analysis indicator, or calculations, used to determine the overall trend of the market over different time frames.
Disclosure: I am part of Trade Nation's Influencer program and receive a monthly fee for using their TradingView charts in my analysis.
———————————
WISH YOU ALL LUCK

APPLE: Long Trade Explained
APPLE
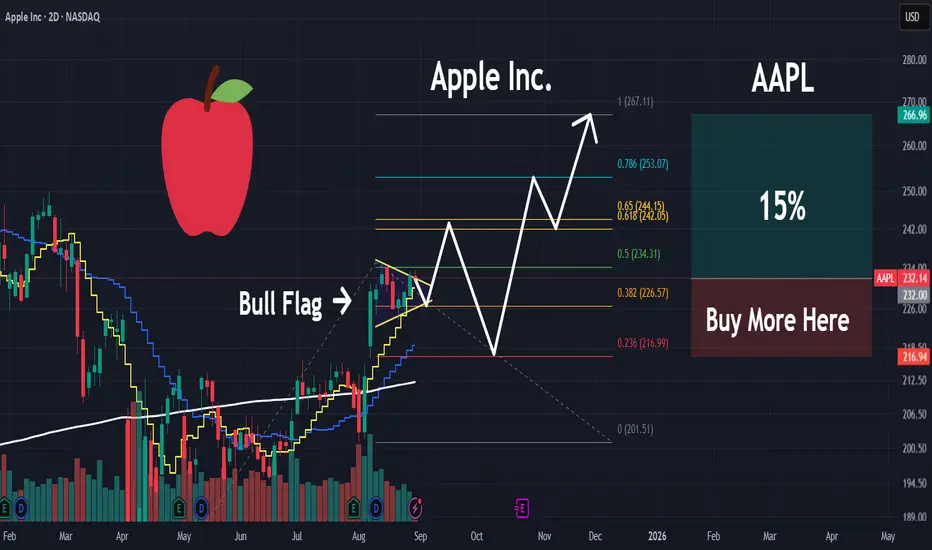
- Classic bullish pattern
- Our team expects retracement
SUGGESTED TRADE:
Swing Trade
Buy APPLE
Entry - 268.53
Stop - 266.89
Take - 271.30
Our Risk - 1%
Start protection of your profits from lower levels
Disclosure: I am part of Trade Nation's Influencer program and receive a monthly fee for using their TradingView charts in my analysis.
❤️ Please, support
Global Trade: Role of WTO, IMF, and World Bank1. The World Trade Organization (WTO): Guardian of Global Trade Rules
The WTO, established in 1995 as the successor to the General Agreement on Tariffs and Trade (GATT), is the central body overseeing international trade rules. Its main purpose is to ensure that trade flows as smoothly, predictably, and freely as possible among member nations.
a. Promoting Free and Fair Trade
The WTO works to eliminate trade barriers such as tariffs, quotas, and subsidies that distort competition. It encourages member countries to open up their markets and engage in fair competition. By doing so, it promotes economic efficiency, consumer choice, and technological advancement.
b. Trade Negotiations
The organization provides a platform where member nations negotiate trade agreements. These negotiations cover a wide range of areas including goods, services, intellectual property, and agriculture. One of the most notable negotiation rounds was the Doha Development Round, which aimed to address trade imbalances between developed and developing countries.
c. Dispute Settlement Mechanism
A major strength of the WTO lies in its dispute settlement body (DSB). When countries violate trade rules or engage in unfair practices, affected members can file complaints. The DSB then provides a legal framework to resolve disputes through consultations, panels, and appeals, preventing trade conflicts from escalating into political tensions.
d. Monitoring and Transparency
The WTO also monitors trade policies of member nations to ensure transparency. Regular reviews under the Trade Policy Review Mechanism (TPRM) help identify potential violations and encourage best practices.
e. Support for Developing Nations
Recognizing the challenges faced by developing and least-developed countries (LDCs), the WTO offers technical assistance and capacity-building programs. These initiatives help such nations integrate better into the global trading system.
In essence, the WTO acts as the referee of global trade—setting rules, resolving conflicts, and ensuring that trade remains fair and transparent.
2. The International Monetary Fund (IMF): Stabilizing Global Economies
While the WTO focuses on trade rules, the IMF ensures that global financial systems remain stable enough to support trade. Created in 1944 during the Bretton Woods Conference, the IMF’s primary goal is to maintain international monetary cooperation and financial stability.
a. Promoting Exchange Rate Stability
Stable exchange rates are vital for smooth global trade. Fluctuations in currency values can create uncertainty for exporters and importers. The IMF monitors exchange rate policies of its members and offers advice to prevent competitive devaluations that can harm global trade flows.
b. Providing Financial Assistance
Countries sometimes face balance of payments crises—when they cannot pay for imports or service foreign debt. The IMF provides short- and medium-term loans to help stabilize their economies. These loans often come with reform conditions aimed at improving fiscal discipline, reducing inflation, and restoring investor confidence.
c. Policy Advice and Surveillance
Through its Article IV consultations, the IMF regularly reviews member countries’ economic policies. This surveillance helps detect potential risks early and guides countries toward sound economic management. For example, the IMF has played a crucial role in guiding nations through financial crises such as the Asian Financial Crisis (1997) and the Global Financial Crisis (2008).
d. Capacity Development
The IMF assists countries in building strong institutions for monetary policy, taxation, and financial regulation. Through technical training and policy advice, it strengthens countries’ ability to manage economic shocks and engage more effectively in global trade.
e. Supporting Global Financial Cooperation
The IMF serves as a forum for global monetary cooperation. It brings together 190+ member countries to discuss international financial stability, thereby preventing unilateral actions that could disrupt global markets.
In short, the IMF acts as the world’s financial watchdog—ensuring that countries maintain macroeconomic stability, which in turn supports smoother and more predictable global trade.
3. The World Bank: Financing Development for Trade Growth
The World Bank, also established in 1944, complements the IMF by focusing on long-term economic development and poverty reduction. It plays a key role in helping countries build the infrastructure and institutions needed for effective participation in global trade.
a. Financing Development Projects
The World Bank provides low-interest loans, grants, and credits to developing countries for projects in infrastructure, education, healthcare, energy, and agriculture. Infrastructure such as ports, roads, and telecommunications directly supports trade by improving connectivity and reducing logistics costs.
b. Encouraging Private Investment
Through its affiliate, the International Finance Corporation (IFC), the World Bank promotes private sector development by offering investment and advisory services. This helps attract foreign investment, create jobs, and strengthen export capabilities.
c. Policy Advice and Institutional Reform
The World Bank offers expertise in designing policies that promote trade competitiveness, good governance, and efficient resource allocation. It also encourages structural reforms—such as liberalizing trade policies and improving business environments—to help nations integrate into global markets.
d. Poverty Reduction and Inclusive Growth
Trade alone cannot guarantee equitable growth. The World Bank ensures that the benefits of globalization reach vulnerable populations by funding programs in education, healthcare, and social protection. These initiatives build human capital, making countries more resilient and competitive in international trade.
e. Global Partnerships and Knowledge Sharing
The World Bank also acts as a knowledge hub—sharing best practices and research on development and trade-related issues. Its global partnerships with regional banks, the WTO, and the IMF enhance coordination and ensure a holistic approach to economic development.
In essence, the World Bank provides the financial and developmental foundation upon which global trade can thrive.
4. Interconnected Roles: A Cooperative Framework
While the WTO, IMF, and World Bank have different mandates, they often work together to achieve common goals:
WTO sets and enforces trade rules.
IMF ensures monetary and financial stability.
World Bank promotes development and infrastructure for trade.
For example, during global crises—such as the 2008 financial collapse or the COVID-19 pandemic—these institutions coordinated efforts to support economies. The IMF provided liquidity and macroeconomic stability, the World Bank funded recovery and health initiatives, and the WTO advocated against protectionism to keep trade flowing.
5. Criticisms and Challenges
Despite their contributions, these institutions face criticism.
The WTO is often accused of favoring developed countries and being slow to reform trade rules that disadvantage poorer nations.
The IMF has been criticized for imposing strict austerity conditions on loans, which can harm social welfare.
The World Bank has faced backlash for funding projects with environmental or social consequences.
Moreover, rising protectionism, trade wars, and global inequality present new challenges that require these institutions to adapt and modernize their policies.
6. Conclusion
The WTO, IMF, and World Bank form the backbone of the global economic order. Together, they promote fair trade, financial stability, and sustainable development—key pillars of a prosperous global economy. While their roles differ—rule-making, stabilizing, and financing—they are interdependent and complementary.
As globalization continues to evolve, these institutions must work collectively to address new issues such as digital trade, climate change, and inequality. Their continued cooperation will determine not only the stability of international trade but also the economic well-being of nations across the world.
In summary, the WTO ensures fairness in trade, the IMF safeguards financial stability, and the World Bank empowers nations to grow—forming a triad that underpins global economic progress.
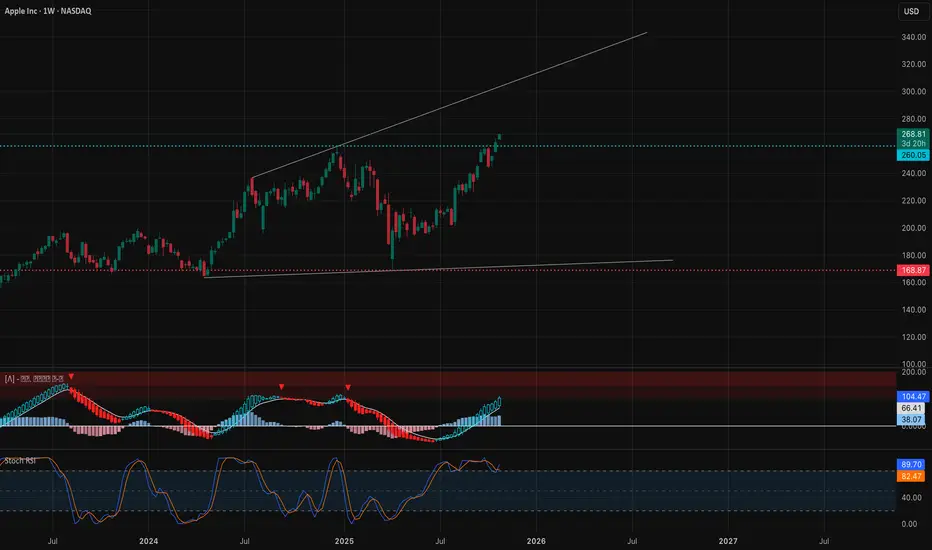
AAPL speculative swings, based on Quallamagie's 10/20/50.Where-ever AAPL would have good technical momentum swings. Should coincide with speculative, risk on periods. Think BTC rallies, etc. And they do.

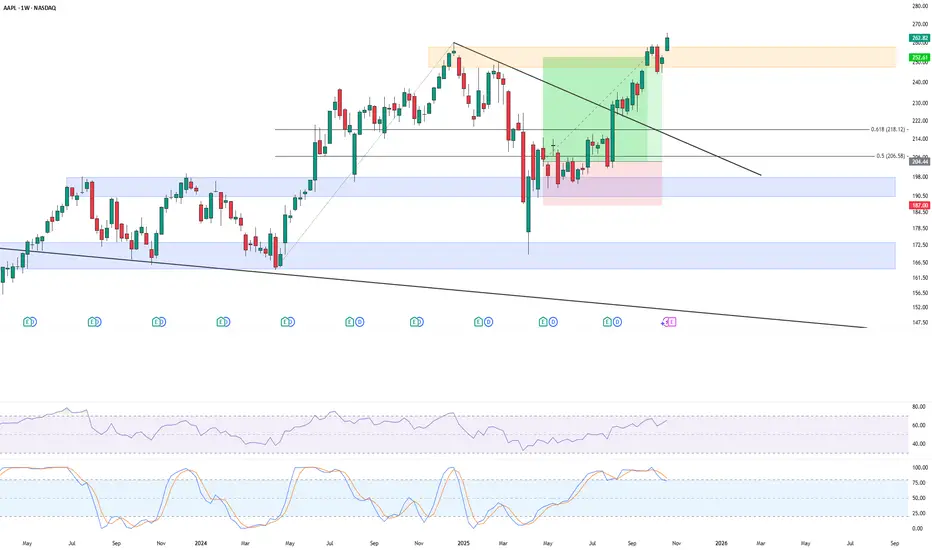
AAPL: Uptrend intact, but rich valuation—Is it worth the risk?AAPL: Uptrend intact, but rich valuation—Is it worth the risk?
Technical Analysis
1. AAPL is climbing within an ascending channel, forming series of higher swings with diverging multi-period EMAs, signaling a strong uptrend.
2. However, as price approaches the channel’s upper boundary, a pullback is possible, especially with a Bearish Divergence signal between the price and RSI. Any further upside may be limited in the near term.
3. If AAPL extends higher, resistance sits near 284.00 at the channel top.
4. If AAPL pulls back, the first key support is the previous resistance around 260.00 which will become support. A drop below the EMA200 would signal a bearish reversal.
Fundamental Analysis
Based on fundamentals following the Q3 performance release, Apple has several support factors, including:
5. Apple beat in Q3 FY25, with revenue of $102.47B (+8% y/y) and EPS of $1.85 (+13% y/y), beating analyst consensus, and diluted EPS came in at $1.85 (up 13% year-over-year, and above expectations).
6. Record services revenue and a 6% YoY rise in iPhone sales powered the quarter.
Guidance was upbeat, pointing to December-quarter sales of about 137.97 bln USD (+11% y/y), signaling firm demand for iPhone 17 and other products.
7. Shifting production beyond China, strong brand loyalty, and a growing services ecosystem are core long-term growth drivers, bolstering resilience against regulatory and supply-chain risks.
8. However, some analysts flagged the stock as “expensive” relative to historical valuation multiples (P/E ~36)
Analysis by: Krisada Yoonaisil, Financial Markets Strategist at Exness

sell aaplaapl hit upper trend resistance and is currently overbought, overpriced, its time for another major correction that could then even lead to a trendbreak due to increasing risks, it will be very exciting to monitor all further moves and especially price action at highlited trend lines.
other stocks like tsla recently signalled a turn as well as they printed double top patterns, bitcoin momentum is also slowing down, a whole market turn seems very likely.

Long trade 📘 Trade Journal Entry
Symbol: AAPL (Apple Inc.)
Direction: Buy-Side Trade
Date: Fri 10 Oct 25
Time: 11:00 am
Session: LND to NY Session AM
Timeframe: 1 Hour
🔹 Trade Details
Metric Value
Entry 248.43
Profit Level (TP) 278.00 (+11.88%)
Stop Level (SL) 243.56 (–1.98%)
Risk–Reward (RR) 6.0 R
🔸 Technical Context
Structure:
Price broke out from an extended accumulation zone with confirmation from a BOS (Break of Structure) and Demand Zone Retest on the 15-minute and 1-hour timeframes.
The move aligns with a strong fair value gap fill and retest of the order block around 244–245, which acted as a springboard for the next impulsive leg.
Fibonacci Expansion:
1.618 projection → 261.30 (short-term target)
2.618 projection → 267.60 (intermediate)
3.618 projection → 274.00 (high-probability swing)
4.236 projection → 277.92 (extended TP)
Volume Confirmation:
Volume spikes visible at the breakout candle reinforce institutional participation, marking a clear transition from consolidation to markup phase.
🔹 Narrative & Bias
Apple continues to exhibit buyside momentum after consolidating above the September accumulation range. The breaker block re-entry at 245 aligned with fib 0.618 retracement and strong volume demand, confirming bullish continuation.
Current structure mirrors prior accumulation-distribution cycles seen before major upside runs.
Macro Context:
Tech sector rotation in line with AI & earnings optimism.
Broader equity market stability encouraging risk-on positioning in mega-cap tech names.
Projection:
Price expected to extend toward 267–278 levels before the next major consolidation phase, with potential for partial take-profits near the 1.618 extension.

AAPL | Money will Rotate into this MEGA CAP | LONGApple, Inc. engages in the design, manufacture, and sale of smartphones, personal computers, tablets, wearables and accessories, and other varieties of related services. It operates through the following geographical segments: Americas, Europe, Greater China, Japan, and Rest of Asia Pacific. The Americas segment includes North and South America. The Europe segment consists of European countries, as well as India, the Middle East, and Africa. The Greater China segment comprises China, Hong Kong, and Taiwan. The Rest of Asia Pacific segment includes Australia and Asian countries. Its products and services include iPhone, Mac, iPad, AirPods, Apple TV, Apple Watch, Beats products, AppleCare, iCloud, digital content stores, streaming, and licensing services. The company was founded by Steven Paul Jobs, Ronald Gerald Wayne, and Stephen G. Wozniak in April 1976 and is headquartered in Cupertino, CA.
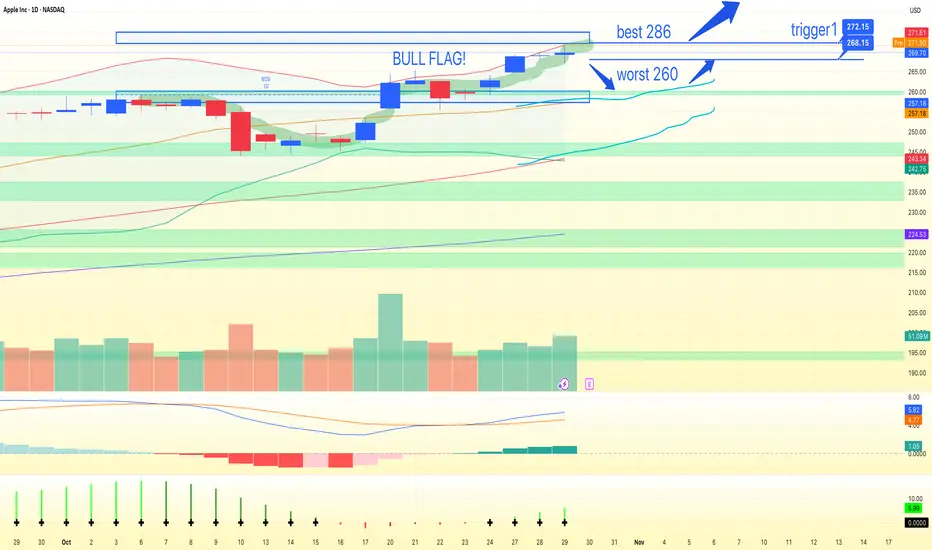
AAPL Bullish Breakout: Retest Buy Toward 282–286Apple (AAPL) is trending firmly higher on the 1D chart, with multiple break-of-structure pushes and price riding the upper Bollinger Band. The recent surge cleared resistance and printed a new high at 271.60, while the 20/60/120 MAs remain positively stacked and rising. Short-term momentum favors continuation, but a brief pause wouldn’t surprise given the extension.
My primary path is a buy-the-retest setup: a dip into the former ceiling turned demand at 260.00–264.00 holds, followed by a constructive bounce. If that plays out, I’m looking for a grind toward 278–280 first, then an extension into 282–286 as higher highs resume. Alternatively, strength through resistance is a momentum trigger— a daily close above 271.60 (aggressive >272.00) would validate a break-and-hold and open the same targets.
Invalidation is clean: a decisive daily close below 260.00 breaks the structure and risks a deeper pullback. Until then, the bias stays bullish; consider partial sizing on initial entries and add on confirmation to respect expanding volatility. Stops can sit just below 260.00 (around 258.00) for retest entries, or tucked under the breakout level if trading the close-above trigger.
This is a study, not financial advice. Manage risk and invalidations
AAPL Weekly Outlook (Oct 28–31)AAPL Weekly Outlook (Oct 28–31): “Apple’s Momentum Reboot — Eyes on $275 Breakout Zone!” 📱
1. Weekly (1W) Structure – Macro Breakout Confirmation
Apple has officially shifted from recovery to expansion phase. The weekly chart shows a confirmed Change of Character (CHoCH) into Break of Structure (BOS) above $260, reclaiming a bullish trajectory. Price is pushing toward the upper channel trendline near $275–$280, showing clean continuation momentum with no immediate resistance until that level.
* Bias: Bullish continuation
* Support: $224 → $260
* Resistance: $275 → $280
* MACD: Strong bullish expansion; histogram widening upward.
* Stochastic RSI: Overbought but still trending — strength, not exhaustion yet.
💡 Weekly Thought:
Momentum is accelerating across the board, confirming institutional participation. Unless $260 breaks down, Apple remains a buy-on-dip candidate heading into November earnings.
2. Daily (1D) – Trend Acceleration
Daily structure is showing clean BOS sequences along an ascending parallel channel. After retesting the midline near $244–$250, Apple bounced strongly and reclaimed the $260 handle. This confirms buyers defending the demand base, now pushing price to challenge $268–$270 short-term resistance.
* Bias: Bullish continuation
* Support: $244 → $259
* Resistance: $270 → $275
* Indicators:
* MACD turning positive again after pullback reset.
* Stochastic RSI curled upward from midzone — signals renewed strength.
💭 Daily Suggestion:
Look for intraday retests around $262–$264 as a potential long entry. A clean daily close above $270 opens path to $275 and eventually $280 if macro remains supportive.
3. 1-Hour (1H) – Intraday Playbook
Intraday structure aligns perfectly with higher timeframes — multiple BOS and short consolidation ranges above $260 confirm sustained bullish control. Momentum is strong, but short-term traders should be cautious of profit-taking near $270–$272 zone before the next leg higher.
* Scalp Bias: Bullish above $262
* Support: $260 → $255
* Resistance: $270 → $275
* Setup Idea:
* Call scalp: Above $266 with target $272–$275.
* Put scalp: Only below $260 breakdown, targeting $255.
📈 1H Thought:
If AAPL consolidates tightly between $266–$269 early in the week, it may coil for a breakout toward $275 later this week.
4. GEX & Options Sentiment – Institutional Positioning
Gamma Exposure (GEX) data shows heavy call concentration aligning perfectly with price structure, reinforcing bullish continuation bias.
* Highest positive GEX / resistance: $269 → $275 → $280
* Support (put-dominated zones): $257 → $252
* Call ratio: 9.1% (moderate bullish exposure)
* IVR: 19.9 (low IV environment)
* IVx avg: 32.6 (slightly cooling)
Institutions are pinning price near $265–$270 with positive gamma bias. The $275–$280 zone acts as the next magnet if upward momentum persists.
5. Suggested Option Plays
* Bullish Setup (Preferred):
* Buy-to-open 270C–275C (1DTE/2DTE) if price reclaims $268 with strength.
* Target: $275–$280
* Stop: Below $260
* Reason: Gamma buildup supports continuation, clean technical breakout setup.
* Bearish Hedge (Cautious):
* Buy 255P (1DTE/2DTE) only if price breaks $260 with confirmed volume.
* Target: $252
* Stop: Above $266
Apple’s structure is aligned bullishly across all timeframes — a clear continuation from the mid-October breakout with strong call-side gamma buildup. The next move hinges on whether $270 flips to support; if so, the stock is primed for a potential $275–$280 test.
🎯 Primary Bias: Bullish toward $275–$280
⚠️ Watch For: Breakdown under $260 = short-term exhaustion signal.
This analysis is for educational purposes only and does not constitute financial advice. Always do your own research and manage your risk before trading.
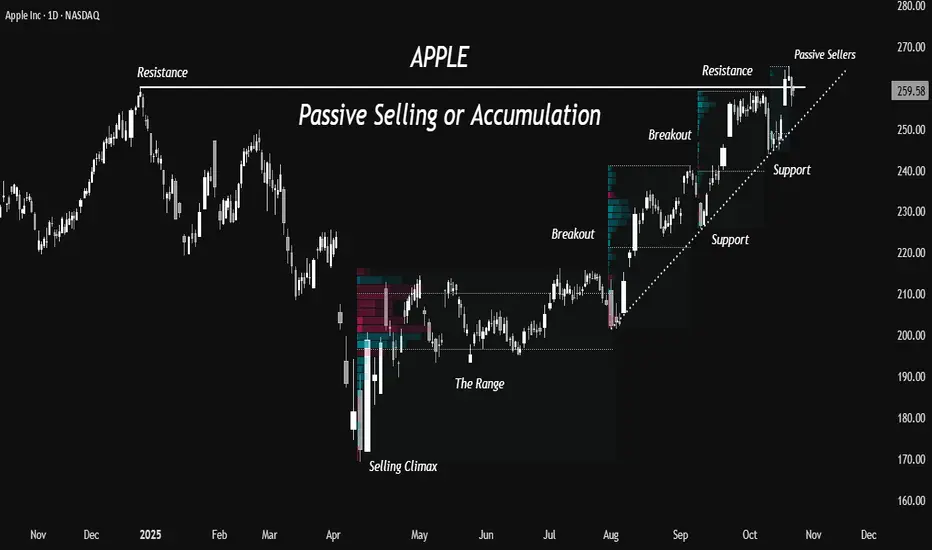
Apple- Passive Selling or More Accumulation?A Bottom and Accumulation
The stock formed a top near 260 in December 2024 and a bottom near 169 in April 2025.
After a sharp bounce of 25% from the lows in just 4 days, the stock consolidated for about 76 sessions in a range from 193 to 214- roughly a 10% range. This created a well-defined base structure, suggesting a period of accumulation.
Breakouts with Volume
The range broke out with strong volume expansion in the beginning of August, confirming a shift in market structure from accumulation to markup. Since then, the stock has maintained a steady uptrend, experiencing only brief pullbacks of about 5 to 6 percent- typical of a healthy trending phase.
Passive Selling at Highs
Currently the stock is trading near its previous highs of 260. It broke out of this resistance and then pulled back below this level. Passive selling is seen around 260 level which means sellers are stepping up, trying to absorb buyers. and the next few sessions will reveal whether this zone turns into a distribution area or simply a retest before continuation.
Trendline Buyers
Pullback buyers are watching the up trendline support which has held the previous shakeouts at two occasions (in Sep and Oct). As long as the stock sustains above this trendline, trend-following participants are likely to continue adding on dips, providing structural support to the uptrend.
Two Scenarios
A sustained move above 260, supported by strong volumes, would reaffirm bullish control and open the door for further upside momentum. Conversely, a break below the trendline could trigger long liquidation from those who bought above 260, leading to broader profit booking and a possible retracement toward 240 or even 225.
What do you think about the stock?
Will it fail the current breakout or sustain?
Do comment below 💬
#For educational purpose only, not a buy/sell recommendation.
APPLE: Price Action & Swing Analysis
The recent price action on the APPLE pair was keeping me on the fence, however, my bias is slowly but surely changing into the bearish one and I think we will see the price go down.
Disclosure: I am part of Trade Nation's Influencer program and receive a monthly fee for using their TradingView charts in my analysis.
❤️ Please, support our work with like & comment! ❤️

AAPL - Weekly chartSwing Trade Closed
#AAPL – Weekly Chart
Position closed last week.
Personal Swing Trading strategy. Custom indicator.
✅ Performance: +23%
✅ R:R: 2.76
Simple setup, clean execution.
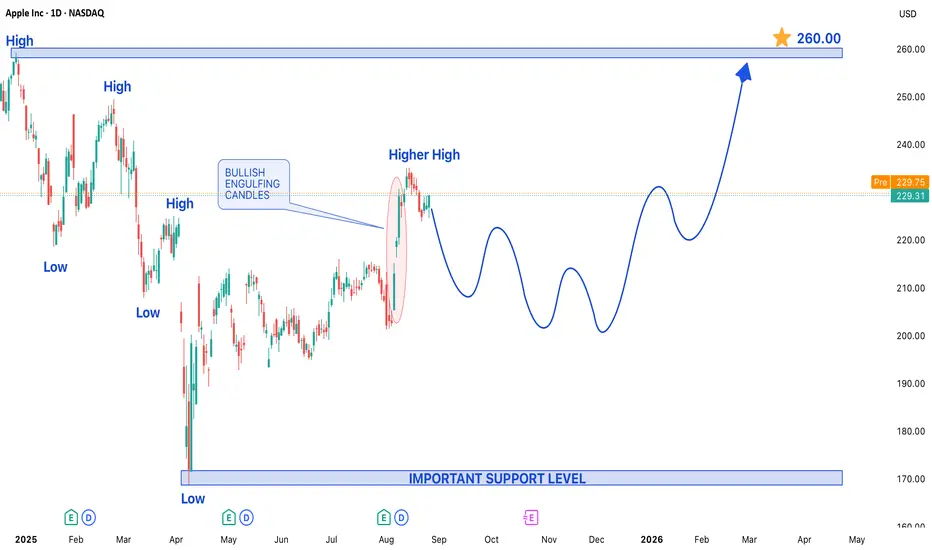
APPLE INC SHIFTED TO BULLISH TREND STRUCTURE IN DAILY CHARTTechnical Analysis: Apple Inc. (AAPL) Shifts to Bullish Daily Trend
A significant technical development is underway for Apple Inc. (AAPL), as its daily chart has conclusively shifted into a bullish trend structure. This critical change in market posture indicates that buyer momentum has successfully overwhelmed previous selling pressure, setting the stage for a potential sustained upward move. The emergence of this new trend is characterized by a clear pattern of price action that signals growing confidence among buyers.
The primary evidence for this bullish shift is the formation of a higher high. This occurs when the price surpasses a previous significant peak, breaking the sequence of lower highs that defines a bearish or corrective phase. This achievement demonstrates that buyers are not only active but are also willing to bid up the price to new interim levels, establishing a new upward trajectory. This price-based evidence is powerfully confirmed by a key candlestick pattern: the **Bullish Engulfing candle. This pattern materializes when a large bullish candle completely "engulfs" the real body of the preceding bearish candle. It represents a decisive victory for the bulls within a single trading session, marking a clear shift in sentiment from selling to aggressive buying and providing strong confirmation of the underlying strength.
Given the confluence of this new bullish trend structure, the higher high formation, and the potent Bullish Engulfing candlestick pattern, the expectation is for AAPL's price to remain bullish in the upcoming trading sessions. The path of least resistance appears to be firmly to the upside, with momentum favoring the buyers.
Key Levels to Watch:
Upside Target: Based on this technical structure, the price is projected to aim for a target level of $260.00 on the higher side. This objective will likely serve as a key profit-taking zone and a significant psychological resistance level that the market will test.
Downside Support: While the outlook is bullish, it is prudent to identify key risk management levels. On any pullback, the support level of $170.00 is expected to act as a crucial floor. This level should hold to keep the newly established bullish structure intact. A decisive break below this support could invalidate the current bullish thesis and signal a return to a neutral or bearish consolidation phase.
In summary, the technical evidence for AAPL has turned convincingly positive. Traders and investors may look for opportunities on the long side, targeting the $260.00 level, while using any moves toward $170.00 as a potential value area, always with appropriate risk management strategies in place.
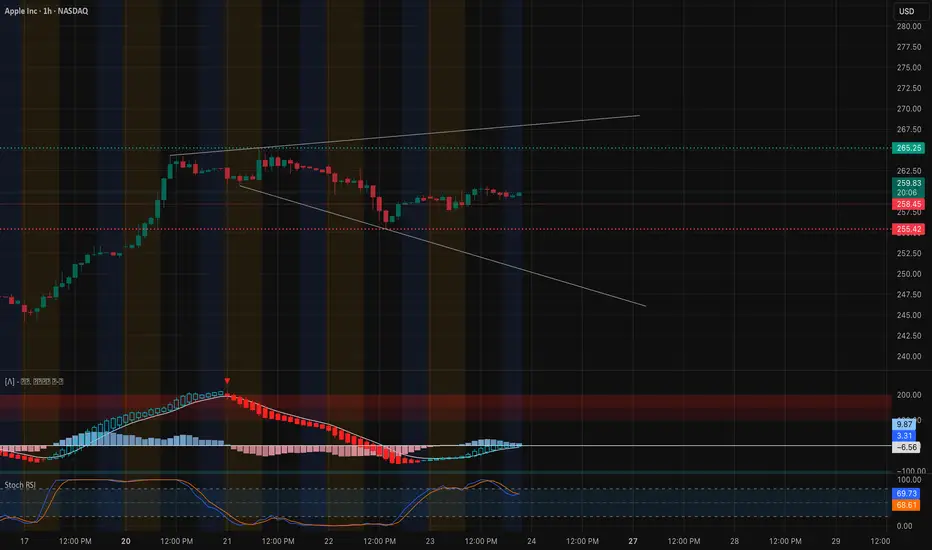
AAPL Testing Mid-Range Balance: (Oct. 24 Outlook)Can Bulls Reclaim $262 or Will It Slip Back to $252? 🍏
1. Market Structure (1H & 15M)
Apple’s recent price action shows a fragile equilibrium forming between supply and demand after a clean recovery from the $252 zone. On the 1-hour chart, we’ve got a CHoCH confirming short-term buyers stepping back in around $255, but price remains capped below a key mid-range resistance zone at $260–$262, where several prior breakdown candles originated.
The BOS from earlier in the week was followed by a retracement that created a local higher low structure, hinting at possible accumulation between $255–$258. However, the failure so far to push decisively through $262.50 shows hesitation — likely due to overhead liquidity and the GEX call wall there.
On the 15-minute chart,
Apple is consolidating inside a rising channel with small BOS/CHoCH rotations that reflect indecision. The latest CHoCH suggests short-term exhaustion, but as long as price respects $257–$258, bulls still have a chance to retake control into Friday.
2. Supply and Demand / Order Blocks
* Demand Zone (Support): $252.5–$255.5, aligning with a previous BOS level and high-volume accumulation area.
* Near-Term Demand: $257–$258 (15M fair value gap + local retest zone).
* Supply Zone (Resistance): $262–$265 — key order block cluster where sellers previously initiated the drop; breakout beyond this range could ignite a trend continuation toward $268+.
The chart shows clear liquidity resting above $262 and below $252 — suggesting that whichever side gets swept first will likely define Friday’s directional bias.
3. Indicator Confluence
* 9 EMA / 21 EMA: On the 15M, both EMAs are converging with a mild upward slope, indicating an early transition from consolidation to possible upside momentum. The 1H EMAs are flattening — a neutral but stabilizing signal.
* MACD: The 1-hour MACD is curling upward with histogram bars flipping positive, suggesting bulls are slowly regaining control. On the 15-minute, MACD shows mild bearish divergence but flattening momentum — setting up for a potential premarket expansion.
* RSI: 1-hour RSI is sitting near 68, close to bullish control but not yet overbought. 15M RSI oscillates between 52–60, ideal for a momentum reset phase.
* Volume: Volume picked up during the $252 bounce but has cooled — typical of compression before a possible breakout.
4. GEX (Gamma Exposure) & Options Sentiment
Friday’s GEX chart paints a tight battleground between the $252.5 HVL support and the $262–$265 gamma wall. The highest positive gamma lies right at $259–$260, meaning dealers may attempt to pin price near that zone through hedging.
Below that, the PUT support around $250 aligns perfectly with structural demand and previous BOS support — this is the line bulls must defend. Above, $265 represents the dominant call wall, making it the near-term ceiling unless a gamma squeeze takes hold.
The current IVR (20) and IVX avg (29.8) show low volatility, and call sentiment remains modest (7.1%), implying traders are cautious but not overly bearish. If momentum accelerates past $262, gamma positioning could flip and lead to a controlled squeeze toward $267–$270.
5. Trade Scenarios for Friday, Oct. 24
Bullish Setup 🟩
* Entry Zone: $258–$259 retest or breakout above $262.2
* Targets: $264 → $267 → $270
* Stop-Loss: Below $256.8
* Confirmation: Hold above 9 EMA on 15M + MACD histogram rising + RSI > 60
Bearish Setup 🟥
* Entry Zone: $261–$262.5 rejection or CHoCH under $257
* Targets: $255 → $252 → $248
* Stop-Loss: Above $263.5
* Confirmation: MACD crossdown + RSI divergence + BOS to downside
6. Closing Outlook for Oct. 24 (Friday)
Friday looks to be a compression breakout setup for Apple — momentum is tightening between $257 and $262. If bulls reclaim $262 with conviction, watch for a potential gamma-driven squeeze toward $267+. Conversely, a rejection there with fading volume could pull Apple back toward its $252–$255 accumulation base.
My personal view: AAPL remains neutral-to-bullish as long as $257 holds. Buyers have shown up at every dip this week, and Friday’s session might reveal whether that base was genuine accumulation or just short-term relief. Keep your eyes on $262 — that’s the key trigger level.
📊 Final Thought:
“AAPL is balancing between $257 and $262 — the calm before the breakout. If bulls crack $262, the gamma unwind could send it flying toward $270. If not, expect a cool-off back to the $255 zone.”
This analysis is for educational purposes only and not financial advice. Always do your own research and manage your risk before trading.
Apple: New All-Time High as Low Is Adjusted Apple has recently seen a period of heightened volatility, marked by sharp gains and notable pullbacks. In response to the latest price action, we’ve made a slight adjustment to our wave count and revised the low for magenta wave (4). We’re now allowing for magenta wave (5) to break above the $260.10 resistance level, which would complete green wave . Our alternative scenario, which carries a 34% probability, still calls for a new corrective low in blue wave alt.(IV). In this case, Apple would have just finished beige wave alt.b slightly above $260.10 and would next decline in wave alt.c, falling below support at $212.94. Even so, the alternative corrective low would remain above the $168 level.

Apple: New All-Time High!Apple has recently seen a period of heightened volatility, marked by sharp gains and notable pullbacks. We’re allowing for magenta wave (5) to break above the $260.10 resistance level, which would complete green wave . However, our alternative scenario, which carries a 34% probability, calls for a new corrective low in blue wave alt.(IV) . In this case, Apple would have just finished beige wave alt.b slightly above $260.10 and would next decline in wave alt.c , falling below support at $212.94. Even so, the alternative corrective low would remain above the $168 level.

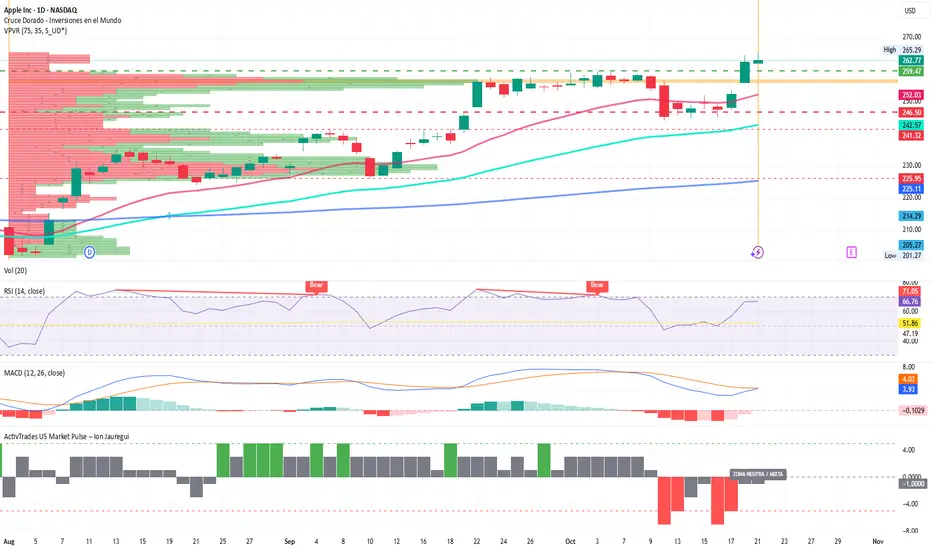
Apple Smashes Expectations with iPhone 17Apple Smashes Expectations with iPhone 17: Sales Up 14% in Just 10 Days
By Ion Jauregui – Analyst at ActivTrades
Apple (NASDAQ: AAPL) has made another bold move with the launch of its iPhone 17. According to Counterpoint, the latest model sold 14% more than the iPhone 16 in its first 10 days in key markets such as China and the United States. Growth is even more remarkable in China, where the base model almost doubled its sales compared to the iPhone 16. Overall, sales across both markets surged 31%, consolidating Apple as the undisputed leader in the sector.
The secret behind this success seems simple but effective: a better chip, enhanced display, upgraded front camera, and larger storage capacity, all while maintaining the same price as last year. Apple’s “more for the same” strategy has, at least so far, proven highly profitable.
AAPL Technical Analysis
From a technical perspective, Apple shares show a solid bullish momentum following the iPhone 17 announcement:
The price has broken key resistance at $259.47, consolidating above the 50-day moving average for two consecutive sessions.
Relative Strength Index (RSI) indicators are in slightly overbought territory but show no immediate correction signals.
MACD indicates the early stages of a bullish crossover.
Trading volume has increased significantly in recent days, confirming strong institutional interest.
In this context, current support is around $246.50, with the next support above $241.28 near the 100-day moving average, while the previous key support is at $225.95, coinciding with the 200-day moving average. The ActivTrades US Market Pulse indicates a neutral risk balance, suggesting that these moves are largely driven by speculation around Apple.
For Apple, these figures represent more than just a commercial victory. The company needed a sales boost to justify its position in an increasingly competitive market, and early indicators show it is succeeding.
The iPhone 17 not only strengthens investor confidence in Apple but also sets a new benchmark for the tech industry at a time when innovation and demand for premium devices are higher than ever.
*******************************************************************************************
La información facilitada no constituye un análisis de inversiones. El material no se ha elaborado de conformidad con los requisitos legales destinados a promover la independencia de los informes de inversiones y, como tal, debe considerarse una comunicación comercial.
Toda la información ha sido preparada por ActivTrades ("AT"). La información no contiene un registro de los precios de AT, o una oferta o solicitud de una transacción en cualquier instrumento financiero. Ninguna representación o garantía se da en cuanto a la exactitud o integridad de esta información.
Cualquier material proporcionado no tiene en cuenta el objetivo específico de inversión y la situación financiera de cualquier persona que pueda recibirlo. La rentabilidad pasada y las estimaciones o pronósticos no son sinónimo ni un indicador fiable de la rentabilidad futura. AT presta un servicio exclusivamente de ejecución. En consecuencia, toda persona que actúe sobre la base de la información facilitada lo hace por su cuenta y riesgo. Los tipos de interés pueden cambiar. El riesgo político es impredecible. Las acciones de los bancos centrales pueden variar. Las herramientas de las plataformas no garantizan el éxito.
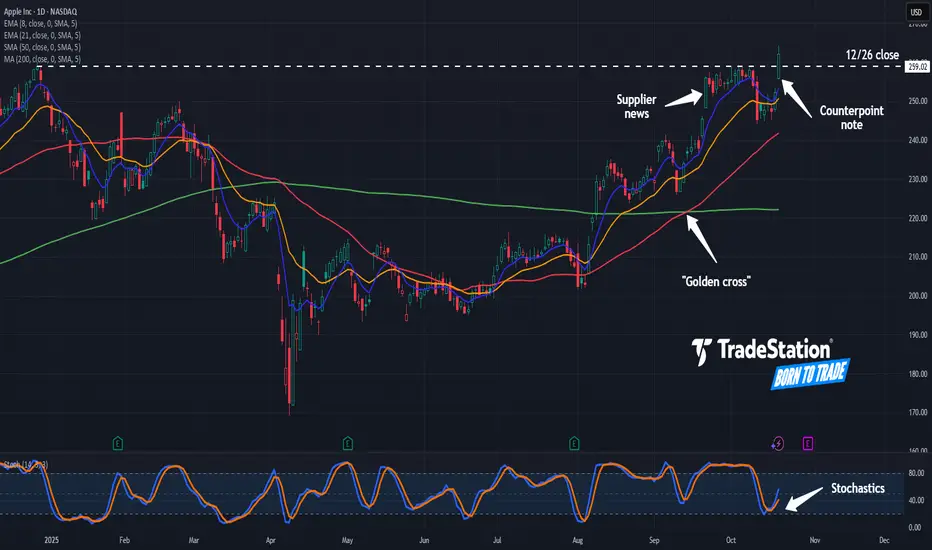
Potential Breakout in Apple Apple has been trapped as the broader Nasdaq rallies, but that might have changed yesterday.
The first pattern on today’s chart is the December 26 closing price of $259.02. AAPL paused near that level in early October but closed above it yesterday. That may be viewed as a potentially bullish breakout.
Second, the tech giant surged on September 22 after The Information reported suppliers were told to increase component production. That was the first clue of strong demand for the iPhone 17. Another report from Counterpoint Research on Monday noted strong early sales of the new handset.
Third, the 50-day simple moving average (SMA) had a bullish “golden cross” above the 200-day SMA last month. That may suggest its longer-term trend is getting more bullish.
Fourth, the 8-day exponential moving average (EMA) is above the 21-day EMA. That may reflect a bullish short-term trend.
Next, stochastics recently turned up from an oversold condition.
Finally, AAPL is a highly active underlier in the options market. (Its average daily volume of 790,000 contracts ranks fifth in the S&P 500, according to TradeStation data.) That could help traders take positions with calls and puts.
TradeStation has, for decades, advanced the trading industry, providing access to stocks, options and futures. If you're born to trade, we could be for you. See our Overview for more.
Past performance, whether actual or indicated by historical tests of strategies, is no guarantee of future performance or success. There is a possibility that you may sustain a loss equal to or greater than your entire investment regardless of which asset class you trade (equities, options or futures); therefore, you should not invest or risk money that you cannot afford to lose. Online trading is not suitable for all investors. View the document titled Characteristics and Risks of Standardized Options at www.TradeStation.com . Before trading any asset class, customers must read the relevant risk disclosure statements on www.TradeStation.com . System access and trade placement and execution may be delayed or fail due to market volatility and volume, quote delays, system and software errors, Internet traffic, outages and other factors.
Securities and futures trading is offered to self-directed customers by TradeStation Securities, Inc., a broker-dealer registered with the Securities and Exchange Commission and a futures commission merchant licensed with the Commodity Futures Trading Commission). TradeStation Securities is a member of the Financial Industry Regulatory Authority, the National Futures Association, and a number of exchanges.
Options trading is not suitable for all investors. Your TradeStation Securities’ account application to trade options will be considered and approved or disapproved based on all relevant factors, including your trading experience. See www.TradeStation.com . Visit www.TradeStation.com for full details on the costs and fees associated with options.
Margin trading involves risks, and it is important that you fully understand those risks before trading on margin. The Margin Disclosure Statement outlines many of those risks, including that you can lose more funds than you deposit in your margin account; your brokerage firm can force the sale of securities in your account; your brokerage firm can sell your securities without contacting you; and you are not entitled to an extension of time on a margin call. Review the Margin Disclosure Statement at www.TradeStation.com .
TradeStation Securities, Inc. and TradeStation Technologies, Inc. are each wholly owned subsidiaries of TradeStation Group, Inc., both operating, and providing products and services, under the TradeStation brand and trademark. When applying for, or purchasing, accounts, subscriptions, products and services, it is important that you know which company you will be dealing with. Visit www.TradeStation.com for further important information explaining what this means.
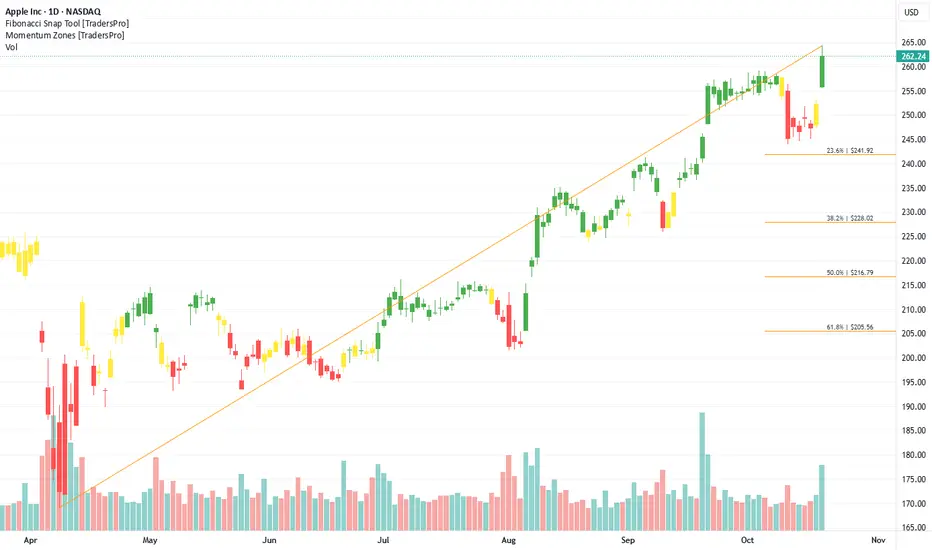
Apple Inc. (AAPL) Expands With AI-Powered DevicesApple Inc. (AAPL) is a global technology leader known for its iconic products — iPhone, Mac, iPad, and Apple Watch — as well as its fast-growing services segment, including Apple Music, iCloud, and Apple TV+. The company’s ecosystem continues to drive customer loyalty and recurring revenue. Apple’s growth is fueled by innovation in hardware and AI, expansion in digital services, and strong brand power that keeps it at the center of global consumer technology.
On the chart, a confirmation bar with rising volume highlights bullish momentum. The price has entered the momentum zone after climbing above the .236 Fibonacci level. A trailing stop can be placed just below this Fibonacci line using the Fibonacci snap tool, helping traders protect profits while leaving room for continued upside potential.
APPLE/AAPL Stock: Movement Scenarios and Key Reaction PointsThese are all the key stock levels for Apple that are fully and precisely displayed in the image – including supports, resistances, and potential reaction points for traders NASDAQ:AAPL

Apple (AAPL) Shares Hit an All-Time HighApple (AAPL) Shares Hit an All-Time High
On 26 September, we noted that Apple (AAPL) shares were nearing a record peak. Less than a month later, that forecast has materialised: according to the chart, AAPL surged more than 4% yesterday, surpassing its December 2024 high. This marks:
→ a new all-time record;
→ a return to second place by market capitalisation (Apple has overtaken Microsoft, while Nvidia remains in first position).
Why Are Apple Shares Rising?
→ Strong sales figures. Counterpoint Research reported that sales of the new iPhone 17 series in the US and China during the first ten days were 14% higher than those of the iPhone 16 last year. Analysts note that the base model offers significant improvements at the same price, encouraging consumers to upgrade.
→ Analyst forecasts. Loop Capital not only raised its rating to Buy (with a target price of $315) but also declared the start of a “long-awaited upgrade cycle”. In their view, this is not a short-term surge but the beginning of sustained growth in shipments expected to continue until 2027.
Optimism is also fuelled by anticipation of Apple’s upcoming earnings report and the festive shopping season, which could further accelerate iPhone 17 sales.
Technical Analysis of Apple (AAPL) Shares
Price movements in 2025 have formed a broad upward channel (shown in blue). Within this structure:
→ the channel’s median line acted as support in mid-October;
→ yesterday’s rally lifted the price into the upper quarter of the channel.
From a demand perspective:
→ Trading opened with a bullish gap (see arrow), and the price jumped rapidly in the first minutes — evidence of strong buying interest.
→ The psychological level of $250 is losing its role as resistance and may become future support.
→ The price remains within a steep rising channel (marked in orange).
From a supply perspective:
→ The RSI indicator shows overbought conditions;
→ Some investors may take profits at the new record high.
Taking these factors into account, once the current bullish momentum cools, AAPL could see a short-term pullback — potentially towards the area of the bullish gap or one of the orange trendlines (solid or dotted).
This article represents the opinion of the Companies operating under the FXOpen brand only. It is not to be construed as an offer, solicitation, or recommendation with respect to products and services provided by the Companies operating under the FXOpen brand, nor is it to be considered financial advice.
