Mean Reversion Setup: BRK.A1. RSI in oversold region
2. Price likely to rebound back to the mean
Trade Rules:
Entry Trigger - RSI has cross below oversold region, enter limit buy at close price
Exit Trigger - Close at market when close price cross above exit trigger (Red Line)
Notes: Maximum of 3 open positions
Berkshire Hathaway Inc. Class B
No trades
What traders are saying

BRK-B | Insurance Does Great with Higher Interest Rates | LONGBerkshire Hathaway, Inc. is a holding company, which engages in the provision of property and casualty insurance and reinsurance, utilities and energy, freight rail transportation, finance, manufacturing, and retailing services. It operates through the following segments: Insurance, Burlington Northern Santa Fe, LLC (BNSF), Berkshire Hathaway Energy (BHE), Pilot Travel Centers (PTC), Manufacturing, McLane, and Service and Retailing. The Insurance segment includes the underwriting of GEICO, Berkshire Hathaway Primary Group, and Berkshire Hathaway Reinsurance Group. The BNSF segment involves the operation of railroad systems. The BHE segment focuses on regulated electric and gas utility, power generation and distribution, and real estate brokerage activities. The PTC segment consists of managing travel centers and marketing of wholesale fuel. The Manufacturing segment refers to industrial, consumer and building products, home building, and related financial services. The McLane segment covers the wholesale distribution of groceries and non-food items. The Service and Retailing segment relates to the provision of shared aircraft ownership programs, aviation pilot training, electronic components distribution, retailing businesses, automobile dealerships and trailer, and furniture leasing services. The company was founded by Oliver Chace in 1839 and is headquartered in Omaha, NE.

BRK.B | Short Setup | Range Breakdown to HVN Support | Jan 30, 2🔹 Thesis Summary
Berkshire just lost momentum beneath a dense supply shelf (~$491–$497) and slipped below short-term MAs. With a visible high-volume node lower (~$431), the risk/reward favors a controlled short into support while fundamentals remain solid but not cheap.
🔹 Narrative & Context
Structure: Multi-month range with repeated failures near $495–$500; latest break beneath clustered MAs increases the probability of a drift toward the next liquidity pocket around $431 (visible profile).
Earnings context (from Q2 FY25 Sankey): ~$92.5B revenue, ~$13.4B operating profit (14% margin), and ~$12.5B net profit; insurance strength offsets softer BNSF/BHE cyclicality.
Ownership flows: Recent underperformance vs. S&P and shifting fund holders raise the chance of supply on rallies.
🔹 Valuation & Context (Pro Metrics, Framed Simply)
Forward P/E ≈ 18.2x → near a premium to many Financials peers → investors paying up for quality & cash pile → supports dips but limits multiple expansion near resistance.
P/B ≈ 1.6x → modest premium to BRK’s long-term mid-cycle → implies expectations for steady compounding.
ROE ~ 10–12% (5-yr avg ≈ 11.9%) → solid quality from underwriting & float → validates buying back closer to book-anchored nodes.
EPS Growth (last 12m, YoY) ≈ +17% → operating momentum still positive → suggests covering into $431–$451 rather than pressing.
Debt/Equity ≈ 0.18–0.21 → conservative balance sheet → reduces left-tail risk; makes deeper discounts harder to sustain.
Plain English: Quality is intact and the balance sheet is conservative, but at ~18x forward earnings and ~1.6x book, upside requires a new narrative—until then, the chart’s supply governs.
🔹 Contrarian Angle (Your Edge)
Consensus treats BRK as a defensive compounder; the desk’s edge is trading the range rather than marrying it. Into $488–$495, supply + valuation premium create asymmetric short entries. Re-assess for long bias only if weekly closes reclaim $505+ with volume.
🔹 Risks
Sharp investment gains or insurance outperformance can squeeze shorts.
Macro risk-on rally compressing risk premia could lift multiples.
Headline shifts in capital allocation (e.g., large buybacks/deals) invalidate the range.
🔹 Macro Considerations
Equities’ multiple sensitivity to real yields; a drop in yields can buoy BRK’s book-value premium.
Insurance cycle: benign catastrophe season weakens the short; severe CATs strengthen it.
Flows/positioning: large-holder changes (e.g., mutual fund rotations) can add supply on bounces.
🔹 Bottom Line
High-quality, conservatively financed, but not cheap at resistance. The short into $488–$495 targeting the $451–$431 HVN is a disciplined, structure-driven trade with clear invalidation.
🔹 Forward Path
If this post gets traction, I’ll follow up with the weekly map (levels, volume clusters, and invalidation updates) and adjust targets post-earnings or on a $505+ reclaim.
Like & Follow for structured ideas, not signals. I post high-conviction setups here before broader narratives play out.
⚠️ Disclaimer: This is not financial advice. Always do your own research. Charts and visuals may include AI enhancements.
🔹 Footnote
Forward P/E: Price divided by expected earnings over the next 12 months. Lower = cheaper relative to profits.
P/FCF (Price-to-Free-Cash-Flow): Price vs. the cash left after investments. A measure of efficiency.
FCF Yield: Free cash flow per share ÷ price per share. Higher = more cash returned for each dollar invested.
ROE (Return on Equity): Net income ÷ shareholder equity. Shows management efficiency with investor capital.
ROIC (Return on Invested Capital): Net income ÷ all invested capital (equity + debt). A purer profitability gauge.
Debt/Equity: Debt divided by equity. <1 usually means balance sheet is conservative.
R:R (Risk-to-Reward): Ratio of expected upside vs. downside. 3:1 = you risk $1 to make $3.

Could Berkshire be breaking this uptrend?This uptrend on the monthly chart has been intact since 2022 and BRK.B may have just closed the month under the trendline. It will be interesting to see if they move back above it or continue down now that Buffett is gone.

BRK.B: Healthy Correction in Wave 5 – Target 528 2026-Q1Berkshire Hathaway (BRK.B) is currently in a healthy correction within Wave 5 of the larger bullish impulse, following the 516 double-top resistance. The pullback respects the no-overlap rule and forms a contracting triangle in Wave 4, which does not invalidate the overall advance.
Primary Count remains intact:
we are in subwave 3 of Wave 5, with a short-term support zone at 480-496 and resistance at 528-542. If the price breaks above 542, the next target is 580-600 in Q1 2026 (60% probability).
Alternative Count (40%):
A break below 455 on high volume (>5M shares) would shift to a larger Wave (4) Flat, with C-wave targeting 430-440.
Cash reserves (~$190B) and low P/B provide strong support. Watch for a breakout above 510-516 as the key signal for resumption of the uptrend.
Disclaimer: This analysis is for educational purposes only and is not investment advice. Please do your own research (DYOR) before making any trading decisions.

BUY @ 434 - Target 584Berkshire Hathaway has the potential to hit the levels of 584.
The Stock is expected to hit the levels of 434 before the next move.
Various Levels of entry are:
Zone 01:434
Zone 02:414
Zone 03:387

BRK.BBerkshire Hathaway (BRK.B) remains in an uptrend. If the price can hold above $486, there is a possibility of further price increases.
🔥Trading futures, forex, CFDs and stocks carries a risk of loss.
Please consider carefully whether such trading is suitable for you.
>>GooD Luck 😊
❤️ Like and subscribe to never miss a new idea!
Professional Fibonacci Trading GuideMost professional traders use Fibonacci for one reason
It defines where risk and opportunity are asymmetric
Fibonacci levels highlight where pullbacks tend to pause before trend continuation
Not because of magic
Because order flow and trader behavior cluster there
The Only Levels That Matter
✓ 0.50 psychological balance
✓ 0.618 highest probability continuation zone
✓ 0.786 trend validation level
These zones are where professionals wait
Not chase
How It’s Used
✓ Identify a clean impulse move
✓ Draw from swing low to swing high
✓ Wait for price to retrace into 0.50 to 0.618
✓ Enter only after price shows acceptance
✓ Stops sit below 0.786
✓ First target is prior high
✓ Extensions project continuation targets
Why Daily Timeframe
✓ Filters noise
✓ Aligns with institutional flow
✓ Cleaner structure
✓ Better risk to reward
✓ Less overtrading
Lower timeframes distort Fibonacci
Daily charts reveal intent
Key Rule
Fibonacci is not an entry signal
Price reaction is
Wait for price to reach the level
Then wait for confirmation
That patience is the edge
RB Trading
Education only
Risk management required

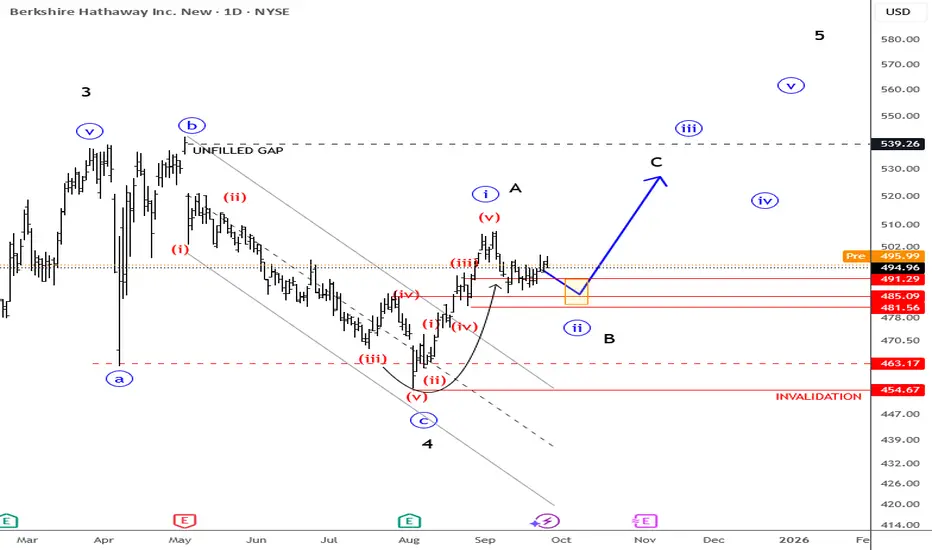
BRK.B- Double Top Pullback – Healthy Correction or Trend Shift?BRK.B Elliott Wave Breakdown: Double Top Pullback – Healthy Correction or Trend Shift?
BRK.B just hit a double top at 516, pulling back to 491 amid Fed jitters. Is this the end of Wave 5's rally, or just a healthy breather?
Let's dive into the chart for Dec 2025 insights:
Primary Count Overview: We're in Wave 5 (iii) of a bullish impulse – from 473 low, it rallied to 516, now retracing channel lower rail ~485. No overlap rule violation here: Wave 4's contracting triangle (ending at 455) allows minor intrusion into Wave 1 territory (491 high), keeping the 5-wave advance intact.
- Double Top Impact: This M-pattern signals short-term bearish reversal, targeting 480-496 support on neckline break. Volume's spiking on downside, RSI at 39 screams oversold – expect a 5-7% dip, but it's not derailing the bull trend in Elliott structure.
- Key Levels to Watch:
-- Support: 480-490 (green zone, SMA120 hold);
-- Resistance: 528 (year-end target, +7% upside).
Alternative Count : Break 455 + 5M volume (larger Wave 4 zigzag to 430-440, 25% odds from Fed 12/18).
Outlook & Strategy: 65% chance of bounce to 510-528 by EOY, fueled by $190B cash hoard and P/B 1.52 value. Long-term: Break 542 unlocks 580-600 Q1 2026. Tip: Buy dips at 478, stop below 455; scale out at 528 for profits.
Call to Action: What’s your BRK.B play? Drop comments below – like, subscribe for weekly updates! #StockAnalysis
Disclaimer: This analysis is for educational purposes only and is not investment advice. Please do your own research (DYOR) before making any trading decisions.

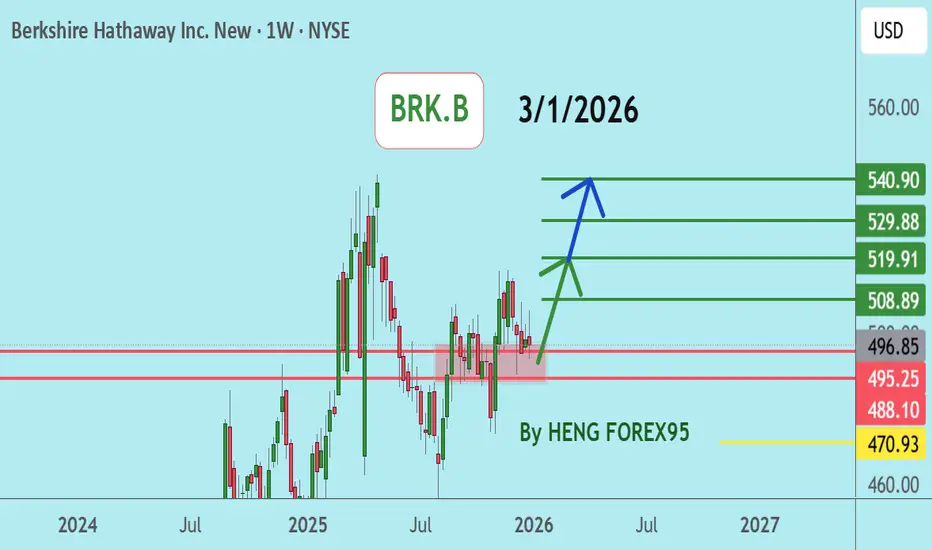
Berkshire Hathaway ~ Holiday Accumulation Zone $505-507 SupportBRK.B Pre-Christmas Accumulation Setup
Berkshire Hathaway has pulled back into a well-defined support zone at $505-507, presenting a structured entry opportunity heading into the holiday period with targets at the May 2025 highs.
🎯 Setup Overview:
Entry Zone: $505-507 (current support area)
Target: May 2025 highs (~$585-590 range)
Potential Move: ~16% upside from mid-range entry
📊 Technical Context:
Support Confluence:
The $505-507 area represents a previous consolidation zone from earlier in 2024
This level has acted as both support and resistance multiple times throughout the year
Price is testing this zone during typical year-end portfolio re-balancing
Historical Pattern:
Berkshire often consolidates during Q4 as institutional money re-positions for year-end, creating accumulation opportunities before Q1 strength.
Volume Behavior:
Recent selling volume shows signs of exhaustion rather than acceleration, suggesting distribution may be nearing completion.
🎯 Trade Structure:
Accumulation Zone: $505-507
Invalidation: Break and close below $495 (prior support)
First Target: $540 (previous resistance)
Primary Target: $585-590 (May 2025 highs)
Risk Management:
Stop placement below $495 provides clear invalidation
Risk from $506 entry: ~$11 per share
Reward to primary target: ~$80-85 per share
Approximate ratio: 7:1 to 8:1
📈 Why This Level Matters:
Institutional Footprint:
Berkshire's shareholder base is heavily institutional. Year-end window dressing and tax-loss harvesting create temporary pressure that often resolves in Q1.
Fundamental Support:
BRK.B operates as a diversified holding company with minimal single-stock risk
Strong balance sheet and cash reserves provide downside cushion
Historical tendency to outperform during market uncertainty
Seasonal Pattern:
December-January often sees renewed interest in quality names after tax-related selling concludes.
🛡️ Risk Considerations:
Market Environment:
Broader market volatility into year-end could push price below $505 temporarily. Position sizing should account for potential whipsaw.
Timeframe:
This is a swing to position trade (weeks to months), not a day trade. Patience required for target achievement.
Invalidation Discipline:
If price closes decisively below $495, the support thesis breaks and the position should be exited regardless of unrealized loss.
📌 Position Management Approach:
Scaling In:
First entry at $507 (initial test of support)
Second entry at $505 (if support holds on retest)
Reserve capital for $502 if extended weakness occurs
Scaling Out:
Reduce 1/3 at $540 (previous resistance, books profit)
Reduce 1/3 at $560 (midpoint to target)
Final 1/3 at $585-590 (May highs, complete exit)
This approach locks in gains progressively while maintaining upside exposure.
🎄 Holiday Trading Consideration:
Volume typically thins during the final weeks of December. Price action may be erratic with wider spreads. This setup assumes position building now with targets achieved in Q1 2025, not during the holiday period itself.
⚠️ Disclaimers:
This analysis is for educational purposes and represents a technical view based on historical price structure and support zones. It is not financial advice or a recommendation to buy or sell BRK.B.
Support levels can break. The $495 invalidation point exists precisely because no support is guaranteed. Proper risk management requires accepting potential loss if structure fails.
Targets are based on prior price action and do not guarantee future performance. Market conditions, broader economic factors, and company-specific events can alter outcomes significantly.
Always size positions according to your risk tolerance and conduct independent analysis before making investment decisions. All investing involves risk of loss.
✨ Your Thoughts?
If you're watching BRK for similar setups or have questions about this support zone, drop a comment below. Educational discussions help everyone improve their analysis.
📜 Trade with structure. Manage your risk. Stay disciplined.
Berkshire Hathaway Finds Support at Key Ascending TrendlineWarren Buffett’s Berkshire Hathaway has made a notable shift in its investment portfolio by initiating a $4.9 billion position in Alphabet during Q3. The firm bought 17.9 million shares, giving Berkshire a 0.31% stake in the tech giant. This move stands out because Berkshire has historically avoided high-growth tech names outside of Apple, signaling a strong vote of confidence in Alphabet’s long-term fundamentals.
Alphabet remains one of the most financially resilient companies in the world. Its core advertising engine is stabilizing, driven by stronger YouTube demand, improving brand ad spend and rising retail ad budgets. Google Cloud continues to expand margins, turning into a major profit contributor after years of investment. Meanwhile, Alphabet’s AI positioning, through Gemini, Google DeepMind and AI-integrated search, keeps the company at the center of the next major tech cycle. With over $100B in cash and minimal debt relative to its size, the balance sheet remains a fortress, aligning with Buffett's preference for durable, cash-rich businesses.
Berkshire’s decision to simultaneously reduce positions in Apple and Bank of America suggests a strategic rebalance toward high-quality growth, especially sectors benefiting from AI and cloud expansion. Alphabet fits this thesis perfectly.
Technical Outlook — BRK.B
The BRK.B chart shows an exceptionally strong long-term uptrend supported by a clean ascending trendline stretching back to 2022. Each pullback to this trendline has produced a new high, showing persistent institutional accumulation. Price recently bounced strongly off the trendline again and is now pushing toward the $542 resistance zone, a key level last tested during previous peaks.
Momentum remains constructive with rising volume confirming renewed demand. As long as BRK.B holds above the trendline, the bullish structure stays intact with upside targets at $542 recent high and potentially $570.

Buffett to Shareholders: “I’m Going Quiet”Buffett to Shareholders: “I’m Going Quiet”
Legendary investor Warren Buffett, the 95-year-old head of Berkshire Hathaway, has marked the end of an era by publishing what he called his “final letter” to shareholders on 10 November. The “Oracle of Omaha” announced that he is “going quiet”, bringing to a close his famous annual essays that have guided generations of investors for nearly six decades.
In this letter, Buffett:
→ noted that he will continue to communicate with shareholders through an “annual Thanksgiving message”;
→ announced a new $1.3 billion donation to four family foundations;
→ paid tribute to the late Charlie Munger and reflected on the “incredible luck” that has shaped his life.
Buffett also confirmed that his successor, Greg Abel, will formally assume the role of CEO by the end of 2025, expressing full confidence in the man who will oversee the legacy of one of the world’s greatest investors.
Technical Analysis of Berkshire Hathaway (BRK.B)
The technical outlook for Berkshire Hathaway’s Class B shares (BRK.B) in 2025 appears mixed. In spring, the stock faced two downward catalysts:
→ April: announcement of new tariffs by Donald Trump;
→ May: a quarterly earnings report that fell short of expectations.
Since then, BRK.B has formed a descending channel, within which:
→ a key low (point A) was established;
→ a strong August report sparked a confident rebound towards the channel’s upper boundary (point B);
→ that upper boundary has since acted as persistent resistance.
Given these developments, it is reasonable to assume that:
→ the move from B → C could represent a correction following the earlier A → B impulse;
→ the $488 level, which shows signs of support, may enable the bulls to break through resistance and resume the longer-term uptrend.
This analysis of BRK.B can be summed up with Buffett’s final piece of advice — one that transcends markets: “Kindness costs nothing, but it is priceless.”
This article represents the opinion of the Companies operating under the FXOpen brand only. It is not to be construed as an offer, solicitation, or recommendation with respect to products and services provided by the Companies operating under the FXOpen brand, nor is it to be considered financial advice.

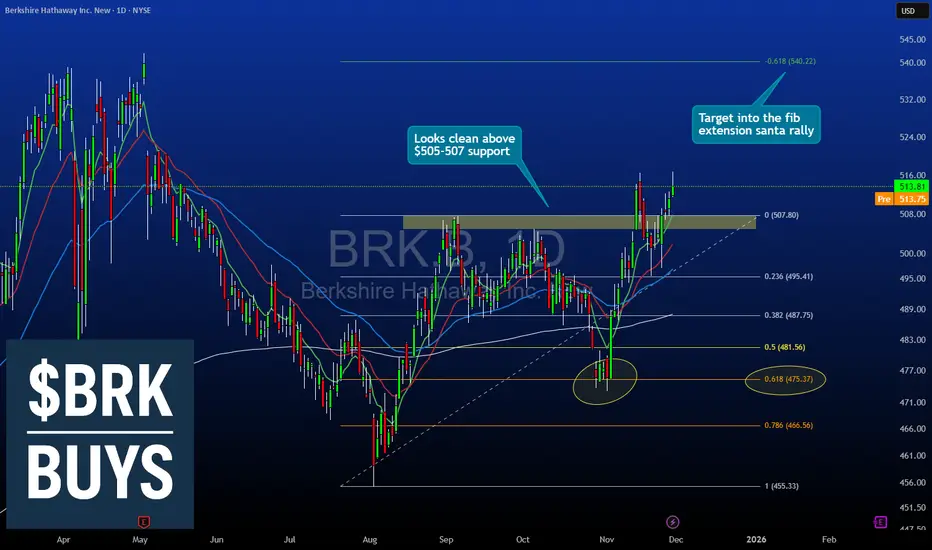
Berkshire Hathaway is breaking out of channelBerkshire Hathaway NYSE:BRK.B is breaking out of its long descending channel on the daily timeframe.
After months of consolidation, price has finally pushed through the upper boundary near $495, signaling the start of potential upward momentum.
If this breakout holds, the next major target could be around the mid-range near $520 — setting up what could become a powerful trend reversal for one of the market’s strongest giants.

Strategically Investing in Berkshire HathawayI'm going to write about what makes Berkshire a good company, and why I am buying it. Since it is such a huge company I might not be able to define every single detail but I will do my best to cover the most important aspects of the company for you. I hope you enjoy my idea, I am using my time to write this for your benefit and entertainment. If your deciding whether or not you want to buy Berkshire shares maybe this idea can help you to be more informed without having to do a ton of research.
One of the most appealing things to me right now about the shares, is that they are significantly undervalued. The best way to determine the intrinsic value for this company would be to use the discounted cash flow calculation. Projecting 5 years into the future, based on how much money the company will be expected to generate over this period of time, it is reasonable to assume the intrinsic value of the shares to be approximately $560. I think it could take some time to get there so I'm estimating about one or two years from now Berkshire will be worth $560 or more.
Looking at how the company actually uses its capital is important. When the market is at all time highs, investors typically rebalance their portfolios into undervalued, less risky, more stable companies. Berkshire fits the narrative here, and I'm going to explain why.
-Berkshire reallocates capital to its diverse portfolio of businesses, including railroad, energy, manufacturing, and service and retail companies. This can involve funding growth and "bolt-on" acquisitions for subsidiary companies.
-A significant portion of capital is used to purchase equity securities, such as stocks in companies like Apple, American Express, and Coca-Cola, either for a full stake or a "part interest".
-The company holds a large amount of cash and short-term investments to be prepared for market opportunities, which can include waiting for the right time to make large acquisitions or investments.
-Berkshire's core insurance operations generate "float"—money taken in as premiums before claims are paid—which is then invested in other businesses and securities.
-Berkshire uses debt very sparingly and prioritizes equity and its insurance float as its primary sources of capital.
-While individual businesses manage their daily operations, top management, led by Warren Buffett, makes the major capital allocation decisions to ensure capital is deployed where it can generate the highest returns. However as many of you know, Warren Buffett will step down as CEO and leave Greg Abel in charge, I don't think this will change much in the core operations of the business.
All of these factors contribute to this being a low risk, undervalued investment opportunity despite unfavorable market conditions with the US500 being at all time highs. I have rotated some capital in Berkshire class B shares as a way to reduce my risk but also stay exposed to the market. Berkshire is a great defensive stock that can be added to a diversified portfolio to grow and protect it.
BRK.A (Berkshire Hathaway) Breakout Alert: Bullish Setup Ready 🚀 BRK.A (Berkshire Hathaway) Breakout Alert: Bullish Setup Ready to Soar! 🚀
Traders, get ready for action! 🔥 The NYSE:BRK.A (Berkshire Hathaway Inc) chart is screaming opportunity on the 1-hour timeframe, with price coiling up against a descending trendline, poised for a powerful breakout. This setup is loaded with potential, and we’re watching closely for the U.S. market to open on Monday to confirm the move! 📈
📊 Setup Highlights:
Timeframe: 1-hour – perfect for catching this breakout wave.
Key Trigger: Price is on the verge of smashing through the descending trendline. A confirmed break signals a green light for a long position!
Risk-Reward: A tight stop loss at just 1.3% below entry keeps risk low, while the setup targets over 6% profit – that’s a juicy 4.6 R:R ratio! 💪
Bonus Pattern: We’re also eyeing an AB=CD harmonic pattern completion, which could amplify this move if it plays out.
Hold tight until Monday’s market open to see if the bulls take charge and validate this setup. Berkshire’s ready to run – don’t miss this potential gem! 🐂
⚠️ Disclaimer: Not financial advice – always DYOR and trade smart. Stocks can be volatile, so manage your risk like a pro!
🚀 Epic Analysis + Signals? Follow NOW! ✅
📊 Craving a Golden Chart? Smash BOOST! ✅
💬 Got ideas? Drop a COMMENT – we reply to the best! ✅
Follow = Profits | Boost = Gold Chart | Comment = VIP Access! 😎

Mean Reversion Setup: BRK.B1. RSI in oversold region
2. Price likely to rebound back the the mean
Trade Rules:
Entry Trigger - RSI has cross below oversold region, enter limit buy at close price
Exit Trigger - Close at market when close price cross above exit trigger (Red Line)

Buying the Dip or Catching a Falling Knife?Berkshire Hathaway has just broken its long-term rising channel after several years of steady growth. The recent pullback looks scary at first glance, but for long-term investors, this kind of correction could be exactly the kind of discount opportunity that rarely comes around.
Right now, NYSE:BRK.A is trading around the channel breakdown area, with potential downside targets between 20% and 30% from top, based on the chart structure. Those targets might sound steep, but they also represent attractive entry levels if you believe in Berkshire’s long-term strength.
So why is it falling now?
The market has been adjusting to tighter liquidity, slower growth expectations, and the possibility that several bubbles, especially in tech, government debt, or crypto, could start to deflate. As investors rotate capital or take profits, even quality names like Berkshire get caught in the correction.
But here’s where the story turns interesting, Berkshire Hathaway is sitting on one of the largest cash reserves in the world . That liquidity gives Warren Buffett and his team an enormous advantage. If any of these bubbles truly pop, Berkshire will be in a perfect position to deploy capital at huge discounts , just like it did during previous crises.
In other words, while others panic, Berkshire buys . And historically, that’s where the biggest gains are made.
Technical view:
📉 Channel break confirmed and pullback too → short-term bearish momentum.
🎯 Target 1: ~20% discount (first buy zone)
🎯 Target 2: ~25% discount
🎯 Target 3: ~30% discount (deep value area)
📊 Volume profile supports demand in these lower regions.
Long-term view:
If the broader market keeps correcting, Berkshire could temporarily drop further, but that only makes it a better deal for long-term investors looking to own a diversified giant with unmatched liquidity and buying power.
Short-term pain, long-term opportunity.

Berkshire’s Lower HighsBerkshire Hathaway has lagged as the broader market hits new highs. Is the financial giant stalling?
The first pattern on today’s chart is the series of lower highs since early May. Those may suggest its long-term uptrend is fading.
Second is the pair of large solid candles on October 10 and October 16. Prices have failed to get above those ranges, which may reflect a lack of buyers. Also notice how the $496 area was support earlier this month but has now morphed into apparent resistance.
Traders may next eye the August 22 weekly close of $489, which the conglomerate has recently stayed above. Would a close below that level trigger a breakdown?
Third, the 50-, 100- and 200-day simple moving averages (SMAs) have converged in the last two weeks. That could also reflect a weakening long-term trend.
Third, MACD is falling and the 8-day exponential moving average (EMA) is below the 21-day EMA. That may reflect growing bearishness in the short term.
TradeStation has, for decades, advanced the trading industry, providing access to stocks, options and futures. If you're born to trade, we could be for you. See our Overview for more.
Past performance, whether actual or indicated by historical tests of strategies, is no guarantee of future performance or success. There is a possibility that you may sustain a loss equal to or greater than your entire investment regardless of which asset class you trade (equities, options or futures); therefore, you should not invest or risk money that you cannot afford to lose. Online trading is not suitable for all investors. View the document titled Characteristics and Risks of Standardized Options at www.TradeStation.com . Before trading any asset class, customers must read the relevant risk disclosure statements on www.TradeStation.com . System access and trade placement and execution may be delayed or fail due to market volatility and volume, quote delays, system and software errors, Internet traffic, outages and other factors.
Securities and futures trading is offered to self-directed customers by TradeStation Securities, Inc., a broker-dealer registered with the Securities and Exchange Commission and a futures commission merchant licensed with the Commodity Futures Trading Commission). TradeStation Securities is a member of the Financial Industry Regulatory Authority, the National Futures Association, and a number of exchanges.
TradeStation Securities, Inc. and TradeStation Technologies, Inc. are each wholly owned subsidiaries of TradeStation Group, Inc., both operating, and providing products and services, under the TradeStation brand and trademark. When applying for, or purchasing, accounts, subscriptions, products and services, it is important that you know which company you will be dealing with. Visit www.TradeStation.com for further important information explaining what this means.

BRK.B - Back to former glory=======
Volume
=======
-neutral
==========
Price Action
==========
- falling wedge
- Weak selling pressure
- broken out of 2.5 years downtrend line
=================
Technical Indicators
=================
- Ichimoku
>>> price above cloud and rebounded from green kumo
>>> Green kumo budding
>>> Tenken + Chiku - above clouds
>>> Kijun - Above clouds
=========
Oscillators
=========
- MACD turning bullish
- DMI neutral
- StochRSI, turning bullish, reversing into band
=========
Conclusion
=========
- short to long term breakout swing
- price may reverse at current level, to enter spot or wait for pullback at entry 2.

Berkshire: Pulling BackBerkshire shares have recently surrendered some of their hard-earned gains. Despite this pullback, we continue to place the stock within magenta wave (X), which still offers some upside potential. A more pronounced downward move is likely only once the stock transitions into magenta wave (Y). At that point, we expect a retracement into our green Target Zone ($444.68–$415.61). Alternatively, it’s possible that the correction of wave alt. has already concluded. In this scenario, price would break above resistance at $571.83 directly, without first retesting the green zone—a development we assign a 35% probability.

Berkshire Hathaway: Clear Wave Structure Offering More GainsWhen I scan through charts, whether it’s stocks, currencies, or commodities, I want to focus on something that has a clear wave structure. Patterns like this allow me to read price action with more confidence, without needing to guess or force an opinion. Berkshire Hathaway is one of those charts right now.
What stands out is the sharp selloff, which looks like a textbook impulse. More importantly, there’s also a clear impulsive move from the lows. That combination suggests we could be looking at wave C low of a completed flat correction. If that’s the case, then more upside should follow.
Even in a less bullish scenario, where the structure plays out only as a temporary A-B-C rally, we would still expect further gains in wave C after the current pause. Either way, the clear structure points higher near term.
For me, this is where the opportunity lies. Markets are full of noise, but when you find a chart with this kind of clarity, it becomes easier to focus and build a plan around it.
Grega
BRKi have 2 tarde plan for Long.
Plan A (1st entry at 0.382% fib level stop loss Swing Low TP RR1:1 ).
Plan B (2nd entry at Bulish flage poll breakout target last sawing high).

Berkshire Hathaway (Class B) TANYSE:BRK.B — Daily
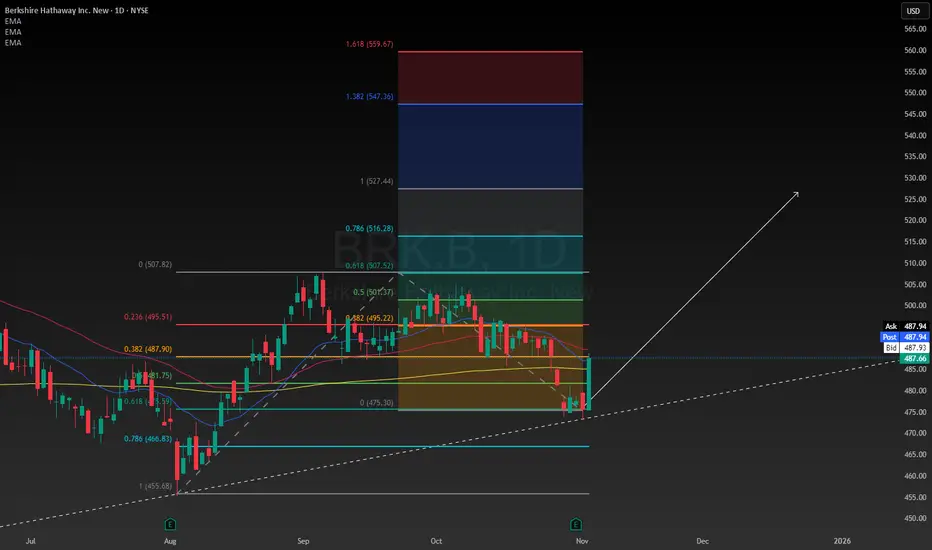
Set-up: After a 4-month downtrend, price based at $455.19 on increased volume. Since then, an 8-wave EWT fractal has played out and price has coiled into an ending/contracting triangle.
Evidence
Trend exhaustion signals: CCI pushed outside its Bollinger band on 5 Jun and 4 Aug; the latter aligned with the volume peak and low at $455.19.
200-day SMA: Flipped from resistance to support and has been respected since July, especially through mid-September while price consolidated inside the triangle.
Volume profile: A volume shelf sits at the lower edge of the triangle, consistent with acceptance and a pending range break.
MA squeeze: Short MAs are compressing → rising odds of a directional move.
Levels & paths
Upside trigger: Triangle breakout → first resistance/target $507.66 (recent swing high).
Downside risk: If the triangle fails and resolves as a bear pennant, a 1:1 pole projection points to ~$467. Loss of the volume shelf would add confirmation.
What I’m watching
A decisive daily close outside the triangle with volume expansion.
CCI to exit its band in the direction of the break (momentum confirmation).
200-day SMA reaction: hold = constructive, fail = favors ~$467 projection.
