Tesla - Withstanding all weakness!🏹Tesla ( NASDAQ:TSLA ) can still break out:
🔎Analysis summary:
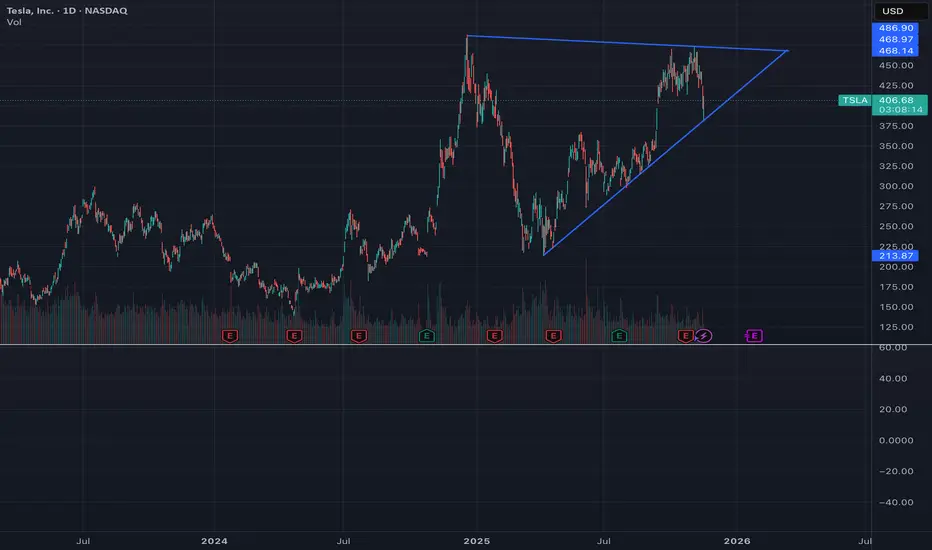
Since Tesla was listed on the Nasdaq back in 2013, we witnessed a lot of triangle breakouts. And starting all the way back in 2020, Tesla once again created a bullish triangle. Last month we saw the breakout and this month we have to see the confirmation
📝Levels to watch:
$400
SwingTraderPhil
SwingTrading.Simplified. | Investing.Simplified. | #LONGTERMVISION
Trade ideas

Tesla: DownwardShortly after our last update, Tesla experienced noticeable downward momentum, initially entering our previously magenta alternative target zone, which has already been stopped out. We currently consider the green wave complete, and the alternative target zone has been deactivated and grayed out. However, there's still a chance the stock could rise sharply, confirming an ongoing upward trend. If this alternative scenario, which has a 35% probability, plays out, we would mark blue wave alt.(II) as complete and expect gains above the resistance at $509.50 and $532.92 within a magenta upward impulse. Primarily, we anticipate further sell-offs and expect the regular wave-(II) correction low to occur first in our green target zone between $157.88 and $46.70. This green zone could potentially be suitable for long entries, protected by a stop 1% below the zone's lower edge.

TSLA – Heavy Selling Finally Slows Down. TA for 11/17TSLA – Heavy Selling Finally Slows Down, but Buyers Still Need to Prove Themselves
TSLA has been one of the cleaner charts lately—not because it’s trending, but because the selling was so aggressive that the structure became obvious. Now that the drop has finally stalled, the real question is whether buyers can turn this into a recovery, or if today’s bounce was just a dead-cat reaction inside a bigger downtrend.
When I line up the 1-hour trend, the intraday 15-minute behavior, and the GEX levels behind the scenes, the situation becomes clearer.
1️⃣ 1-Hour Chart — Downtrend Still Dominant, but a Temporary Floor Formed
The 1H chart shows how sharp the selling was. TSLA broke every rising structure and couldn’t hold any mid-trend supports. It wasn’t until price flushed all the way into 380–385 that buyers finally stepped in with conviction.
What stands out is the wedge-shaped channel.
The upper trendline has been respected for days.
The lower trendline caught the bounce perfectly.
Now TSLA is sitting right in the middle of that wedge—not bullish, not bearish—just pausing after a strong decline.
Key 1H levels that matter:
* 423–424: First big resistance where every bounce fails
* 405–410: Local pivot zone
* 380–385: The level that saved TSLA from a deeper breakdown
Trading between these zones tends to be choppy, so I’m watching for a decisive break.
2️⃣ 15-Minute Chart — Short-Term Momentum Slowed, but No Reversal Yet
The 15M chart tells the real short-term story.
After the heavy downward move, TSLA printed a clean demand zone at 380–385 (multiple green FVGs). That’s where buyers finally stopped the bleeding. Price pushed up into 405–410, but stalled immediately. The last several candles show hesitation—buyers aren’t pulling away, but sellers haven’t fully taken over either.
The 15M structure right now:
* Strong demand: 380–385
* First barrier: 405
* Real test: 423–424
* EMAs are flattening, signaling indecision
The 15M chart is giving a “wait for confirmation” type of vibe. No clear reversal yet—just a temporary pause after a strong selloff.
3️⃣ GEX (1-Hour) — Finally Tells Us Where TSLA Wants to Go
This is the part of the chart that explains the hesitation.
Upside Levels (if buyers take control):
* 410: First meaningful GEX resistance
* 415: Stronger gamma wall
* 437–450: Multiple call walls stacked together
If TSLA ever gets above 424, the path toward 437–450 becomes much easier than it looks on the chart.
Downside Levels (if sellers return):
* 400: Light put support
* 395: Stronger hedge zone
* 380: Heavy put wall — explains the huge reaction today
* Below 380 → hedging accelerates toward 370
The GEX map lines up perfectly with what happened today:
Price bounced exactly at the deep put wall around 380, where market makers hedge aggressively.
This is also the kind of GEX structure that makes traders ask,
“Why does TSLA always bounce or stall at the same levels?”
—because these levels come from options positioning, not candles.
🎯 How I’m Approaching TSLA for 11/17
🔼 Bullish Plan (Only Above 410, Strong Confirmation Above 424)
This is not a name I want to jump early on.
TSLA is still in a downtrend, so the bullish scenario needs real confirmation.
Stock Trade Idea:
* Entry #1: Above 410
* Entry #2: Safer play above 424 (clean break of daily resistance)
* Targets:
* 430
* 437
* 445
* 450 (call wall + gamma cluster)
Options Idea:
* 420C / 430C for scalp
* 440C / 450C for swing continuation
* Only valid above 424
🔽 Bearish Plan (Below 400 → Downside Opens Fast)
If TSLA rejects 410 again or loses 400, the structure flips back to bearish.
Stock Trade Idea:
* Entry: Below 399.50
* Targets:
* 395
* 385
* 380 (major put wall)
* 370 if 380 breaks
Options Idea:
* 400P for scalp
* 385P or 380P for continuation
* If 380 fails → 370P becomes attractive
TSLA usually moves fast once it touches GEX/Put levels, so these can be sharp trades.
⚠️ Choppy Zone: 400–410
This whole zone is a trap area—lots of indecision, lots of fakeouts, thin conviction.
I avoid trading TSLA inside this zone unless volume spikes.
Final Thoughts
TSLA is in a spot where both bulls and bears have clean levels to play off. Today’s bounce was strong, but it came directly from a major put wall, so the reaction makes sense. The real direction doesn’t start until TSLA breaks either 410 up or 400 down—everything in between is chop.
Once one side wins, the move should be clean because both the chart and GEX positioning align on the next targets.
Disclaimer
This analysis is for educational purposes only and does not constitute financial advice. Always manage your own risk.

TSLA: Serious Divergence at $380As a long term investor I am not concerned with corrections, and when we look back at price movement retrospectively, they always seem to be the correct movements.
I trust the process, but it's always fun to try and snipe a buy. To me it feels like upper 300s are on trend for a reversal. Tesla is known to move slow and sideways before moving higher. So I don't presume to know when we begin to hit the $500s. However, I do believe it is inevitable - whether we get there before the end of the year or next year.
No trade advise. Just investing in quality companies for the long term.

TSLA - Hold to die till the Optimus RobotConsumer availability: Earliest realistic U.S. consumer release ≈ 2030, with broad adoption 2032–2035.
Rollout path:
Tesla factory use (2025–2026) →
Pilot programs (2027) →
Enterprise sales (2028) →
Consumer launch (~2030).
Expected price:
Mass-market target: $20K–$25K
Early enterprise units: $30K–$40K
Premium version: $45K–$60K
Why the delay: Safety certification, AI reliability, household task generalization, insurance, and building a nationwide service ecosystem.

sell tslatsla printed a beautiful double top. tsla price broke down highlited price range, retested it and is came back down again, sell here, tsla is now super bearish... it will likely lead an upcoming sell-off in stocks.

325 and then 800?Shaping up nicely to double next year. Most likely it will go down to 325 and if it can hold 325 then 800 coming next year most likely. If it looses 325 on a monthly basis then all bets are off.
Happy Trading. Not a financial advise.

TeslaPrice finally made it down into the target box last Friday and already bounced higher moving back out of the box. Rather we make another low towards the 1.382 remains to be seen. If we have bottomed in what I am calling minor A, then we should move higher to the $440-$450 area next. There also remains the possibility that we get another high if intermediate (B) is yet to complete.
Currently price is moving down in the overnights. If we can get some more data pointing higher, though, I will begin tracking that move with fibs. Until then, there remains the very real possibility that we get another low.

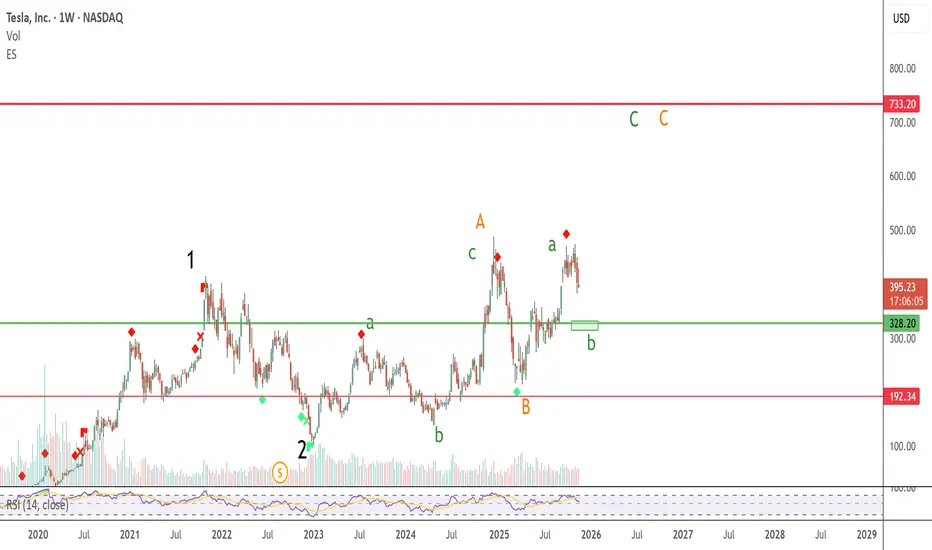
Tesla's curious caseTesla has always been a volatile stock but since 2021, it has forever been under corrective wave strcuture. Its not the typical corrective structure where the prices only go down, but it's a combination of large scale Zigzag and inverse Zigzag.
The current corrective wave will end between 320-328 and then again an upmove journey will begin heading towards 733 mark ( exact number to be confirmed once uptrend starts.
Be on the watch out for entering at 325.
Tslar4BearsThe
tslar's
elon musk recent vote likely to favor
the
bears temporarily
as
we
go
into
the
new
week
Though the year may likely end bullish

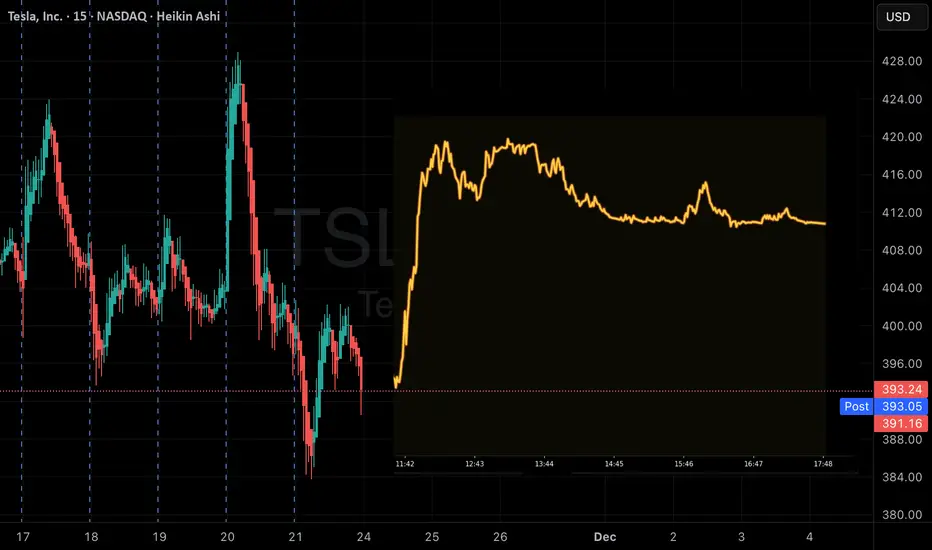
TSLA Momentum Play: QuantSignals V3 Sees Strong UpsideTSLA | QuantSignals Katy 1M Prediction (2025-11-21)
Current Price: $385.51
Predicted Close: $396.06 (+2.74%)
30-min Target: $393.15 (+1.98%)
Trend: Bullish
Confidence: 75%
Volatility: 27.4%
Trade Signal
Direction: CALL
Entry: $385.51
Target: $393.95
Stop Loss: $379.73
Expected Move: +2.74%
Summary: 1 trade signal generated from 1 successful analysis.
TSLA BULLISH BIAS RIGHT NOW| LONG
TSLA SIGNAL
Trade Direction: short
Entry Level: 404.30
Target Level: 433.84
Stop Loss: 384.55
RISK PROFILE
Risk level: medium
Suggested risk: 1%
Timeframe: 5h
Disclosure: I am part of Trade Nation's Influencer program and receive a monthly fee for using their TradingView charts in my analysis.
✅LIKE AND COMMENT MY IDEAS✅

Tesla at Key Support Level & Wins Ride-Hailing Permit in ArizonaTesla has secured a Transportation Network Company (TNC) permit in Arizona, marking another strategic step toward launching its robotaxi service. While the permit does not authorize Tesla to operate a fully driverless ride-hailing network, it grants the company legal approval to function as a ride-hailing operator under state regulations. This follows Tesla’s earlier approval in September to test autonomous vehicles with a safety driver on Arizona roads.
According to the Arizona Department of Transportation, Tesla applied for the permit on November 13 and met all regulatory requirements, receiving approval on November 17. The TNC license positions Tesla to begin laying operational groundwork for its robotaxi ambitions, fleet structure, service protocols, pricing models, and state compliance, while it continues advancing autonomous capabilities through its Full Self-Driving (FSD) platform.
Arizona has long been considered one of the most autonomous-friendly states, hosting early deployments from Waymo, Cruise, and other AV developers. Tesla’s entry expands the competitive landscape and brings its robotaxi vision closer to reality, though safety-driver supervision remains mandatory for now. The new permit reinforces Tesla’s strategic push into transportation services, signaling that regulatory pathways for FSD-enabled ride-hailing are steadily opening.
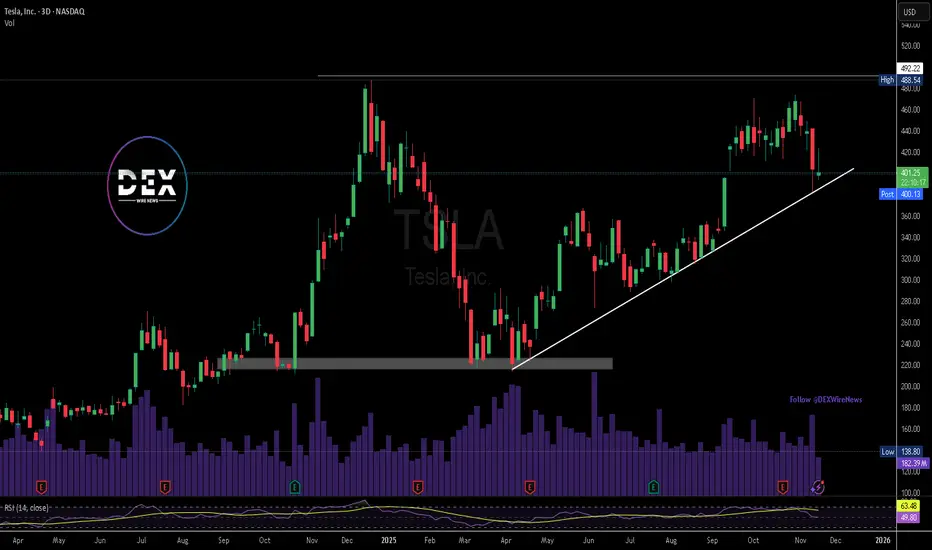
Technical Outlook
Tesla’s chart shows price pulling back into a key ascending trendline that has supported the uptrend since April. The current zone around $401 is a strong demand area, aligning with trendline support
A bounce from this level sets Tesla up for a potential continuation toward the major resistance at $488. A clean break above that level would confirm a medium-term bullish extension. RSI remains neutral, suggesting room for upside if buyers defend current support.
If the trendline fails, Tesla could retest deeper support near the $330–$345 range. For now, momentum favors a rebound as long as the trendline holds.
Tesla next months Unfortunate that market has pulled back over the last few weeks, otherwise this would have happened earlier. Pretty sure we see 500+ within the next 3 months or so.
I hope you enjoy the kid pencil.

TSLA the rollercoaster continuesCould Burry be right?
AI bubble could burst and take other stonks down, we need a correction NASDAQ:TSLA is expensive....again 300 could be possible again. This is what a healthy correction could look like even if nothing happens with Open Ai/Nvidia/Ect...

Buy low, sell high, CC on TSLAI've sold SOOO MANY CALLS up here. I just keep buying them back and selling more. This one looks SUPER nice. 2 weeks until expiration! 1%. Plus a day of theta. If I get called away at $450 = amazing

my levels to manage TSLA on Friday 11/14My direction: Bearish to neutral-bearish in the near term. I expect further downside or at best a weak bounce, given the mark-down phase, heavy volume selling, weak momentum and broken supports.
If things stabilize, there’s a chance for a relief bounce but nothing suggesting a strong bull run right now.

Tesla - The Bullish Path Is Clear... For Now.Hey Traders! It’s been a while since I posted about TSLA. This one isn’t an in-depth LTF breakdown — instead, we’re zooming out to identify the higher-timeframe targets and where price wants to go before any real continuation can happen.
The market runs on liquidity — and the less of it there is, the harder it is for price to move freely. Because TSLA carries so much liquidity and volatility, we don’t need the same slow, drawn-out liquidity builds that other stocks require. The swings are large and the algorithms respect because the liquidity is always there.
When we zoom out, the structure becomes clearer. The market consistently gives us signs before each major move — and on a higher-timeframe bullish Tesla, the price action is guided by white tapered selling, which acts as our roadmap for healthy continuation.
But here’s the nuance:
The higher up in timeframe we go, the more liquidity is required to sustain the next leg. That’s why we often see price digging deep into previously proven and broken algorithms before continuing higher. It’s not randomness — it’s the market refueling for expansion.
The path is pretty clear ahead for TSLA that we'll need to take advantage of HTF algorithms in order to break out of a much HTF liquidity structure.
Happy Trading:)

Tesla Retests Key support Amid a New Lawsuit After Deadly CrashTesla (NASDAQ: NASDAQ:TSLA ) faces renewed scrutiny after a lawsuit was filed over a fatal January 2023 crash in Washington state. According to the complaint, the vehicle “rapidly accelerated” before striking a utility pole and bursting into flames, killing one passenger and severely injuring another. First responders reportedly struggled to access the victims due to the vehicle’s structure and fire behavior, raising questions about safety systems and emergency accessibility.
The lawsuit lands during a period of heightened attention on Tesla’s real-world AI features, including Autopilot and Full Self-Driving (FSD). While the filing does not explicitly blame autonomous systems, it adds pressure to Tesla’s regulatory and legal environment, which remains a critical investor risk factor heading into 2026.
Tesla’s Fundamentals Remain Strong
Despite the legal challenges, Tesla retains a massive market cap near $1.33 trillion and continues scaling its energy and robotics divisions. The company remains profitable, with a strong balance sheet and long-term margin expansion driven by software, AI, and autonomous capabilities. The Optimus humanoid robot program and 4680 battery ramp both strengthen Tesla’s position in the next industrial cycle.
Tesla’s broad lineup—from the Model 3 to the Semi and Cybertruck—supports global delivery growth, while its charging infrastructure partnerships increase ecosystem reach. Fundamentally, Tesla remains one of the strongest players in the EV and AI–mobility sectors.
Technical Outlook: Trendline Retest in Play
From a price-action perspective, Tesla trades around $391, pulling back toward a critical ascending trendline visible on the weekly chart. This trendline has guided Tesla’s recovery since April and remains the key level to watch.
Support:
• $390 trendline
• Major demand at $350
• Long-term support at $250
Resistance:
• $425
• $492 (2025 high)
A strong bounce at the trendline could send TSLA back toward $425 and eventually $492. However, a clean breakdown risks a deeper correction toward the $320 zone.

TESLA: Bullish Continuation is Expected! Here is Why:
It is essential that we apply multitimeframe technical analysis and there is no better example of why that is the case than the current TESLA chart which, if analyzed properly, clearly points in the upward direction.
Disclosure: I am part of Trade Nation's Influencer program and receive a monthly fee for using their TradingView charts in my analysis.
❤️ Please, support our work with like & comment! ❤️

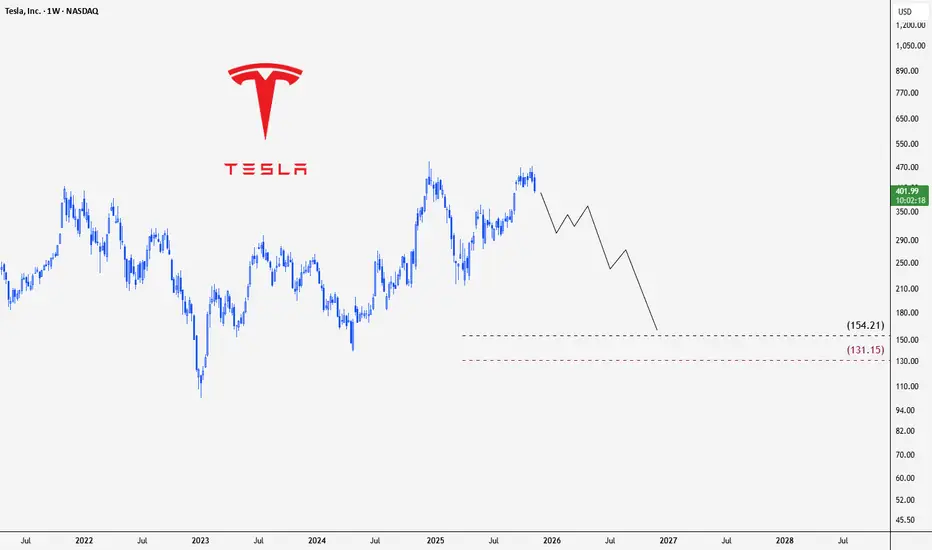
#TESLA My prediction for the next waveHello everyone
My prediction is that we will see a downward trend towards the targets outlined in the idea
The decline will take more than six months
This is not investment advice; please take full responsibility for your buying and selling decisions.
Warning: Be careful not to use this idea with leverage, as you could lose all your money
TSLA Touches Key Support and Rejects Lower LevelsTesla has just tapped its long-term ascending support line, respecting the multi-month higher-lows structure that has guided price since early 2024. The rejection from the trendline coincides with rising volume and early signs of momentum recovery, suggesting buyers are defending this zone. As long as TSLA holds above this support, the setup favors a move back toward the upper resistance of the symmetrical triangle, with downside risk limited to a break below the trendline.
TSLA Plunging? The Fake Rebound Before the Real Crash!Tesla (TSLA) is entering a challenging phase as a wave of negative news hits from both fundamental and technical sides. Sales in China — Tesla’s second-largest market — have dropped to their lowest level in three years , sparking fears that real demand for EVs is cooling. At the same time, Elon Musk’s massive $1 trillion compensation package has raised concerns among investors who believe Tesla’s current valuation far exceeds its actual profit potential.
On the daily chart, TSLA is showing clear signs of weakness after an extended uptrend. The price is now testing the medium-term ascending trendline around the $430 zone . If buying pressure fails to hold this level, there’s a strong chance the price will break the trendline and enter a deeper correction phase .
In the short term, Tesla could continue to drop toward the $400 area , where strong support and the Ichimoku cloud base converge. Any rebounds, especially near the $450 resistance zone, should be viewed as opportunities for sellers to re-enter rather than signs of recovery.
