Trade ideas

AMAT - Earnings option play, $42 August 18th/25th Puts $0.60/.76AMAT seems very good earnings play on the down side. It has good amount of insider selling. On the technical side it seems breaking down from an upward channel, and also looks like its forming a double top. Overall it seems it has good chance to decline with the earnings. To play this we would look for $42 August 18th or 25th Puts currently $0.60 and $0.76
* Trade Criteria *
Date First Found- August 17, 2017
Pattern/Why- Earnings Play (High Risk Trade); Upward channel breakdown, Double top
Entry Target Criteria- We would look for $42 August 18th or 25th Puts currently $0.60 and $0.76
Exit Target Criteria- $34
Stop Loss Criteria- N/A
Please check back for Trade updates. (Note: Trade update is little delayed here.)


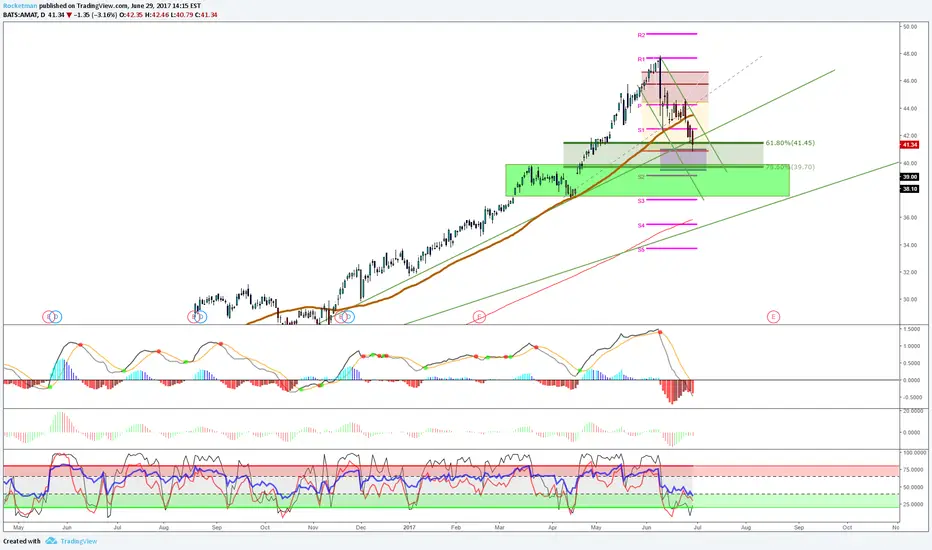
Imminent Drop Ahead For Applied Materials (AMAT)Applied Materials, Inc. has been dropping suddenly when the positive vortex indicator (discussed below) reaches its current level. This pattern has occurred seven times dating back to December 2015. It could be coincidence and/or it could be a great opportunity to haul in large gains with put options.
The positive vortex indicator (VI) is at 1.2955 and the negative is at 0.6028. When the positive level is higher than 1 and higher than the negative indicator, the overall price action is moving upward. When the negative level is higher than 1 and higher than the positive indicator, the overall price action is moving downward. The positive value has begun to retreat and the significance will be covered in the SPECIFIC ANALYSIS section below.
The stochastic oscillator K value is 92.8307 and D value is 59.4358. This is a cyclical oscillator that is highly accurate and can be used to identify overbought/oversold levels as well as pending reversals and short-term activity. I personally use anything above 80 as overbought and below 20 as oversold. When the K value is higher than the D value, the stock is trending up. When the D value is higher that the K value the stock is trending down. The stochastic has been moving wildly since the stock lost greater than 9% in June. Currently the stock is approaching overbought levels, but both the K and D may not make it to this point before the stock tumbles again.
SPECIFIC ANALYSIS
Every time the Positive Vortex Indicator value reaches its current level, the stock drops a sizeable amount on the following trading day. In this case, the stock could drop more than 3.5% on Monday July 24, 2017. The observed pattern requires the positive VI value to break above 1.2955 and later retreat below this level. The day of the retreat is the signal, and the following day produces the loss.
Two examples are visible on the chart above with a light blue vertical line. The vertical line represents the day the positive VI value retreats below the 1.2955 mark. As you can see, the day after is always a down day, and a sizeable drop at that. You should be able to scroll to left of the chart above and view all seven instances as they are marked with the same light blue vertical line. The percent lost on these days following the crossing of 1.2955 has been: 9.30%, 3.79%, 7.24%, 1.95%, 1.75%, 3.35%, and 3.26%. That is a minimum loss of 1.75% and median loss of 3.35% with a standard deviation of 2.82%.
Furthermore, most of these one-day losses are just the beginning of greater losses. Five of the instances led to greater losses that spanned between 15-28 days. All of the following losses are based on the close price of the retreat date to the low price on the final day of decline. The minimum decline for all seven instances was 3.50% with a median loss of 7.30%.
The possible movements for the next few weeks are indicated above. The stock could drop to the horizontal light blue line (45.17) at some point on July 24, 2017 or within the next few days. The median movement is the orange rectangle on the chart. If median movement from the previous occasions is achieved, the stock could drop to 43.41 within the next 14 trading days. My conservative pick for movement is a drop to 44.23 within the next 25 trading days. Any of these levels would be significant, but another one day greater than 1.75% would keep this interesting pattern alive.
Considering the information above and recent patterns, the stock should see downward movement over the short to intermediate time period. Based on historical movement compared to current levels, the stock could drop at least 5% over the next 25 trading days if not sooner.


AMAT: The Perfect SpotIt is one day before the end of a 3 month holding period where I re-evaluate a stock. It is right here where AMAT graces us with another buying opportunity. Since I am already in, I will not add more, just watch.

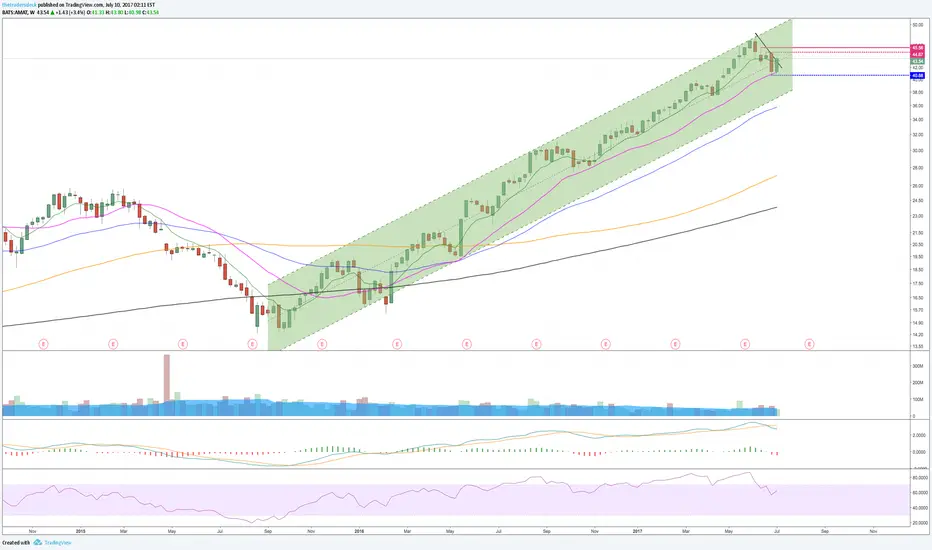
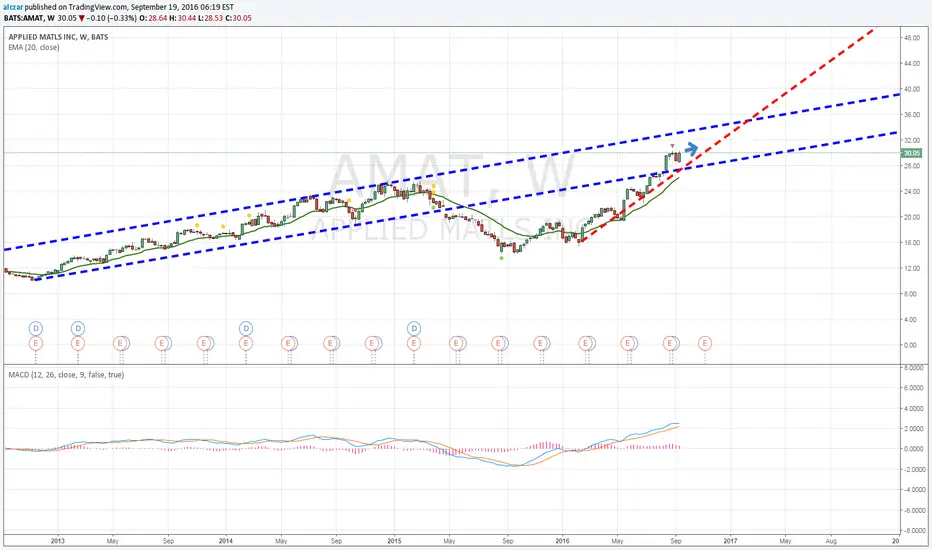
AMAT uptrend in progressThis is one of our favourite stocks. Most Dynamic Traders have multiple positions, whic are in good profit. I have been buying into AMAT since summer last year and it paid off quite well, although I could have chosen a more aggressive compounding method. Nevertheless, price is currently dealing above $40 and triggered me into another position. I am looking to add further once we see more strength towards $50 and ideally beyond.
I am not going to chase the market but rather wait patiently for another signal. Nothing more can be done.


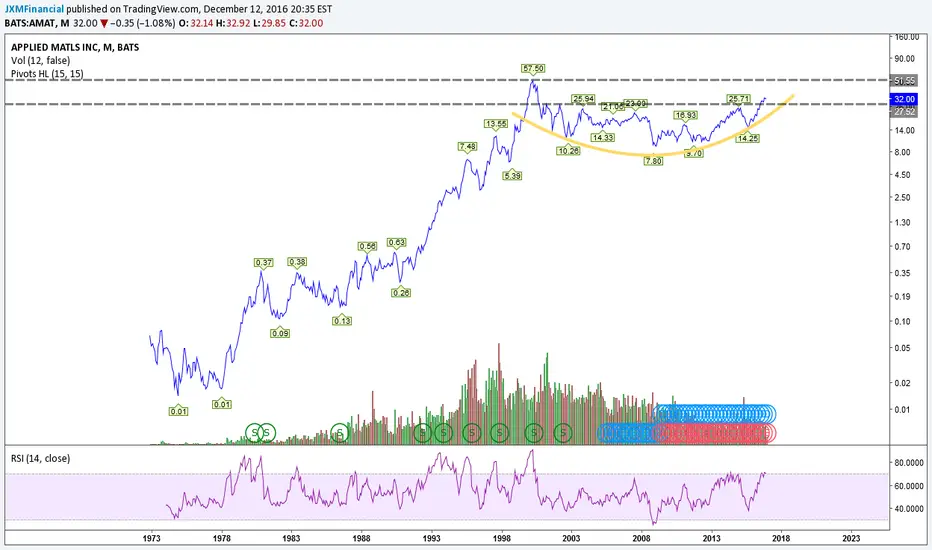

$AMAT - MonthlyThis looks like a great short set up to me. Tagging R3 on monthly and 2.272 fib ext. Williams R indicating sell. Most likely we see this tank on ER today.

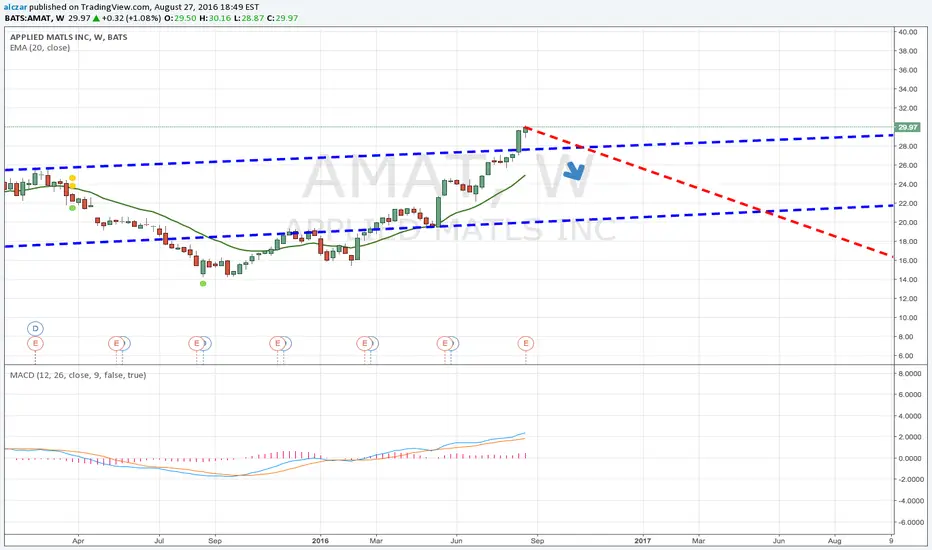
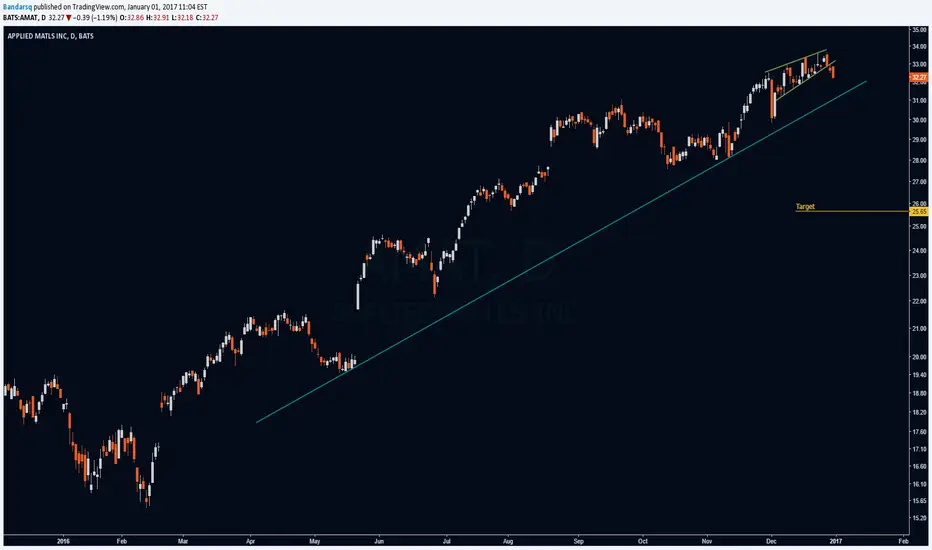
Expected to test support zone before resuming 13-month uptrend11-11-2016
AMAT @ 28.28 – Expected to test support zone before resuming 13-month uptrend
AMAT rallied 13 months to reach 31.07 (September 22, 2016 high) before consolidating. The pullback so far has been benign, down 11% to 27.56 (October 13, 2016 low). As the momentum indicator remains neutral, the stock is expected to consolidate further towards the 26.00-27.00 support zone. Beneath lies the key retracement of 38.2% of the 15.44/31.07 upswing at 25.23. As far as the key support area holds, scope remains for resuming the year-long trend back to 31.07. An upside break above the latter would confirm the bulls are back in control for new highs.
However, a downside break below the 25.23 area would suggest more downside towards the 23.40 area (50% of the 15.44/31.07 upswing).
Outlook:
Daily: neutral
Weekly: bullish
Monthly: bullish


Price is at the round number resistanceAMAT is a stock that has been mentioned in our trading community a fair few times. It has been trending well but hesitating around the $30 round number.
Support is just over $1 away so a tighter trailing stop may be required to lock in profits for the Dynamic Traders who have positions in this.

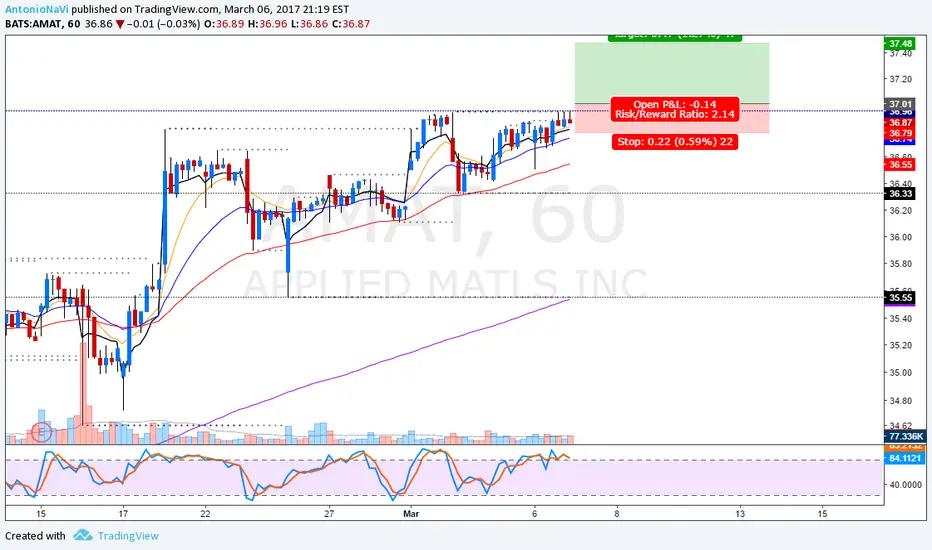
Applied MaterialsDemand Zone at former resistance on the daily chart signals a good long entry
Entry: $27.68
Stop Loss: $27
Target: $29