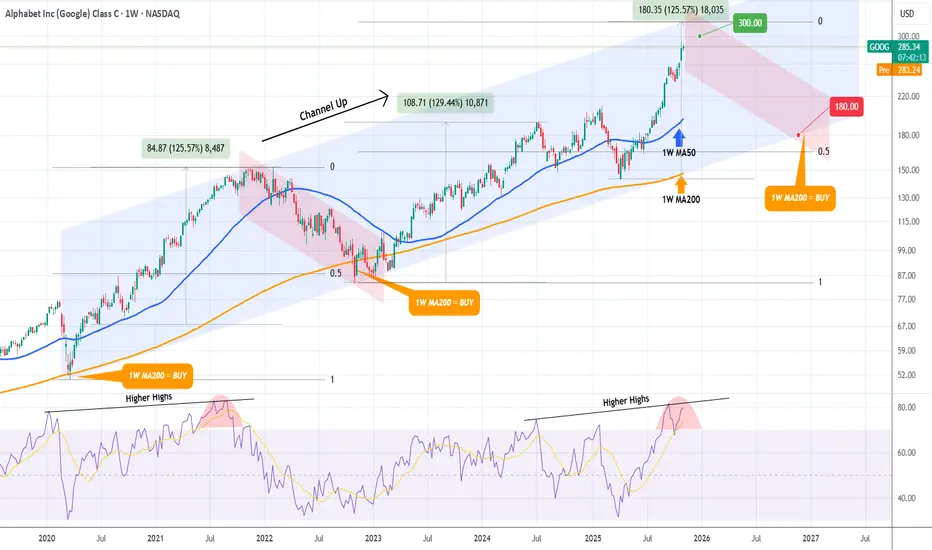
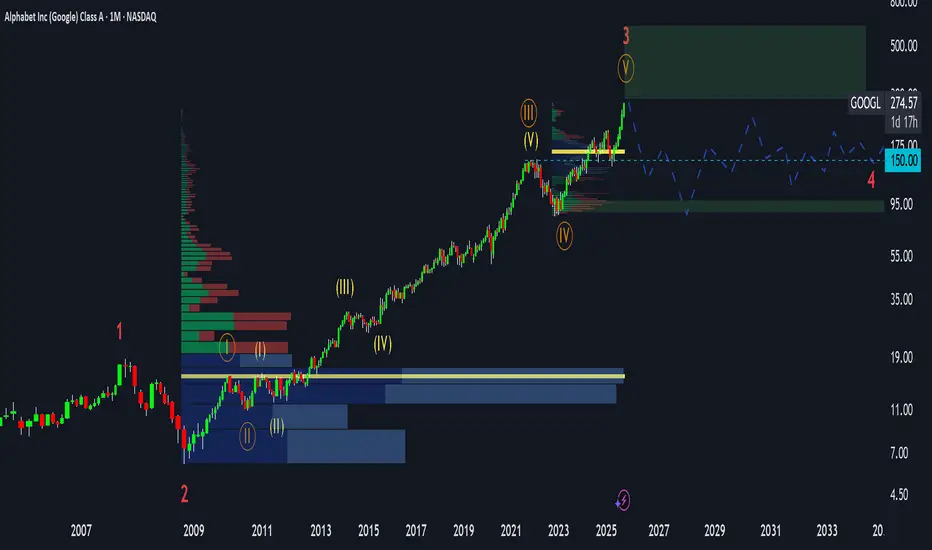
GOOGLE Bull Cycle running out of steam. Be ready to sell.It's been exactly 2 months (September 05, see chart below) when we last had a look at Google (GOOG) giving a strong break-out Buy Signal that methodically hit our $275 Target:
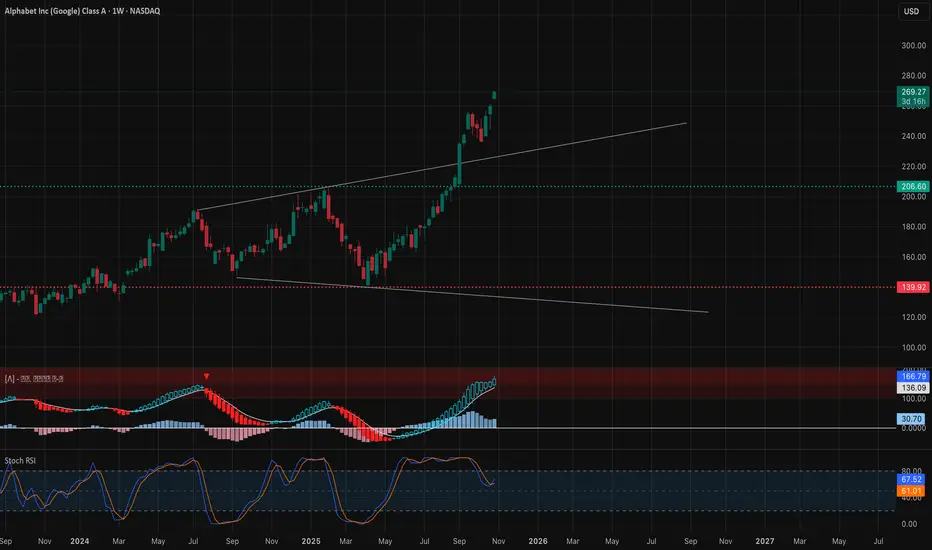
This time we look at the stock from a much longer term perspective on the 1W time-frame, where it is approaching the top (Higher Highs trend-line) of the Channel Up that started on the COVID crash (March 2020).
This is a major Sell Alert as the 1W RSI is also printing a Double Top formation similar to the November 15 2021 Top. Given that +125% rallies have been the most common long-term sequences of this pattern, we believe that any price above $300 is a major Sell for Google.
The strongest long-term Support and Target of correction sequences/ Bearish Legs has been the 1W MA200 (orange trend-line) and this is our Target for 2026. We estimate that a potential contact with the 1W MA200 can be made at around $180 (also marginally above the 0.5 Fibonacci level from the bottom of the previous correction). A contact with the 1W MA200 will be our next long-term Buy on Google.
-------------------------------------------------------------------------------
** Please LIKE 👍, FOLLOW ✅, SHARE 🙌 and COMMENT ✍ if you enjoy this idea! Also share your ideas and charts in the comments section below! This is best way to keep it relevant, support us, keep the content here free and allow the idea to reach as many people as possible. **
-------------------------------------------------------------------------------
💸💸💸💸💸💸
👇 👇 👇 👇 👇 👇
Trade ideas
GOOGL Momentum Wave at Peak Extension- (Nov. 3–7)GOOGL Momentum Wave at Peak Extension – Liquidity Battle Ahead🔥
WEEKLY TIMEFRAME ANALYSIS
1. Market Structure
GOOGL remains in a dominant weekly uptrend with a clean BOS breakout over previous highs. The chart printed a shallow pullback that respected the mid-trendline before pushing higher — that’s characteristic of momentum-driven accumulation.
We saw previous CHoCH attempts during earnings volatility, but none sustained. That tells me smart money absorbed dips instead of distributing.
Major liquidity sits below:
• $207–$210
• $186–$190
Above current price is discovery — thin liquidity, fast travel potential.
2. Supply & Demand / Order Blocks
There’s a bullish order block sitting right around $207–$210 that hasn’t been fully mitigated. If the market wants a discount, that’s the obvious landing spot.
Deeper demand lives at $140–$156, serving as the long-term institutional accumulation range.
Supply overhead begins in the $290–$300 band. That’s where short sellers tend to get aggressive and profit-takers defend levels.
3. Indicator Confluence
The 9EMA above 21EMA with strong slope confirms trend continuation. MACD histogram is showing large green bars — buyers still have authority. Stoch RSI is elevated but cycling with price, not diverging.
Volume expansion during push candles suggests trend confirmation, not exhaustion… yet.
4. Weekly Tone
Momentum is stretched, but dips continue to get bought. If the market pulls back into the mid-trendline, that will be a high-confluence area for continuation traders.
DAILY TIMEFRAME ANALYSIS
1. Market Structure
Daily candles show an extended channel grind higher. Friday printed a pullback wick from upper channel resistance — exactly where you’d expect algo sell programs to fire.
Key structure levels:
• $256 support (micro trendline convergence)
• $235 for deeper liquidity sweeps
A breakdown below $256 would telegraph distribution before continuation.
2. Supply & Demand / Order Blocks
Demand clusters:
• $256–$258 (first bounce zone)
• $235–$238 (secondary re-load if volatility spikes)
Supply clusters:
• $281–$286 (multiple rejections)
• $298–$300 psychological wall
Breaking $286 with volume opens the window to run trapped shorts quickly.
3. Indicator Confluence
The 9EMA is still above the 21EMA, but slope is flattening — early caution sign. MACD histogram is stabilizing after a strong push. Stoch RSI remains high but hasn’t crossed down yet — bulls still in control.
Volume is softening; expect mean reversion behavior early week.
4. Daily Tone
As long as GOOGL respects the mid-channel, dips are buyable. Lose the channel and we’ll rotate into liquidity pockets below $260.
15-MINUTE INTRADAY STRUCTURE
1. Market Structure
The 15m printed a CHoCH → BOS sequence after liquidity was swept at $277.04. Price then consolidated in a wedge under micro resistance — typical pre-break setup.
However, lack of continuation into close suggests market makers are waiting until liquidity opens Monday.
2. Supply & Demand / Order Blocks
Demand intraday:
• $278.20–$279.20 (first bounce pocket)
• $277.00–$277.50 (deeper wicks)
Supply intraday:
• $283.00–$286.05 (active sell wall)
• $289.50 liquidity shelf on upside rejection
Breakout above $283 will trap short scalpers.
3. Indicator Confluence
9EMA curling toward 21EMA, signaling potential early session squeeze. MACD histogram is flattening — momentum coiling. Stoch RSI is curling up from lower band — bullish inflection signal.
4. Intraday Tone
Expect fakeout volatility first 30 minutes. If micro trendline breaks with volume confirmation, watch for a push into $283+, possibly wicking into $286.
GEX (Gamma Exposure) & OPTIONS SENTIMENT
Call walls stack at:
• $297.5
• $300
Strong gamma magnets if price enters that zone.
The highest positive NET GEX sits around $280.75 —
this is why price keeps orbiting here. Dealers hedge around this level to reduce risk.
Put support sits at:
• $275
• $265
Break below $275 and gamma flips accelerate downside.
High volatility pivot event: 11/07
Expect volume shifts into that date.
Strategy alignment:
• Above $283 → call scalps into $286–$290
• Below $277 → puts toward $275–$270
• Between $278–$281 → premium chopping zone — avoid directional bias
TRADE SCENARIOS (Nov. 3–7)
✅ Bullish Setup
Trigger: Hold above $283 and break wedge resistance
Entry: Retest $282.70–$283.10
Targets: $286.00 → $289.50 → $297.50 (call wall magnet)
Stop: Below $281.20
Invalidation: breakdown of intraday trendline support.
✅ Bearish Setup
Trigger: Breakdown below $277** with confirmation**
Entry: Retest $277–$277.30
Targets: $275 → $270 liquidity sweep
Stop: Above $278.80
Invalidation: strong buy reaction + MACD shift at $277 pocket.
CLOSING OUTLOOK
GOOGL is stretched but not exhausted. As long as bulls defend $278–$281 early week, continuation trades remain valid.
However — if we reject $283 repeatedly with declining volume, look for a controlled pullback into trendline support around $256 later in the week.
Personally, I’m watching for quiet Monday accumulation under wedge resistance — that often precedes a mid-week expansion when volatility event catalysts arrive.
DISCLAIMER
This analysis is for educational purposes only and not financial advice. Always manage your risk and trade your own plan.
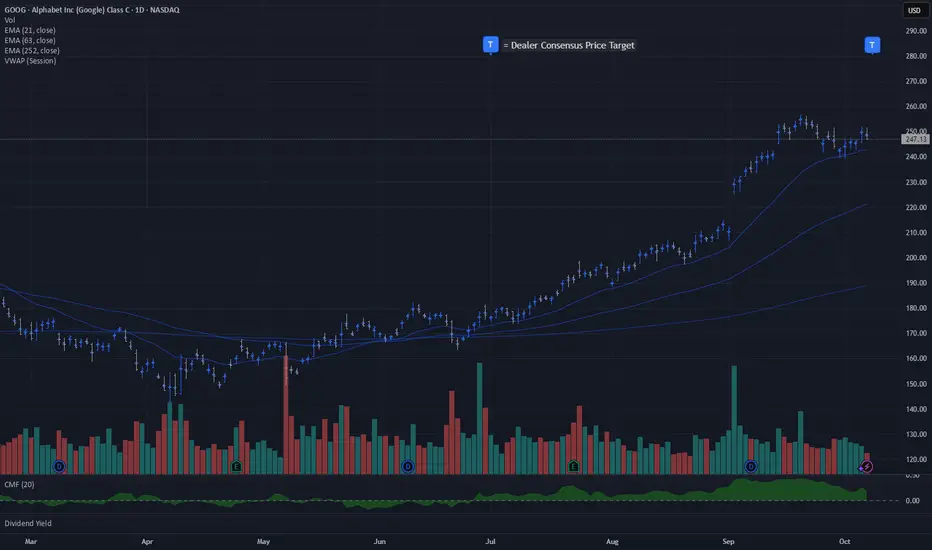
GOOG | Dealer Consensus Price Target $281Special appearance of a mega-cap on the top ranked dealer positioned names.
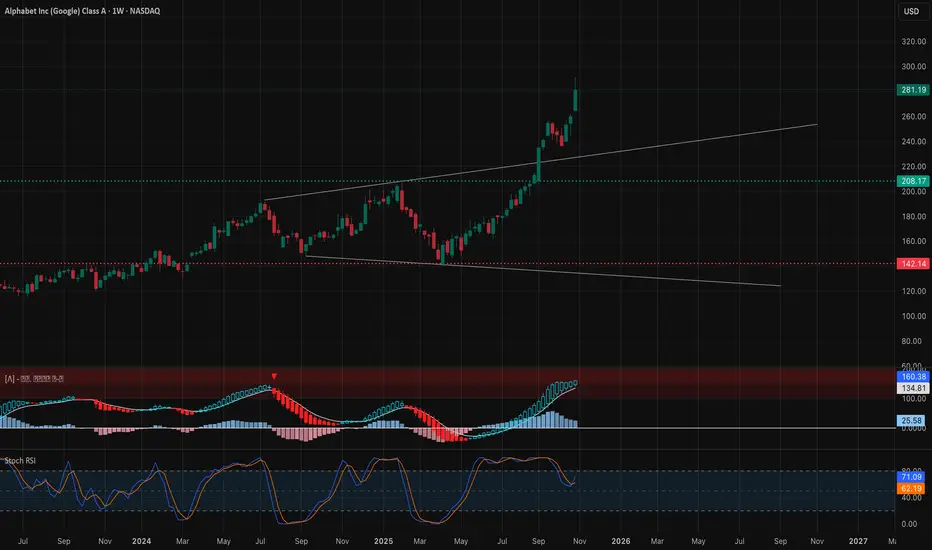
Bull run for GOOGL incoming?Google just pushed out of it's bearish flag channel. Then, on Friday it successfully retested it.
Trading at a forward of P/E of 19.6x which is the lowest of all the Mag7.
Ideally I'd like to see GOOGL break the ATH support and trade the breakout.
But that this point already, I will likely begin to open a long position.
Ideally this doesn't happen so close to earnings (As it can blow up the entire pattern), but I think it's still worth a shot.
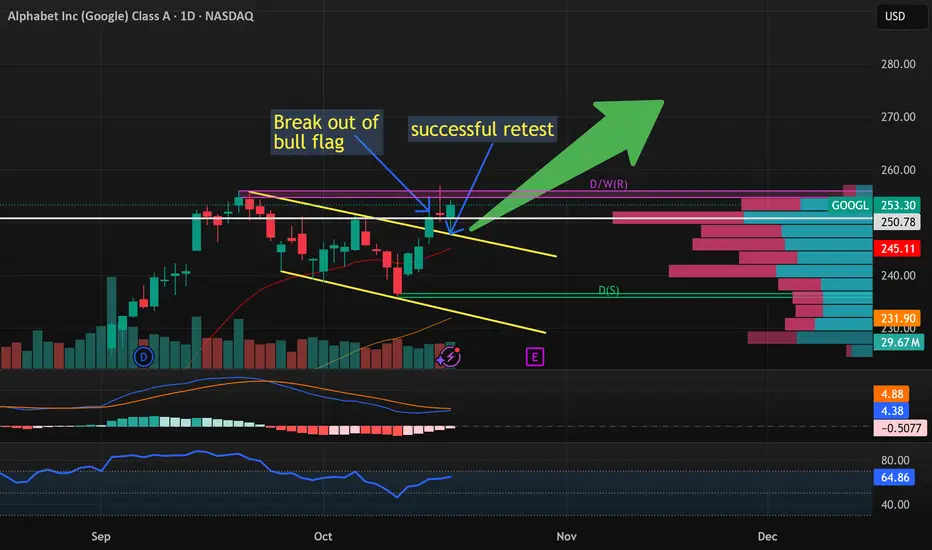
Breaking: Alphabet Inc. (NASDAQ: $GOOG) Spike 12% TodayThe share price of Alphabet Inc. (NASDAQ: NASDAQ:GOOG ) Spike 8% on Thursday early market trading breaking out of a bullish flag pattern.
The asset is currently overbought as seen by the RSI at 83, making it poised for a reversal in the short term. Adding to the bullish thesis, NASDAQ:GOOG is trading above key MA respectively.
In another news, Google parent Alphabet
is planning a “significant increase” in spend next year as it continues to invest in AI infrastructure to meet the demand of its customer backlog, executives said Wednesday.
The company reported its first $100 billion revenue quarter on Wednesday, beating Wall Street’s expectations for Alphabet’s third quarter. Executives then said that the company plans to grow its capital spend for this year.
“With the growth across our business and demand from Cloud customers, we now expect 2025 capital expenditures to be in a range of $91 billion to $93 billion,” the company said in its earnings report.

$GOOG | Alphabet Google | The Everything Tech CompanyAlphabet NASDAQ:GOOG is the everything tech company. Do your future self a favor and get some. Yes, it will crater as soon as you buy it. Your short-term future self will cry and whine and throw a fit and try to panic sell. But your far future self will appreciate it.
Robots? Had backflipping robots years ago
Internet? Been scraping that for decades.
AI? We summoned the great prompter into existence.
Nvidia GPUs? Pshhh... We've got TPUs bruv
Gold teeth? Check.
Performance enhancing drugs? Check the squats broh
You winning son? Close the door dad. I'm busy buying NASDAQ:GOOG
We buyin dips. We buyin corrections. We buyin crashes.
Check the target for our first add level.

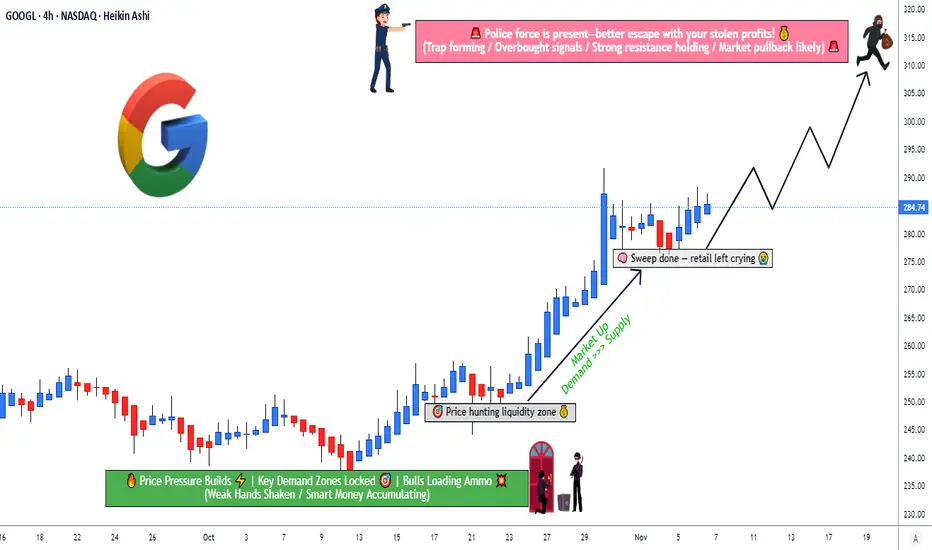
Can GOOGL Sustain Its Bullish Run Before 320 Resistance Hits?🎯 GOOGL HEIST: Operation Alphabet Escape Plan 💰
Alphabet Inc. (NASDAQ) - Swing Trade | Multi-Layer Entry Strategy
📊 THE SETUP
Sentiment: 🟢 BULLISH | Timeframe: Swing Trade | Risk Level: Medium
🎲 ENTRY STRATEGY: "THIEF LAYERING"
Strategic multi-level buy accumulation using limit orders
Layer-by-Layer Approach:
🔵 Layer 1: $270.00 (Initial entry - 30% position)
🔵 Layer 2: $275.00 (Support zone - 35% position)
🔵 Layer 3: $280.00 (Strength builder - 35% position)
Why This Works? Multiple entries reduce average cost basis and allow maximum capital efficiency. If price rejects higher, you've got fills at lower zones. If it pumps, you're already in! 💡
🛑 STOP LOSS PROTECTION
Hard Stop: 🚨 $265.00 (Below support structure)
This represents a 1.9% risk from Layer 1 entry — disciplined risk management at its finest.
⚠️ Risk Acknowledgment: Your stop loss, your rules. We're traders, not financial advisors. Adjust based on YOUR risk tolerance and account size. This is educational strategy sharing, not personalized financial advice.
🎖️ PROFIT TARGETS & ESCAPE ROUTES
Primary Target: 📈 $310.00
Strong resistance zone forming
Overbought conditions developing
Action: Take 50-60% profits here
Secondary Target: 🏆 $320.00
Police barricade zone (extreme resistance)
High trap probability at this level
Action: Scale out remaining 40-50% OR tighten stops to breakeven
Exit Philosophy: Greed kills traders. Take profits systematically. The best trade is one where you sleep well at night. 😴
⚠️ Profit Note: Your targets, your timing. Scale exits based on market conditions, volume confirmation, and YOUR comfort level.
🔗 RELATED PAIRS TO MONITOR (Correlation Watch)
🔵 NASDAQ:MSFT 📱 — High Correlation (Tech Sector) | If MSFT breaks down, GOOGL faces sector headwinds. Watch for divergence signals here first.
🔵 NASDAQ:QQQ 🔺 — 0.85+ Correlation (Nasdaq-100) | QQQ weakness = potential GOOGL pullback signal. This is your sector health check before entry.
🔵 AMEX:IWM 📊 — Inverse Correlation (Rotation Risk) | Russell 2000 strength = growth money leaving mega-caps. If small-caps pump, tech might cool off.
🔵 NASDAQ:TLT 💳 — Interest Rate Proxy | Rising bonds = tech pressure; falling bonds = tech friendly. Fed policy flows directly through here.
🔵 TVC:VIX 😰 — Volatility Index | VIX spike = risk-off, potential GOOGL liquidation. Above 20 = reduce position exposure.
Key Insight: Watch QQQ and MSFT first. They're your canary in the coal mine. If sector is weak, reconsider your entry conviction. 🚨
💎 STRATEGY SUMMARY
✅ Bullish bias with disciplined multi-entry accumulation
✅ Defined risk with hard stop at $265
✅ Staged profit-taking to lock gains systematically
✅ Correlation awareness prevents surprise sector rotations
🎬 FINAL THOUGHTS
Remember: This is the Thief Strategy™ — a fun, educational framework for swing trading, NOT financial advice. Trade at your own risk. Position sizing, stop losses, and profit targets should reflect YOUR unique situation, risk tolerance, and account size.
The heist only works if you ESCAPE with profits. Don't get caught holding the bag! 💼🚪
✨ If you find value in my analysis, a 👍 and 🚀 boost is much appreciated — it helps me share more setups with the community!
#GOOGL #AlphabetInc #SwingTrade #TechAnalysis #TradingStrategy #NASDAQ #TradingIdeas #MultiLayers #RiskManagement #Bullish #ThiefStrategy #TradingCommunity #TradingView #Technical #StockMarket
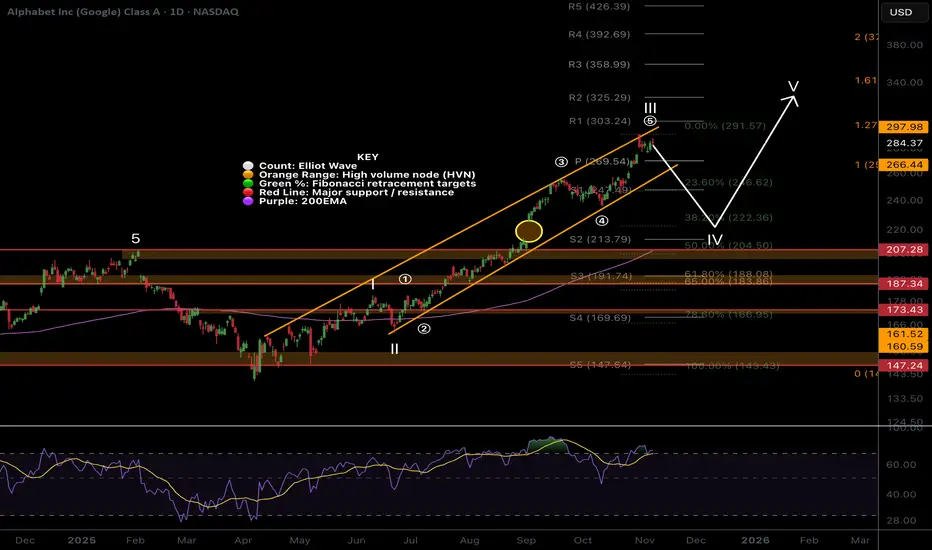
Google pullback still in play, local chartWave III continues but price looks exhausted and may trap late investors causing them to capitulate lower later.
Wave (5) of III is likely to complete with a throw-over of the upper channel boundary. Wave IV has an expected retracement target of the 0.382, $222, filling the gap left and meeting the daily 200EMA.
Daily RSI has printed bearish divergence from overbought.
Continued upside hasa target of the R3 pivot, $358.
Participants in the Global Market: Understanding Who They Are ?1. Central Banks – The Guardians of Monetary Stability
Central banks are the most influential participants in the global market. Institutions like the U.S. Federal Reserve (Fed), European Central Bank (ECB), Bank of England (BoE), and Reserve Bank of India (RBI) control monetary policy in their respective countries. Their decisions directly affect interest rates, inflation, and money supply—all of which have significant implications for global financial flows.
Through tools like open market operations, reserve requirements, and policy rate adjustments, central banks can influence the cost of borrowing and the availability of credit. For example, when the Federal Reserve raises interest rates, global investors may shift funds into U.S. assets, strengthening the dollar and affecting emerging markets.
Moreover, central banks also intervene in foreign exchange markets to stabilize their currency or build reserves, making them active players in the global currency market.
2. Governments – Regulators and Policy Influencers
Governments play a dual role: as regulators of market activity and as participants through borrowing and fiscal policy. Through their finance ministries or treasuries, governments issue bonds to raise funds for public spending and infrastructure projects. These sovereign bonds—like U.S. Treasuries or Indian government securities—are traded globally and are considered benchmarks for risk-free returns.
Government policies also shape investor sentiment. Fiscal measures such as taxation, subsidies, and public spending can influence market trends. For instance, an expansionary fiscal policy can boost domestic demand, leading to stock market rallies, while austerity can have the opposite effect.
Governments also influence global markets through trade policies, tariffs, and international agreements that affect commodity prices and cross-border investments.
3. Institutional Investors – The Powerhouses of Capital
Institutional investors manage large pools of capital and exert enormous influence over global asset prices. This group includes mutual funds, pension funds, insurance companies, hedge funds, and sovereign wealth funds (SWFs).
Mutual Funds invest pooled money from retail investors into diversified portfolios of stocks and bonds. Their large-scale buying and selling affect market liquidity and valuations.
Pension Funds seek stable, long-term returns to meet retirement obligations. They are significant buyers of bonds and blue-chip equities.
Insurance Companies invest premium collections into safe assets to meet future claims, contributing to demand for government and corporate debt.
Hedge Funds, on the other hand, employ aggressive and complex strategies such as short selling, arbitrage, and derivatives trading to maximize returns.
Sovereign Wealth Funds (SWFs), owned by national governments, invest surplus revenues (often from oil or trade surpluses) globally to generate returns and diversify risk. Examples include Norway’s Government Pension Fund and Singapore’s Temasek Holdings.
Together, these institutional investors control trillions of dollars in assets and often set the tone for market movements across borders.
4. Commercial Banks and Financial Institutions
Commercial banks act as the backbone of the financial system, facilitating transactions, providing loans, and managing deposits. In the global market, they serve multiple roles:
Market makers in forex and bond markets, quoting buy and sell prices to ensure liquidity.
Credit providers to corporations and governments through syndicated loans and project financing.
Advisors and underwriters for IPOs, mergers, and acquisitions through their investment banking divisions.
Banks like JPMorgan Chase, HSBC, Citigroup, and Deutsche Bank operate globally, providing cross-border financing, trade settlements, and wealth management services.
Additionally, investment banks help companies raise capital from global investors through stock or bond issuance, connecting capital seekers and providers.
5. Corporations and Multinational Companies (MNCs)
Large corporations are significant participants in global markets, both as issuers of securities and as active players in the currency and commodity markets.
Multinational companies (MNCs) like Apple, Toyota, and Tata Group engage in cross-border production, sales, and investments. They issue corporate bonds to raise funds, buy foreign currencies for international transactions, and use derivatives to hedge against risks like currency fluctuations or commodity price volatility.
Corporate actions such as mergers, acquisitions, and buybacks often impact stock prices and attract institutional and retail investor interest worldwide.
6. Retail Investors – The Expanding Global Force
Retail investors, or individual traders, are becoming increasingly influential due to technology-driven trading platforms and access to global financial markets. Through online brokerages, individuals can trade stocks, forex, ETFs, and cryptocurrencies from anywhere in the world.
In recent years, the rise of social media-driven investment communities (such as Reddit’s WallStreetBets) and zero-commission trading platforms has further increased retail participation. Retail investors bring diversity and liquidity but also contribute to volatility when acting on sentiment rather than fundamentals.
7. Brokers, Dealers, and Market Makers
Brokers and dealers act as intermediaries facilitating trade between buyers and sellers.
Brokers execute trades on behalf of clients and earn commissions.
Dealers trade for their own accounts, profiting from the spread between buying and selling prices.
Market makers ensure continuous liquidity by quoting both buy and sell prices for securities or currencies.
These participants play a crucial role in maintaining efficient markets, ensuring that there are always counterparties available for trades.
8. Exchanges and Clearing Houses
Financial exchanges such as the New York Stock Exchange (NYSE), London Stock Exchange (LSE), Tokyo Stock Exchange (TSE), and National Stock Exchange of India (NSE) provide the infrastructure where buyers and sellers meet.
They ensure transparency, price discovery, and regulation of trading activities. Clearing houses, on the other hand, act as intermediaries that guarantee trade settlement, reducing the risk of counterparty default.
The growth of electronic exchanges and algorithmic trading has made global markets more efficient and interconnected than ever.
9. Commodity Producers and Traders
Commodity markets—covering oil, gold, natural gas, agricultural goods, and metals—have their own participants. Producers, such as oil companies or mining firms, hedge their production against price volatility, while traders speculate or invest in commodity futures for profit.
Major commodity trading firms like Glencore, Trafigura, and Vitol move massive volumes of physical goods and derivatives, influencing global prices and supply chains.
10. Speculators and Arbitrageurs
Speculators provide liquidity by taking on risk in anticipation of future price changes. While often criticized for creating volatility, they play an essential role in balancing market inefficiencies.
Arbitrageurs, on the other hand, seek risk-free profit opportunities by exploiting price differences of the same asset across different markets or instruments. Their activities help align prices globally, ensuring market efficiency.
11. Rating Agencies and Analysts
Institutions like Moody’s, S&P Global, and Fitch Ratings assess the creditworthiness of corporations and governments. Their ratings influence investor decisions and determine the cost of borrowing.
Meanwhile, financial analysts and research firms provide insights, forecasts, and recommendations that shape market sentiment and capital flows.
12. International Financial Institutions
Global organizations such as the International Monetary Fund (IMF), World Bank, and Bank for International Settlements (BIS) play stabilizing roles in the global market.
The IMF provides financial assistance to countries facing balance-of-payments crises.
The World Bank funds development projects in emerging economies.
The BIS coordinates policies among central banks.
Their decisions can influence currencies, interest rates, and capital flows worldwide.
Conclusion
The global financial market is a vast ecosystem sustained by a diverse group of participants—each playing a critical role in its operation. From central banks shaping monetary policy to individual investors trading through mobile apps, every participant contributes to the market’s complexity and dynamism.
Together, these entities create an interconnected web of transactions that determine capital flows, interest rates, and economic stability worldwide. Understanding their interactions not only helps traders and investors navigate markets but also provides valuable insight into how global finance drives growth, innovation, and economic development.
All Priced In - Selling to CommenceFundamentals all baked in with price to sales ratio at previous 2021 post-covid highs will push to profit locking and selling pressure.
NASDAQ:GOOGL price target in the ~$230 range.
RSI weekly divergence and upper log line hit confluence with top fundamental ratios.

GOOG | The Year of Quantum | LONGAlphabet, Inc. is a holding company, which engages in software, health care, transportation, and other technologies. It operates through the following segments: Google Services, Google Cloud, and Other Bets. The Google Services segment includes products and services, such as ads, Android, Chrome, devices, Google Maps, Google Play, Search, and YouTube. The Google Cloud segment refers to infrastructure and platform services, collaboration tools, and other services for enterprise customers. The Other Bets segment relates to the sale of healthcare-related services and internet services. The company was founded by Lawrence E. Page and Sergey Mikhaylovich Brin on October 2, 2015 and is headquartered in Mountain View, CA.

GOOGL Alphabet Options Ahead of EarningsIf you haven`t bought GOOGL before the rally:
Now analyzing the options chain and the chart patterns of GOOGL Alphabet prior to the earnings report this week,
I would consider purchasing the 305usd strike price Calls with
an expiration date of 2026-1-16,
for a premium of approximately $8.30.
If these options prove to be profitable prior to the earnings release, I would sell at least half of them.

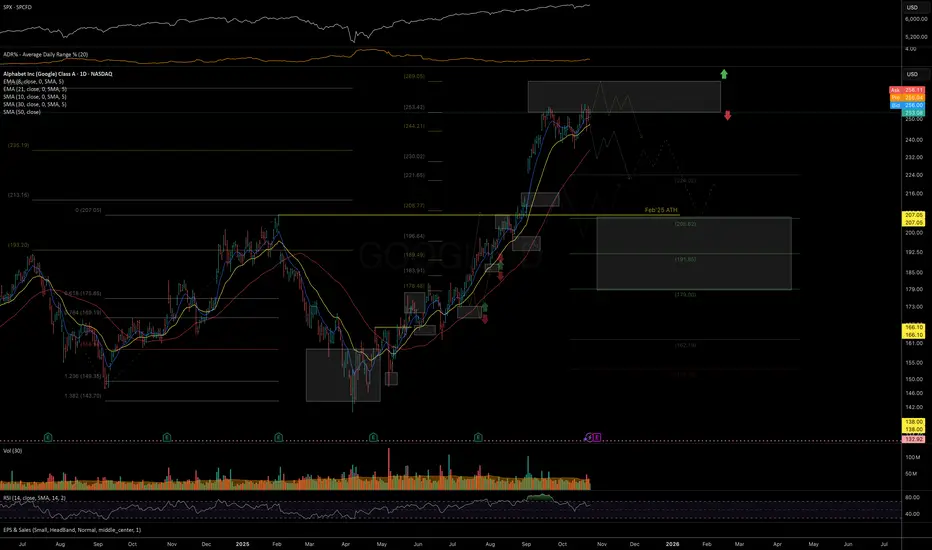
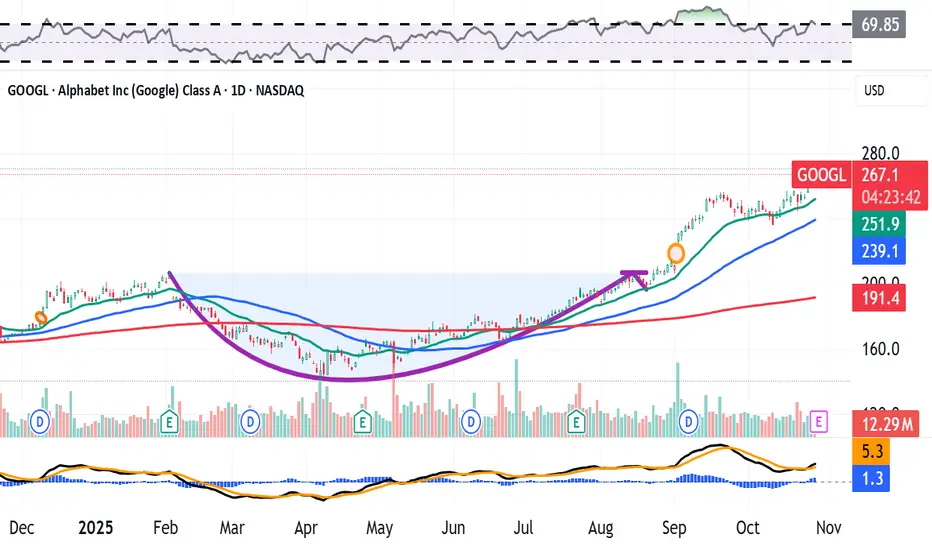
Alphabet Is Up 90% Since April. Here's What Its Chart SaysGoogle parent Alphabet NASDAQ:GOOG NASDAQ:GOOGL is set to report Q3 results this week at a time when the tech giant's stock is trading at or near all-time highs and has risen some 90% since its April lows. The stock has beaten the S&P 500 SP:SPX in virtually every time period from the past one month to the previous five years. What does its chart and fundamental analysis say?
Let's see:
Alphabet's Fundamental Analysis
GOOGL plans to release quarterly numbers after the closing bell on Wednesday, with the Street expecting the firm to report $2.28 of GAAP earnings per share on slightly more than $100 billion of revenue.
If correct, those numbers would compare well with Alphabet's year-ago comps, with GAAP EPS rising 7.5% from Q3 2024's $2.12 and revenue gaining about 13.4% from the $88.3 billion GOOGL that reported 12 months earlier.
Revenue growth like that would be in line with Alphabet's sales trends for years now.
In fact, 28 of the 49 sell-side analysts that I know of that cover GOOGL have revised their earnings estimates higher since the period started. (Fourteen lowered their forecasts and seven have left their numbers unchanged.)
Alphabet's Technical Analysis
Next, let's look at GOOGL's chart going back some 11 months and running through Friday afternoon:
Readers will first note the large, well-defined cup-with-handle pattern that stretched from late January into August, marked with a purple curving line at the chart's center. That pattern provided GOOGL with a breakout in early September from a $106 pivot.
However, Alphabet hit resistance by late September and spent about a month developing a bull-flag pattern of bullish continuance, marked with two purple diagonal lines and a purple box at the chart's right.
This flag has a $256 pivot, which GOOGL broke through in recent days. (The stock closed $269.24 on Monday after hitting a $270.06 all-time intraday high.)
Should Alphabet manage to hold that pivot, then many analysts likely would adjust their price targets considerably higher. But should the pivot fail, GOOGL would next look to its moving averages for support.
The swing crowd would likely come into play at the stock's 21-day Exponential Moving Average (or "EMA," marked with a green line). Meanwhile, portfolio managers would be down around the 50-day Simple Moving Average (or "SMA," marked with a blue line at $236.60 in the chart above) if not forced to chase on momentum.
Looking at the Alphabet's secondary technical indicators, the stock's Relative Strength Index (the gray line at the chart's top) is quite robust, but not yet in a technically overbought state.
At the same time, Alphabet's daily Moving Average Convergence Divergence indicator (or "MACD," marked with black and gold lines and blue bars at the chart's bottom), looks like it might be trying to take on a more bullish posture.
The histogram of the 9-day EMA (the blue bars) has just moved back into positive territory. That's short-term bullish.
Similarly, the 12-day EMA (the black line) has just crossed above the 26-day EMA (the gold line), with both lines above the zero-bound. That, too, is a short- to medium-term bullish technical signal.
An Options Option
Investors exploring options strategies might consider evaluating a "bull-call spread," depending on their market outlook. That's where you buy one call and sell a second one with a higher strike price and the same expiration date.
Here's an example:
-- Buy one GOOGL $262.50 call with an Oct. 31 expiration (i.e., after the earnings come out). This costs about $8.45 at recent prices.
-- Sell (write) one Oct. 31 GOOGL $282.50 call for roughly $2.30.
Net debit: $6.15
The options trader in this example is risking $6.15 to try to make $13.85, for a 225% maximum profit.
If said trader is also interested in taking on equity risk at a discount, the person could also add a put to the above trade. Example:
-- Sell (write) one Oct. 31 GOOGL $252.50 put for about $5.
This would reduce the trader's net debit to $1.15. While this greatly enhances the spread's potential profitability, the trader is exposed to possibly having to purchase 100 GOOGL shares at expiration at $253.65 net basis at a time when the stock would be trading below $252.50.
The maximum theoretical gain would increase to $18.85 x 100 (options multiplier) for a total of $1,885. The maximum theoretical loss would also increase substantially to $25,365, as although unlikely, the stock could potentially fall to zero.
(Moomoo Technologies Inc. Markets Commentator Stephen "Sarge" Guilfoyle was long GOOGL at the time of writing this column.)
This article discusses technical analysis, other approaches, including fundamental analysis, may offer very different views. The examples provided are for illustrative purposes only and are not intended to be reflective of the results you can expect to achieve. Specific security charts used are for illustrative purposes only and are not a recommendation, offer to sell, or a solicitation of an offer to buy any security. Past investment performance does not indicate or guarantee future success. Returns will vary, and all investments carry risks, including loss of principal. This content is also not a research report and is not intended to serve as the basis for any investment decision. The information contained in this article does not purport to be a complete description of the securities, markets, or developments referred to in this material. Moomoo and its affiliates make no representation or warranty as to the article's adequacy, completeness, accuracy or timeliness for any particular purpose of the above content. Furthermore, there is no guarantee that any statements, estimates, price targets, opinions or forecasts provided herein will prove to be correct.
Options trading is risky and not appropriate for everyone. Read the Options Disclosure Document ( j.moomoo.com ) before trading. Options are complex and you may quickly lose the entire investment. Supporting docs for any claims will be furnished upon request.
Options trading subject to eligibility requirements. Strategies available will depend on options level approved.
Maximum potential loss and profit for options are calculated based on the single leg or an entire multi-leg trade remaining intact until expiration with no option contracts being exercised or assigned. These figures do not account for a portion of a multi-leg strategy being changed or removed or the trader assuming a short or long position in the underlying stock at or before expiration. Therefore, it is possible to lose more than the theoretical max loss of a strategy.
Moomoo is a financial information and trading app offered by Moomoo Technologies Inc. In the U.S., investment products and services on Moomoo are offered by Moomoo Financial Inc., Member FINRA/SIPC.
TradingView is an independent third party not affiliated with Moomoo Financial Inc., Moomoo Technologies Inc., or its affiliates. Moomoo Financial Inc. and its affiliates do not endorse, represent or warrant the completeness and accuracy of the data and information available on the TradingView platform and are not responsible for any services provided by the third-party platform.
GOOGL Weekly Outlook (Oct 28–31)GOOGL Weekly Outlook (Oct 28–31): “Google Reclaims the Trend — Can It Hold Above $270?” 🔍
1. Weekly (1W) Structure – Macro Strength Reaffirmed
Alphabet’s weekly structure shows a textbook bullish continuation following a confirmed Break of Structure (BOS) above $207. After a brief Change of Character (CHoCH) pullback toward the $145–$150 demand zone, GOOGL reaccelerated upward, reclaiming control of the ascending channel. The move toward $270 marks a decisive momentum comeback with potential to stretch toward $285–$290 if buyers sustain pressure.
* Bias: Bullish continuation
* Support: $207 → $254
* Resistance: $270 → $285
* MACD: Clean bullish expansion — momentum firmly in buyer hands.
* Stochastic RSI: Hovering near overbought, but trending, not topping — indicative of sustained buying momentum.
💡 Weekly Thought:
As long as GOOGL stays above $254, the broader uptrend remains intact. Macro structure suggests strength continuation into November unless a deep profit-taking correction forms below $250.
2. Daily (1D) – Reclaiming Momentum Zone
Daily chart confirms multiple BOS and CHoCH rotations forming a staircase pattern of higher lows and higher highs. The breakout above $260 confirms a new impulse leg inside the mid-channel zone. Buyers reclaimed $256–$259, an area that previously acted as supply — now flipped into a solid demand base.
* Bias: Bullish trend continuation
* Support: $256 → $240
* Resistance: $270 → $280
* Indicators:
* MACD rebounded into positive territory — bullish crossover confirmed.
* Stochastic RSI climbing from midrange — confirming short-term buying pressure.
💭 Daily Suggestion:
Buyers can look for dip entries near $262–$264 early week. A sustained close above $270 may trigger acceleration toward $280–$285 as gamma and volume momentum expand.
3. 1-Hour (1H) – Intraday Precision Map
GOOGL’s 1-hour chart shows near-perfect alignment with higher timeframes. A clean BOS structure sequence forms above $259 and $265, with the price consolidating near $270 — a key resistance-turned-potential breakout pivot. The current slope of the ascending trendline supports a healthy, controlled climb.
* Scalp Bias: Bullish above $262
* Resistance: $272 → $280
* Support: $259 → $249
* Setup Idea:
* Call scalp: Above $270 breakout; target $275–$280.
* Put scalp: Only if price falls below $259 with volume, target $250.
📈 1H Thought:
Intraday traders should monitor price behavior at $270 — this zone is both a psychological and gamma-based resistance. A breakout with strong volume could ignite an extended move to $280 quickly.
4. GEX & Options Sentiment – Institutional Positioning
Gamma Exposure (GEX) reveals a strong call-dominant structure, with layered resistance near $270–$280 — key short-term gamma magnets.
* Highest positive GEX / resistance: $270 → $275 → $280
* Support (put walls): $250 → $242 → $235
* Call bias: +35.8% (bullish skew)
* IVR: 46.6 (moderately elevated)
* IVx avg: 49.8 (slightly declining → supportive of upside expansion)
Institutions appear positioned to defend $255–$260, while higher strikes near $275 are drawing increasing call exposure. Gamma compression could trigger a grind higher if $270 holds.
5. Suggested Option Plays
* Bullish Setup (Preferred):
* Buy-to-open 270C–275C (1DTE/2DTE) on confirmed hold above $270.
* Target: $280
* Stop: Below $259
* Reason: Strong structural breakout confluence with call gamma reinforcement.
* Bearish Hedge (Cautious):
* Buy 250P (1DTE/2DTE) only if breakdown below $259 with volume confirmation.
* Target: $242
* Stop: Above $265
GOOGL is showing a consistent bullish structure across all timeframes — higher lows, continued BOS patterns, and strong gamma buildup supporting continuation. Price action above $270 can trigger a swift advance toward $280 before potential consolidation.
🎯 Primary Bias: Bullish toward $280–$285
⚠️ Watch For: Failure to hold $259 = momentum loss or short-term correction signal.
This analysis is for educational purposes only and does not constitute financial advice. Always do your own research and manage your risk before trading.
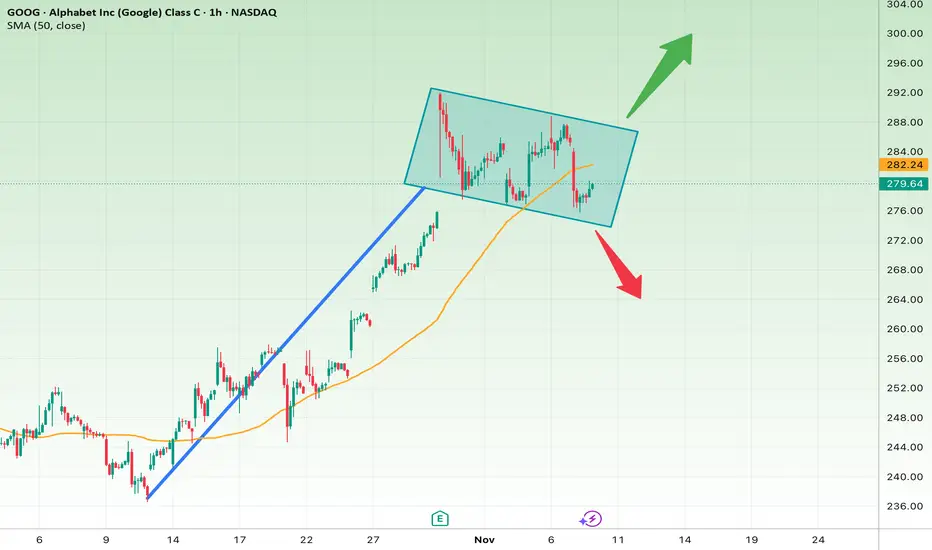
Google at a Critical Decision Point
Short-Term Analysis (1–7 days):
• The stock has entered a neutral channel, currently oscillating between $276 and $288.
• A breakout above the channel’s upper boundary would indicate a continuation of the short-term uptrend.
• Short-term upside target: around $295
• Short-term stop-loss: below $275
Long-Term Analysis (weeks to months):
• The long-term trend remains bullish, with the 50-hour moving average providing support.
• If the neutral channel breaks upward, a strong continuation toward around $310 is possible.
• If it breaks downward, a decline toward $265 is likely.
Summary:
Google stock is in a key decision-making range. Close monitoring is required in the short term, as a breakout from the channel will determine the long-term direction.
High-Frequency Trading (HFT) in Exploiting Time Zone GapsIntroduction
High-Frequency Trading (HFT) has transformed global financial markets by introducing ultra-fast algorithmic strategies that execute thousands of trades in microseconds. With advancements in technology, fiber optics, and low-latency infrastructure, HFT firms continuously search for even the smallest market inefficiencies. One of the lesser-known but increasingly significant strategies in HFT is the exploitation of time zone gaps—leveraging differences in trading hours across global markets to gain arbitrage opportunities.
As global financial systems operate around the clock, markets in Asia, Europe, and North America function in different time zones. This asynchronous operation creates brief windows—known as time zone gaps—where information, price movements, or sentiment from one region can be exploited before it fully reflects in another. HFT algorithms capitalize on these moments to generate profit, often within fractions of a second.
Understanding Time Zone Gaps
Time zone gaps arise because not all markets operate simultaneously. For example:
Asian markets (like Tokyo, Hong Kong, or Singapore) open first.
European markets (like London or Frankfurt) open after Asia closes.
North American markets (like New York or Toronto) open last.
Between these openings and closings, there exist periods of overlap (such as the London-New York overlap) and non-overlap windows, when one region’s market reacts to information while another remains closed. These non-overlap periods create price differentials—temporary inefficiencies in related assets, currencies, or commodities.
For instance, if U.S. stocks close higher due to strong tech earnings, Asian futures or ETFs linked to the same companies might open higher the next morning. HFT systems exploit these predictable movements during the microseconds after Asian markets open, before manual traders can respond.
Mechanism of Exploitation
HFT firms deploy advanced cross-market arbitrage algorithms to identify and act on price discrepancies caused by time zone differences. The process generally follows these steps:
Global Data Synchronization
HFT systems continuously monitor data feeds from exchanges worldwide. They record closing prices, index movements, commodity futures, and currency pairs.
Predictive Modeling
Algorithms use machine learning and statistical models to predict how an asset in one market should move when another related market opens. For example, if the S&P 500 rises by 2% overnight, the Nikkei 225 futures might be expected to rise proportionally.
Latency Arbitrage Execution
The key lies in speed. HFT systems execute trades the instant a market opens—often milliseconds before conventional traders—taking positions in stocks, ETFs, or derivatives that are likely to adjust based on global cues.
Market Neutral Positions
These trades are often market neutral, meaning they do not depend on overall market direction. Instead, they rely on capturing the small, temporary mispricing between two correlated assets across time zones.
Exit Strategy
Once the market adjusts (usually within seconds or minutes), HFT systems exit positions, locking in profits from the price convergence.
Examples of Time Zone Arbitrage
Equity Index Futures
Consider futures contracts on the Nikkei 225 and S&P 500. When the U.S. market closes with a strong rally, HFT systems anticipate that Japanese futures will open higher. They buy Nikkei futures moments before the Tokyo Stock Exchange opens, profiting from the predictable uptick.
Currency Pairs (FX Market)
Although the forex market operates 24/5, liquidity fluctuates with regional business hours. HFTs exploit cross-currency correlations—for example, between USD/JPY and EUR/USD—when one region’s liquidity dries up, creating a slight pricing lag before another market compensates.
Commodity Markets
Oil or gold futures traded in New York often influence Asian commodity prices the next morning. HFT algorithms scan U.S. closing data and place instant orders on Asian commodity exchanges at open, capitalizing on the delayed reaction.
ETF vs. Underlying Asset Arbitrage
Exchange-Traded Funds (ETFs) that track international markets (like “iShares MSCI Japan ETF” listed in New York) can diverge from their underlying asset prices when the foreign market is closed. HFT systems arbitrage these gaps as soon as the foreign market reopens.
Technological Infrastructure Behind HFT
To exploit time zone gaps effectively, HFT firms invest heavily in technology, as speed and precision are critical. Key components include:
Low-Latency Networks: Fiber-optic or microwave communication links that transmit data across continents in milliseconds.
Co-Location Services: Placing servers physically close to exchange data centers to reduce transmission delay.
Predictive Algorithms: AI and machine learning models trained on years of cross-market data to forecast short-term movements.
Real-Time Analytics: Systems capable of processing terabytes of financial data per second for instant decision-making.
Smart Order Routing (SOR): Algorithms that determine the optimal exchange and timing for order execution across markets.
Advantages of Exploiting Time Zone Gaps
Arbitrage Efficiency – Profiting from predictable market reactions without directional risk.
Liquidity Provision – HFT often adds liquidity to markets during low-volume periods.
Price Discovery – By quickly integrating global information, HFT helps align asset prices across time zones.
Diversification of Opportunities – Allows firms to operate continuously, taking advantage of 24-hour trading across the globe.
Challenges and Risks
While profitable, exploiting time zone gaps comes with significant risks and operational hurdles:
Technological Costs
The infrastructure required for global, low-latency trading is extremely expensive. Only large institutions can afford these systems.
Regulatory Scrutiny
Different regions have different trading regulations. Ensuring compliance across jurisdictions (e.g., the U.S. SEC vs. Japan’s FSA) is complex and risky.
Market Fragmentation
Data synchronization across multiple time zones can lead to inaccuracies due to latency or bandwidth issues, resulting in potential trading losses.
Competition
As more HFTs target the same inefficiencies, profit margins shrink rapidly. The competition becomes a “race to zero” in terms of latency.
Flash Crashes and Instability
Rapid algorithmic trading across interconnected markets can amplify volatility. A shock in one market can instantly ripple across others, causing flash crashes.
Regulatory and Ethical Considerations
Global regulators have expressed concern that exploiting time zone gaps might create unfair advantages for technologically advanced firms. Critics argue that HFTs manipulate speed rather than true economic value. To address this, some exchanges have introduced speed bumps or randomized order delays to reduce the impact of latency-based strategies.
Moreover, cross-border coordination is limited. Without harmonized regulation, firms can operate in regulatory “gray zones,” exploiting markets with weaker oversight. This has led to ongoing debates about transparency, fairness, and market stability.
The Future of HFT in Global Time Zone Trading
The evolution of global markets suggests that HFT will continue to refine time zone gap strategies. Key future trends include:
AI-Powered Prediction Models: Advanced neural networks will better anticipate inter-market reactions, making time zone exploitation even more precise.
Quantum Computing: Future breakthroughs in computational speed could make latency arbitrage almost instantaneous.
24/7 Trading Models: As more markets (like cryptocurrencies) adopt round-the-clock trading, traditional time zone gaps may shrink, pushing HFTs to adapt.
Regulatory Convergence: International cooperation could create unified frameworks, balancing innovation with market integrity.
Conclusion
High-Frequency Trading’s ability to exploit time zone gaps showcases how technology, data, and speed converge in modern finance. By leveraging global time differences, HFT firms transform tiny inefficiencies into consistent profits. While such strategies enhance liquidity and price discovery, they also raise concerns about market fairness, systemic risk, and unequal access to technology.
In essence, exploiting time zone gaps represents both the brilliance and the fragility of today’s interconnected markets—a reflection of how milliseconds can define success in a 24-hour global trading ecosystem.
$GOOGL with a bullish outlook following its earnings #StocksThe PEAD projected a bullish outlook for NASDAQ:GOOGL after a positive over reaction following its earnings release placing the stock in drift A with an expected accuracy of 78.95%.

GOOGL Bullish Continuation: Breakout Retest Toward 300Hello, traders! GOOGL on the 1D chart remains in a dominant uptrend after a clean breakout from its September–October range. Price is pressing near highs, with momentum and breadth consistent with a bull flag resolution. The prior Resistance at $255.50 marked the top of that range; the breakout above it signals continuation. First key support sits near $230.00, which flipped from resistance earlier and aligns with the trend structure.
Primary path: look for a constructive pullback into the breakout zone at $276–$281 to hold, then continuation toward the psychological $300 handle and, if momentum persists, the $305–$310 zone. Breakout traders can also use a daily close above the recent high at $291.59 as confirmation; a stronger trigger is a daily close > $292.00 on firm volume. If buyers fail to defend the near-term structure, a decisive close back below $253.00 would invalidate the bullish view; tighter risk managers can use a close below $276.00 as the line in the sand.
This is a directional study with tactical levels, not a signal. Manage position size and stops according to your plan. This is a study, not financial advice. Manage risk and invalidations

Is Google Entering Distribution? (GOOG, GOOGL Analysis)⚡ Overview
Recently, the charts of all major tech giants — Apple, Amazon, Google, Meta, and Microsoft — have started to look almost identical.
Each of them seems to be either topping out or entering what looks like a distribution phase.
In this post, I’ll share my technical and fundamental outlook on Google (GOOG, GOOGL), along with the key risks and price zones I’m watching as a trader.
💡 Fundamental View
From a fundamental perspective, Google still looks strong:
The P/E ratio has been growing steadily.
Revenue continues to rise.
The company has been aggressively buying back shares for years.
So fundamentally, this is not a bubble.
By Peter Lynch’s fair value formula, Google remains fairly valued, maybe even with a modest upside left.
However, strong fundamentals don’t always mean big growth ahead — especially when the market has already priced in perfection.
And that’s typically when the distribution phase begins.
📈 Technical View
According to Elliott Wave Theory, Google seems to be completing the fifth sub-wave within a larger third wave —
a structure that often marks the final stage before a distribution or correction phase.
On the long-term chart, price is now approaching the upper boundary of the rising channel,
with limited upside potential — possibly up to $430–$450, which represents the top zone.
Beyond that, the probability of continued growth drops sharply, while correction risk increases significantly.
⚙️ Market Structure
When analyzing the volume profile, the largest accumulation zone sits around $15 – $16 —
that’s where long-term investors entered 15 years ago.
Those early buyers are now sitting on massive unrealized profits,
and many are gradually distributing (selling) positions into current strength.
Meanwhile, retail traders often see the ongoing move as “more upside ahead.”
But in reality, this could be the final buying climax before a deeper correction.
🧩 Cycle Context
Interestingly, the same pattern is visible across Apple, Meta, Amazon, and Microsoft.
It’s not just about one stock — the entire Big Tech segment appears to be entering a similar maturity stage of the cycle.
That’s why I believe Google could soon transition from markup to distribution,
followed by a potential multi-quarter sideways or corrective phase.
💬 What’s your take? Do you think Google will reach $400 before correcting — or has the top already formed?
👇 Share your view in the comments.
Is This the Perfect Entry Zone for the Next GOOGL Upside Run?🎯 GOOGL: The "Thief's Heist" Trading Strategy | Layered Entry Playbook 📊
💼 Asset: ALPHABET INC. (GOOGL)
Market: NASDAQ | Style: Swing/Day Trade Hybrid
🎭 The Setup: Bulls Running the Show
Bias: 🟢 BULLISH
Listen up, trading family! 👋 GOOGL is setting up what I call the "Thief's Entry Strategy" - a layered approach that lets you accumulate positions like a professional poker player stacking chips. No FOMO, no chasing - just calculated, methodical entries that would make Ocean's Eleven jealous. 🎰
🚪 Entry Strategy: The "Thief Layering" Method
Instead of going all-in at one price (rookie move 🙅♂️), we're using multiple limit orders to build our position:
📍 Layered Buy Limits:
Layer 1: $240.00
Layer 2: $245.00
Layer 3: $250.00
💡 Pro Tip: You can add more layers or adjust levels based on your risk appetite and account size. This method reduces average cost and minimizes timing risk - basically, you're stealing better prices while everyone else panic-buys at the top! 😎
Alternative: If you prefer simplicity, current market price entry works too - but where's the fun in that? 🤷♂️
🛡️ Risk Management: The "Escape Route"
Stop Loss: $235.00
⚠️ Reality Check: Dear Thief OG's (Original Gangsters of Trading), this is MY stop loss level based on technical structure. YOU need to assess your own risk tolerance, position size, and account management rules. Your money = your rules. Trade at your own risk, always! 🎲
🎯 Target Zone: The "Electric Fence"
Take Profit: $275.00
This level represents a confluence of:
⚡ Strong resistance zone (high voltage wall!)
📈 Potential overbought conditions
Bull trap territory where late buyers get caught
Strategy: Scale out as we approach target. Don't be greedy - banks get robbed, but smart thieves get away clean! 💰
⚠️ Reality Check #2: This is MY target. You might want to take profits earlier, hold for more, or scale out in portions. Your trading plan, your decision. Secure the bag at your own discretion! 💼
🔗 Related Pairs to Watch (Correlation Play)
Keep your eyes on these tech titans - they often move in sympathy:
NASDAQ:MSFT - Microsoft Corp | Big tech correlation, AI play
NASDAQ:AAPL - Apple Inc. | FAANG/tech sector leader
NASDAQ:META - Meta Platforms | Ad revenue correlation with GOOGL
NASDAQ:NVDA - NVIDIA | AI infrastructure play
NASDAQ:QQQ - Nasdaq 100 ETF | Overall tech sector health indicator
Why it matters: If these pairs show weakness, GOOGL might follow. If they're pumping, wind's at our back! 🌊
📊 Key Technical Points
✅ Support holding at current structure
✅ Bullish momentum building on lower timeframes
✅ Risk-reward ratio favorable with layered entries
✅ Volume profile suggesting accumulation phase
🎬 The "Thief Style" Philosophy
This isn't financial advice - it's a trading game plan based on technical analysis and strategic positioning. The "Thief" approach means:
Stealth entries (layering in)
🧠 Smart exits (not overstaying the party)
🎯 Calculated risk (always know your out)
🎪 Having fun while staying professional
📉 Trading involves substantial risk of loss and is not suitable for everyone. Past performance is not indicative of future results.
✨ If you find value in my analysis, a 👍 and 🚀 boost is much appreciated — it helps me share more setups with the community!
🏷️ Tags:
#GOOGL #Alphabet #StockMarket #SwingTrading #DayTrading #TradingStrategy #TechnicalAnalysis #StockAnalysis #NASDAQ #TechStocks #LayeredEntry #RiskManagement #TradingIdeas #PriceAction #SupportAndResistance #ThiefStrategy #FAANG
Trade smart, stay safe, and remember: the market doesn't care about your feelings - only your strategy matters! 🎯💪
Long $GOOGL, Too much pessimism priced in!- NASDAQ:GOOGL is one of the hated FAANG often get hit in the crossfire of misinformation campaign be it Ads related or Search related.
- NASDAQ:GOOGL is a verb and has lot of things going in favour. Leader in Quantum Computing, Healthy Growth in Cloud Services, Leader in Adtech, De-facto standard for Searches.
- Gemini is a decent LLM and I am seeing diversification of LLMs in the industry.
- Waymo is leader in autonomous vehicles.
- Google has invested in the future like SpaceX which could easily multiply its investment.
Fundamentally,
Year | 2025 | 2026 | 2027 | 2028
EPS | 9.54 | 10.18 | 11.71 | 13.21
EPS% | 18.93% | 6.71% | 15.10% | 12.81%
Base Case (Forward p/e ~ 20 )
Year | 2025 | 2026 | 2027 | 2028
Stock Price | $190 | $203 | $234 | $264
Bear Case ( Forward p/e ~ 15 )
Year | 2025 | 2026 | 2027 | 2028
Stock Price | $143 | $152 | $175 | $198
Bull Case ( Forward p/e ~ 25 )
Year | 2025 | 2026 | 2027 | 2028
Stock Price | $238 | $254 | $292 | $330
Comfortable buying NASDAQ:GOOGL < 160 and targeting $210-220 in 1-1.5 year timeframe.

Google Wave Analysis – 24 October 2025- Google broke key resistance level 255.00
- Likely to rise to resistance level 270.00
Google broke above the key resistance level 255.00 (which stopped the previous impulse waves 3 and i, as can be seen from the daily Google chart below).
The breakout of the resistance level 255.00 accelerated the active minor impulse wave 5 of the daily impulse sequence (1) from April.
Given the strong daily uptrend, Google currency pair can be expected to rise to the next resistance level 270.00 (target price for the completion of the active impulse wave iii).
GOOGL: price at important resistance zonePrice has been following the outlined structure from the July and August updates, showing the expected relative outperformance versus SPX. However, instead of forming a prolonged Autumn consolidation, price moved almost directly to the target resistance zone for the uptrend since the April bottom: 250–270.
While one more short-term push toward the top of the resistance zone is possible, as long as price remains below 270, I am watching for rising selling pressure and a potential durable consolidation to develop in the coming weeks. If price manages to post a sustained breakout above 270, the current structural view would need to be reassessed.
Caution is advised with any new long exposure at these levels, and consider protecting open long positions in case of a reversal or broader market weakness.
Chart:
Previously:
• On resistance and potential consolidation (Aug 29):
Chart:
Link: www.tradingview.com
• On local support (Aug 11):
Chart:
Link: www.tradingview.com
• On upside potential & relative strength vs SPX (Aug 5):
Link: www.tradingview.com
• On breakout setup (Jul 13):
Chart:
Link: www.tradingview.com