Reading volume flow: $38 billion real-time example 🎤 Testing testing. 1 million, 2 million, 3 million...
That's how much volume is flowing into Bitcoin ETF (IBIT). If you multiply it a dozen thousand times. Last week we saw highest ever recorded volume on Bitcoin ETF. It's about two to three times more than the typical weekly volume.
Here's IBIT o
Key stats
About iShares Bitcoin Trust ETF
Home page
Inception date
Jan 5, 2024
Structure
Grantor Trust
Replication method
Physical
Dividend treatment
Capitalizes
Distribution tax treatment
Ordinary income
Income tax type
Capital Gains
Max ST capital gains rate
39.60%
Max LT capital gains rate
39.60%
Primary advisor
BlackRock Fund Advisors
Identifiers
3
ISIN US46438F1012
IBIT aims to track the spot price of Bitcoin, less expenses and liabilities. It intends to provide accessibility to Bitcoin without the complexities of acquiring, holding, and trading directly through a digital asset platform. The trust is backed by Bitcoin held in cold storage, which is a safeguarding method by which the private keys corresponding to the trusts Bitcoins are generated and stored in an offline manner, making them more resistant to hacking. Holdings are valued daily based on the CF Benchmarks Index. This serves as a once-a-day benchmark rate of Bitcoins USD price, calculated as of 4:00 pm ET. The index aggregates the trade flow of several Bitcoin platforms during an observation window, focusing on relevant transactions, as defined by the index provider. At the time of launch, the Issuer waived a portion of the fee. The funds expense ratio and tracking should be reviewed and considered for comparison purposes.
Related funds
Classification
Symbol
Geography
Global

IBIT FEB - 2026IBIT broke down from the 52 supply area after repeated rejections and a clear shift from acceptance to distribution above 50. The selloff accelerated into the 43–45 zone, which failed to hold, leaving price pressing into the rising demand/trend support around 39–38. The current reaction suggests sho

Opening (IRA): IBIT March 20th -34P... for a 1.57 credit.
Comments: Adding at intervals at strikes better than what I have on, targeting the 25 delta strike.
Metrics:
Max Profit: 1.57 ($157)
Buying Power Effect: 32.43
ROC at Max: 4.84%
Will generally look to start taking profit at 50% max or take assignment and sell call against

$IBIT Trading Gaps Mostly Filled - Open Gaps Higher UpI've been tracking the 4-Hour chart of the Black Rock I bit since Inception and noticed that 95% of the gaps fill similar to the CME gaps.
We can see two open gaps above in the 53 dollar range and the $45 range as unfilled.
And today we just broke through below $40 feeling a gap from November of 2


Ha! It gets even better.What do you guys like to do for fun?
I have a few things I’m fond of , snowboarding is great.
$£€¥ +++
NASDAQ:IBIT

IBIT - Predictive ForecastingThis will be predictive graph theory idea given my last post remains valid. Will link it below.
If buyers continue to hold this $40-42 level as macro support then we expect IBIT to rally as much as 50% towards a $60-62 target!
If/When IBIT is able to complete this move, then we can predict seller
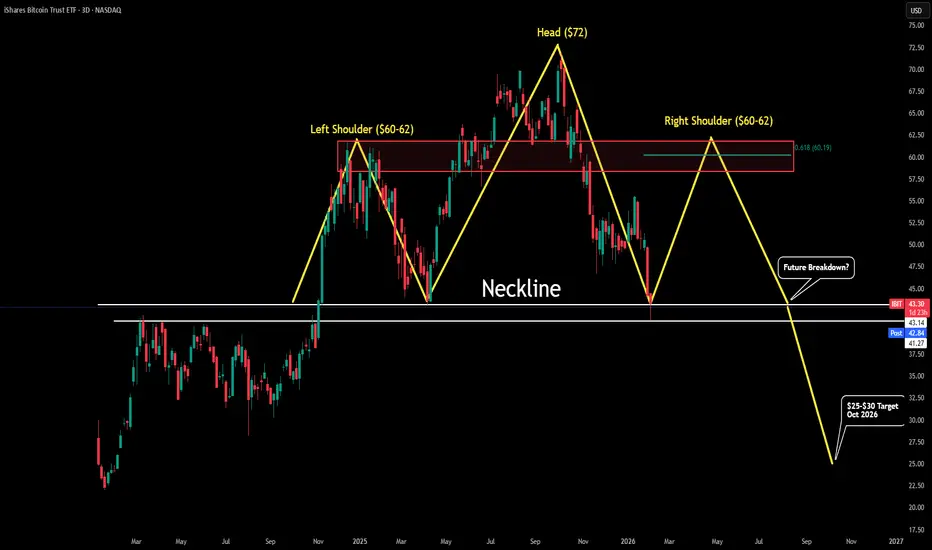
IBIT - Looking Primed for UpsideWith BTC's recent collapse, it has put IBIT in the perfect spot for market structure. Price just retested macro old resistance (red arrows) as new macro support (green arrows).
This also happened to be right in line with the 0.618 of the range low to range high! In addition to even that, the 3D RSI

Opening (IRA): IBIT March 20th -43P... for a 1.30 credit.
Comments: Adding at intervals at strikes/break evens better than what I currently have on.
Metrics:
Max Profit: 1.30 ($130)
Buying Power Effect: 41.70
ROC at Max: 3.12%
Will generally look to take profit starting at 50% max or take assignment of shares and sell call again

Opening (IRA): IBIT March 20th -46P... for a 1.42 credit.
Comments: Adding/laddering out at intervals at the 25 delta strike, assuming I can get in at break evens/strikes better than what I currently have on.
Metrics:
Max Profit: 1.42 ($142)
BPE: 44.58
ROC at Max: 3.19%
Will generally start to look to take profit at 50% max/roll

See all ideas
Summarizing what the indicators are suggesting.
Oscillators
Neutral
SellBuy
Strong sellStrong buy
Strong sellSellNeutralBuyStrong buy
Oscillators
Neutral
SellBuy
Strong sellStrong buy
Strong sellSellNeutralBuyStrong buy
Summary
Neutral
SellBuy
Strong sellStrong buy
Strong sellSellNeutralBuyStrong buy
Summary
Neutral
SellBuy
Strong sellStrong buy
Strong sellSellNeutralBuyStrong buy
Summary
Neutral
SellBuy
Strong sellStrong buy
Strong sellSellNeutralBuyStrong buy
Moving Averages
Neutral
SellBuy
Strong sellStrong buy
Strong sellSellNeutralBuyStrong buy
Moving Averages
Neutral
SellBuy
Strong sellStrong buy
Strong sellSellNeutralBuyStrong buy
Displays a symbol's price movements over previous years to identify recurring trends.
Frequently Asked Questions
An exchange-traded fund (ETF) is a collection of assets (stocks, bonds, commodities, etc.) that track an underlying index and can be bought on an exchange like individual stocks.
IBIT trades at 39.30 USD today, its price has risen 4.80% in the past 24 hours. Track more dynamics on IBIT price chart.
IBIT net asset value is 39.01 today — it's fallen 24.92% over the past month. NAV represents the total value of the fund's assets less liabilities and serves as a gauge of the fund's performance.
IBIT assets under management is 49.92 B USD. AUM is an important metric as it reflects the fund's size and can serve as a gauge of how successful the fund is in attracting investors, which, in its turn, can influence decision-making.
IBIT price has fallen by −28.62% over the last month, and its yearly performance shows a −28.02% decrease. See more dynamics on IBIT price chart.
NAV returns, another gauge of an ETF dynamics, have fallen by −24.92% over the last month, showed a −32.32% decrease in three-month performance and has decreased by −28.57% in a year.
NAV returns, another gauge of an ETF dynamics, have fallen by −24.92% over the last month, showed a −32.32% decrease in three-month performance and has decreased by −28.57% in a year.
IBIT fund flows account for 69.68 B USD (1 year). Many traders use this metric to get insight into investors' sentiment and evaluate whether it's time to buy or sell the fund.
Since ETFs work like an individual stock, they can be bought and sold on exchanges (e.g. NASDAQ, NYSE, EURONEXT). As it happens with stocks, you need to select a brokerage to access trading. Explore our list of available brokers to find the one to help execute your strategies. Don't forget to do your research before getting to trading. Explore ETFs metrics in our ETF screener to find a reliable opportunity.
IBIT expense ratio is 0.25%. It's an important metric for helping traders understand the fund's operating costs relative to assets and how expensive it would be to hold the fund.
No, IBIT isn't leveraged, meaning it doesn't use borrowings or financial derivatives to magnify the performance of the underlying assets or index it follows.
In some ways, ETFs are safe investments, but in a broader sense, they're not safer than any other asset, so it's crucial to analyze a fund before investing. But if your research gives a vague answer, you can always refer to technical analysis.
Today, IBIT technical analysis shows the sell rating and its 1-week rating is sell. Since market conditions are prone to changes, it's worth looking a bit further into the future — according to the 1-month rating IBIT shows the strong sell signal. See more of IBIT technicals for a more comprehensive analysis.
Today, IBIT technical analysis shows the sell rating and its 1-week rating is sell. Since market conditions are prone to changes, it's worth looking a bit further into the future — according to the 1-month rating IBIT shows the strong sell signal. See more of IBIT technicals for a more comprehensive analysis.
No, IBIT doesn't pay dividends to its holders.
IBIT trades at a premium (0.75%).
Premium/discount to NAV expresses the difference between the ETF’s price and its NAV value. A positive percentage indicates a premium, meaning the ETF trades at a higher price than the calculated NAV. Conversely, a negative percentage indicates a discount, suggesting the ETF trades at a lower price than NAV.
Premium/discount to NAV expresses the difference between the ETF’s price and its NAV value. A positive percentage indicates a premium, meaning the ETF trades at a higher price than the calculated NAV. Conversely, a negative percentage indicates a discount, suggesting the ETF trades at a lower price than NAV.
IBIT shares are issued by BlackRock, Inc.
IBIT follows the CME CF Bitcoin Reference Rate - New York Variant - Benchmark Price Return. ETFs usually track some benchmark seeking to replicate its performance and guide asset selection and objectives.
The fund started trading on Jan 5, 2024.
The fund's management style is passive, meaning it's aiming to replicate the performance of the underlying index by holding assets in the same proportions as the index. The goal is to match the index's returns.