Opening (IRA): IBIT January 16th -50P... for a 2.24 credit.
Comments: Laddering out at intervals, assuming I can get in at strikes/break evens better than what I currently have on. Here, targeting the 25 delta strike.
Metrics:
Max Profit: 2.24 ($224)
Buying Power Effect: 47.76
ROC at Max: 4.69%
Will generally look to start taking profit at 50% max.
Trade ideas

IBIT vs GOLD. BIGGER RISK ≠ NOT EQUAL BIGGER PROFITS.This publication is a simple comparision of two assets:
iShares Bitcoin Trust ETF NASDAQ:IBIT that has been launched (among many others) in Jan. 2024
Gold spot OANDA:XAUUSD as itself.
Returns over the nearly past two years you can see by yourself. Bigger risk (+ left-and-right + back-and-forth volatility) are not equal bigger profits.
Gold wins in this given time, with much lower risk-profile scorings.
Technically saying about IBIT (which RSI readings is nearly 30 points), we would prefer to wait a new one divergence with RSI(14) readings like it has happened twice before.
I.e. Lower low for NASDAQ:IBIT asset, that lead to higher low for RSI.

iShares Bitcoin Trust (IBIT) Technical AnalysisThe iShares Bitcoin Trust (IBIT) is testing the critical support level of the medium-term rising channel it has maintained since the fourth quarter of 2024. The pullback that began from the channel upper band resistance seen in September/October 2025 (around the $65.00 region) has brought the price to the main trend support (around $53.50 - $54.00). Although indicators (MACD, RSI) point to a weakening of short-term momentum, the main trend structure remains intact. The upcoming sessions will be crucial for maintaining the medium-term trend's continuity.
Base Scenario (Positive) : The price is expected to rebound from the current support band of $53.50 - $54.00 and break above the short-term falling wedge resistance (around $57.00). In this scenario, the first target will be the middle band of the channel, followed by the $65.00 - $66.00 region where previous peaks are located.
Alternative Scenario (Negative) : A high-volume daily close below the main rising channel support (53.50$) would signal a significant breakdown in the medium-term trend structure. In this case, selling pressure could accelerate, and the next major support areas at 46.00$ and 40.00$ could be tested.
Conclusion and Strategy
The IBIT ETF is at a critical support point that will determine the fate of its medium-term trend. Although indicators point to short-term weakness, we maintain our cautiously optimistic view as long as the main trend structure remains intact. The $53.50 level is considered a "key level" (pivot level) that should be closely monitored for risk management and trend continuity.

IBIT longI spotted accumulation near $60.
Price surged up to $70 right in our distribution zone.
Last time it corrected from the distribution zone that is our current accumulation zone it
corrected 28%.
We are now 21% into a correction and firmly in the accumulation zone.
A risk remains for another 28% drop, targeting around $51.

IBIT NOV-2025IBIT is consolidating between 56–68 (BTC ≈95K–110K), with buyers defending the main order zone near 58–60 (BTC ≈100K) after strong distribution around 70 (BTC ≈125K). The closed gap at 50 (BTC ≈85K) now acts as a neutral pivot, while the open gap in the 40s (BTC ≈70K–75K, ≈7.2B orders) remains a pending liquidity target if 56 breaks. A sustained move above 65 (BTC ≈115K) could confirm continuation toward 70 (BTC ≈125K); losing 56 (BTC ≈95K) would expose 45–40 (BTC ≈70K–75K) as the next institutional absorption zone.
Target ↑: 70 (BTC ≈125K)
Target ↓: 45–40 (BTC ≈70K–75K)
#IBIT #BTC #globaltrade #investment #investing #stockmarket #wealth #realestate #markets #economy #finance #money #forex #trading #price #business #currency #blockchain #crypto #cryptocurrency #airdrop #ethereum #ico #altcoin #cryptonews #Bitcoin #ipo

IBIT DISTRIBUTION - 2025Price is trading inside an institutional distribution zone under the $70 resistance. If the institutional support at $56–68 fails, the distribution phase would end, opening the way toward the lower 40s. The $65 gap remains a short-term pivot.
Upside target: $75 if $70 is reclaimed with strength.
Downside target: $45 gap fill and potential extension to low 40s if $56 breaks.
#IBIT #globaltrade #investment #investing #stockmarket #wealth #realestate #markets #economy #finance #money #forex #trading #price #business #currency #blockchain #crypto #cryptocurrency #airdrop #btc #ethereum #ico #altcoin #cryptonews #Bitcoin #ipo

Nov 3: Bitcoin bottomed, off to ATHBitcoin bottomed today with a double retest of the 200 MA. The correction was actually shalllow as it corrected around the previous resistance/support area - it corrected in time, not in price.
The NASDAQ:IBIT chart looks cleaner with a bullish pin bar at the 200 MA. I think the whole market will start to rally, with breadth improving from now on.

$BIT (WEEKLY): BEAR RSI & OBV divergences, CORRECTIONNASDAQ:IBIT and CRYPTOCAP:BTC on the WEEKLY should normally be almost identical charts, as the #BlackRock Bitcoin ETF follows the token's price closely, yet there are some very interesting differences.
#IBIT had a clean BEAR RSI divergence before the 10 OCT collapse, while Bitcoin's WEEKLY chart did not. That would have been useful to know, looking back.
Another clear sign pre-collapse was flashing on BLACKROCK'S weekly chart in OBV — again, a BEAR divergence. Not on the BTC chart, once more.
And the last huge difference is in the VOLUME profiles — IBIT's red bars have been much stronger and more towering than the ones on the KING crypto's chart.
The differences between the charts can be easily explained by the notion that share prices, even though they do follow BTC’s price, also have an added effect of institutional confidence — that extra inflow/outflow balance that the regular BTC chart doesn’t show.
And since this cycle is purely institutional, the IBIT (805 thousand BTC held by the #etf ) chart can be extremely helpful when trading BTC.
At the moment, it only adds to the bearish case, sadly. 💙👽

Opening (IRA): IBIT December 19th -56P... for a 1.67 credit.
Comments: A starter position at around the 25 delta strike. Will look to add at intervals, assuming I can get in at strikes better than what I currently have on.
Metrics:
Max Profit: 1.67 ($167)
Buying Power Effect: 54.33
ROC at Max: 3.07%

Opening (IRA): IBIT December 19th -52P... for a 2.24 credit.
Comments: High IVR/IV. Adding at strikes/break evens better than what I currently have on. Using a Plain Jane 20-ish delta short put here.

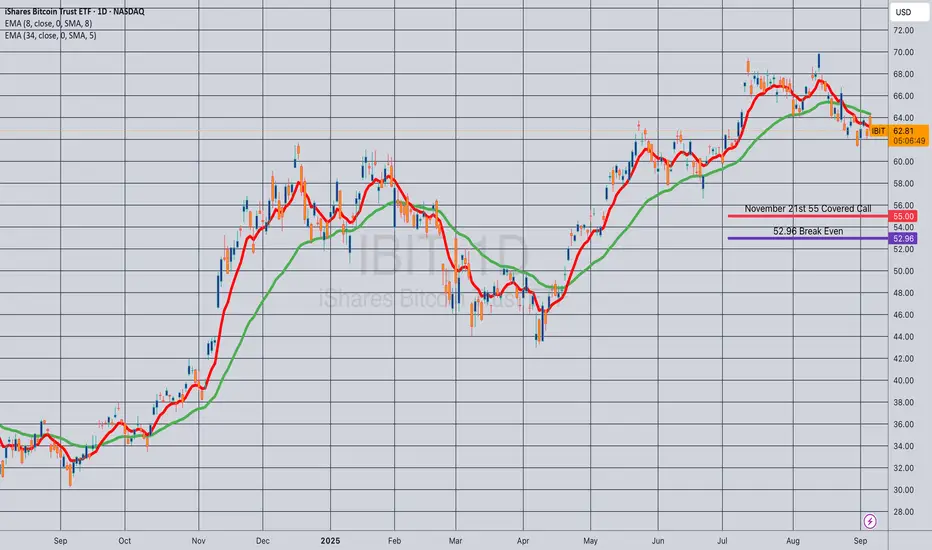
Opening (IRA): IBIT November 21st 55 Monied Covered Call... for a 52.96 debit.
Comments: Slowly building a position. Would've preferred a down day, but can't have everything. Selling the -75 delta call against shares to emulate the delta metrics of a 25 delta short put, but with the built-in defense of the short call and to take advantage of higher call side IV.
Metrics:
Buying Power Effect/Break Even: 52.96
Max Profit: 2.04 ($204)
ROC at Max: 3.85%
50% Max: 1.02 ($102)
ROC at 50% Max: 1.93%
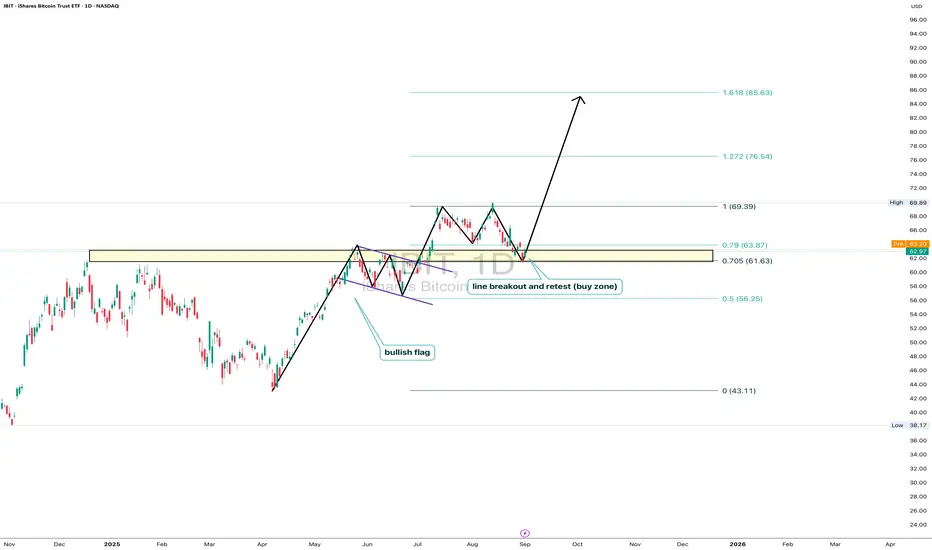
IBIT: ready for liftoffOn the daily chart, iShares Bitcoin Trust (IBIT) trades at $62.97, testing the key 0.705–0.79 Fibo zone ($61.63–63.87). This area marks a breakout and retest line, forming a clear buy zone. The technical structure remains bullish: after breaking out and pulling back, price holds potential to move toward $69.39, with Fibo extensions targeting $76.54 and $85.63. Volumes confirm buyer activity on dips, and the bullish flag pattern supports the continuation of the upward trend.
Fundamentally , the main driver is bitcoin itself, with institutional demand for BTC ETFs staying strong. Large funds continue accumulating positions, while expectations of a softer Fed tone add pressure on the dollar, fueling capital inflows into crypto. This strengthens the bullish case for IBIT.
Tactical plan: watch $61.6–63.8 as the key entry zone. Holding above opens the path toward $69.3, followed by $76.5 and $85.6. The scenario breaks only if price falls below $61.
And let’s be honest: IBIT isn’t just a ticker - it’s the “accelerate bitcoin” button for your portfolio.
IBIT trying to goNASDAQ:IBIT trying to go again today along with $BTC. There was a massive CRYPTOCAP:BTC washout on 10/10. Could be the real move here.
The key is whether it can rise above 67.21
Hello, traders. Nice to meet you.
By "Following," you can always get the latest information quickly.
Have a nice day today.
-------------------------------------
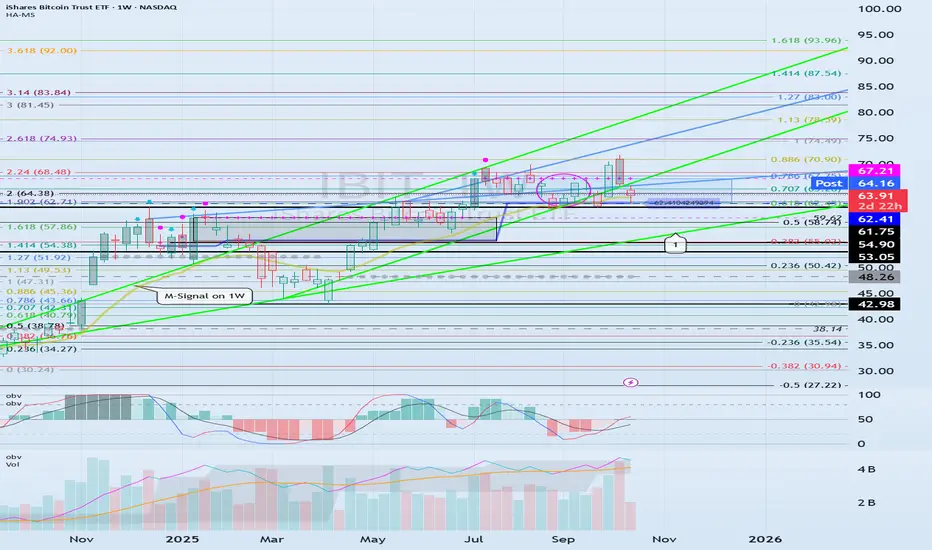
(IBIT 1W Chart)
Since the chart was created recently, the M-Signal indicator for the 1M chart is missing.
However, the HA-High and DOM (60) indicators indicate a stepwise upward trend.
The key question is whether the price can maintain its upward momentum above the HA-High ~ DOM (60) range of 62.41-67.21.
If it falls below 62.41, it is likely to touch the uptrend line (1) and re-establish the trend.
At this point, the key support and resistance levels are 53.05-54.90.
We need to check for support near this 53.05-54.90 range.
If it rises above 67.21, the target levels are:
1st: 74.93
2nd: 93.96
The target levels are expected to be around the first and second levels above.
--------------------------------------------------------
Because BTC is linked to the stock market and is being linked to it, it is highly likely to be affected by stock market movements.
However, it is always advisable to check the fund flow in the coin market first, as the coin market itself can exhibit price defense.
-
Thank you for reading to the end.
I wish you successful trading.
--------------------------------------------------
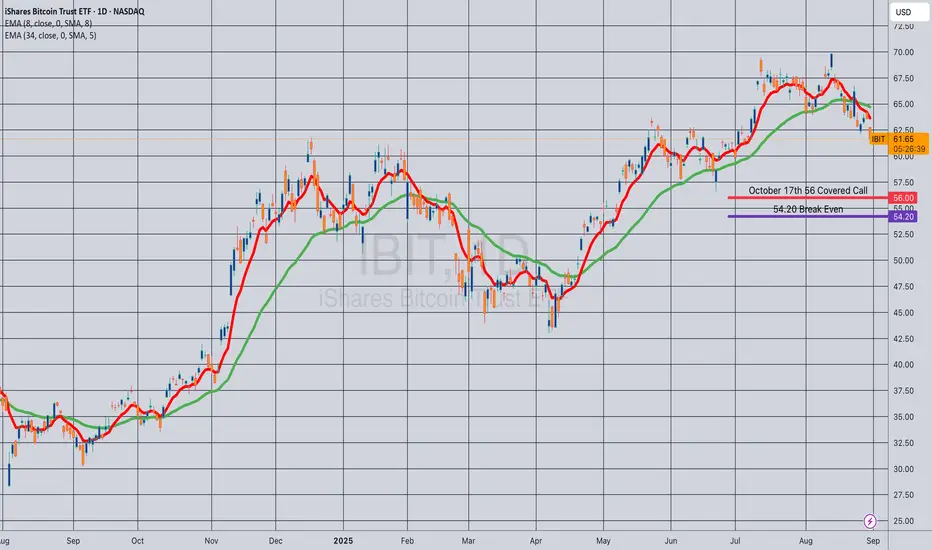
Opening (IRA): IBIT October 19th 56 Covered Call... for a 54.20 debit.
Comments: Selling the -75 call against shares to emulate the delta metrics of a +25 delta short put, but with the built-in defense of the short call and to take advantage of higher IV on the call side than on the put.
Metrics:
Buying Power Effect/Break Even: 54.20/share
Max Profit: 1.80
ROC at Max: 3.32%
IBIT may want to watch this one tomorrow!!!!! INV H&SEnsure you receive confirmation of the pattern breaking with a retest. I would only target the recent high for now. Trade Safe

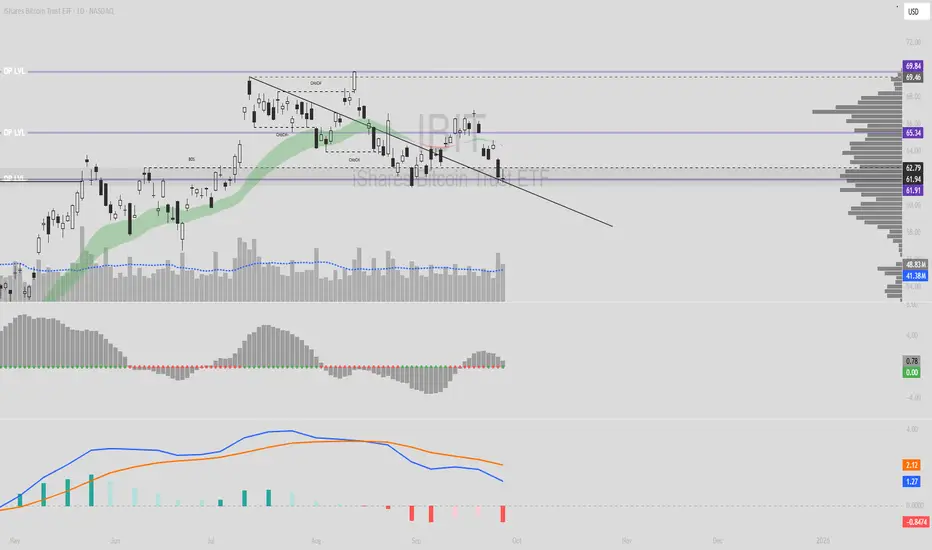
IBIT - Gap Fill PotentialDark Pool level 61.91 held as key support. If defended, setup favors an upside gap fill into the mid/high 60s, backed by rising volume and bullish call flow.
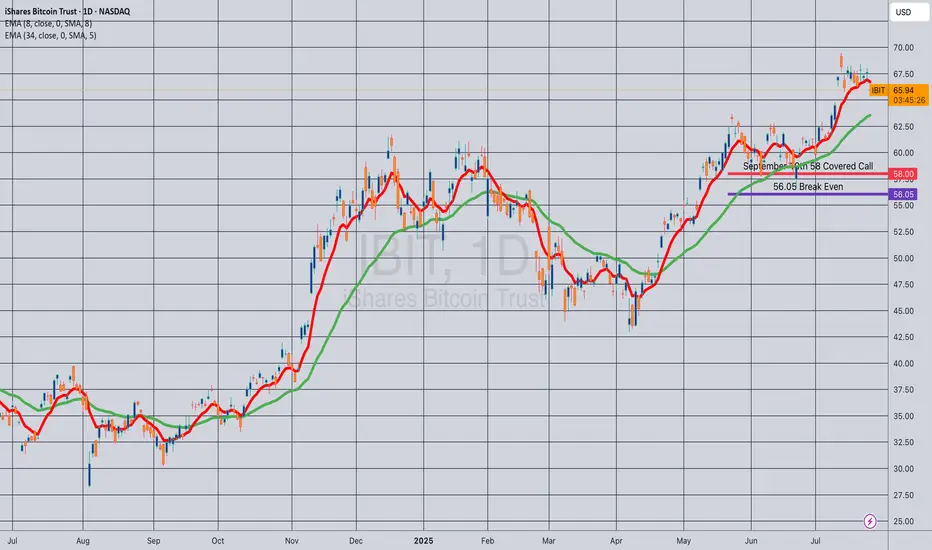
Opening (IRA): IBIT Sept 19th 58 Covered Call... for a 56.05 debit.
Comments: Selling the -75 delta call against shares to emulate the delta metrics of a +25 delta short put to take advantage of higher IV on the call side and the built-in defense of the short call.
Metrics:
Buying Power Effect/Break Even: 56.05
Max Profit: 1.95
ROC at Max: 3.48%
50% Max: .98
ROC at 50% Max: 1.74%
Will generally look to take profit at 50% max, add at intervals assuming I can get in at break evens better than what I have on.
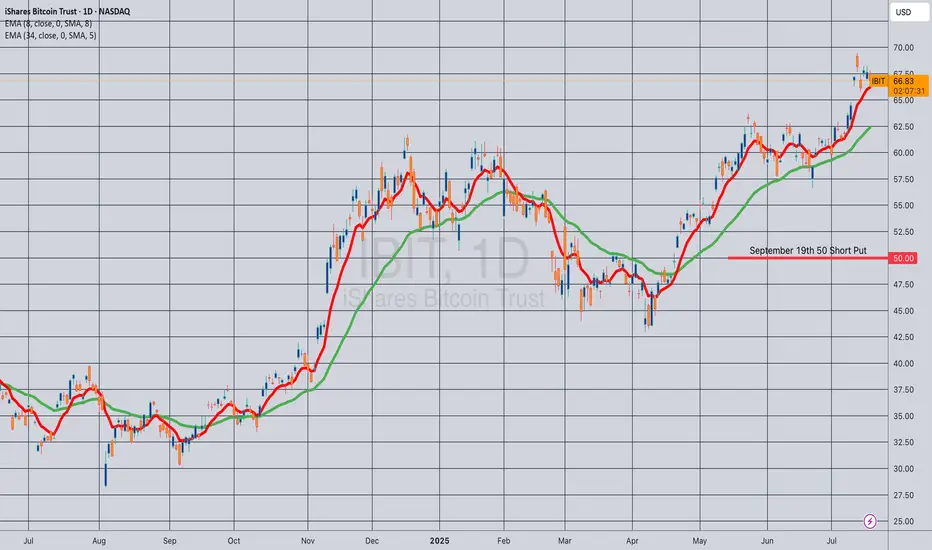
Opening (IRA): IBIT September 19th 50 Short Put... for a .52 credit.
Comments: Laddering out/adding at strikes better than what I currently have on, targeting the strike paying around 1% of the strike price in credit.
Will generally look to roll up at 50% max at > 45 DTE (Days 'Til Expiration).
ibit Bitcoin ETF LONG now is a good time to invest. If you go on Google and type in far side Bitcoin and click the link that goes to the farside uk Bitcoin site. You'll see the daily money flows into or out of all of the different Bitcoin ETFs. If you do the same thing but type ethereum instead you'll see all of the different inflows and outflows of money into the ethereum ETF.
This is important because with the Bitcoin ETFs you'll see that there's been hundreds of million dollars in inflows in the past week. Yet both the 19th and the 20th had outflows of money. 1 and 1/2 weeks ago the same thing happened there were two days without flows of money and then it continued with major inflows of money.
In my opinion I believe this is because the large corporations and investors put too much money in to the ETFs in order to manipulate it so that it will gain a higher value.
They also talk to each other and plan these events so that they can profit from them. So let's take five fake companies that we just call 1 2 3 and 4 and 5. These five companies will all talk to each other on the phone and tell each other well we want to put in 200 million over the course of the week well we want to put in 300 million over the course of the week.
Over the course of one week
Company 1 wants to put in 200 million
Company 2 wants to put in 300 million
Company 3 wants to put in 400 million
Company 4 wants to put in 250 million
Company 5 wants to put in 300 million
Total 1.45 billion, they want that money to stay in Bitcoin at their investment.
Like I said they all plan this to manipulate Bitcoin in my opinion.
This is what happens:
Company 2 puts in 600 million
Company 2 puts in 700 million
Company 3 puts in 800 million
Company 4 puts in 450 million
Company 5 puts in 600 million
Total real investment 3.15 billion
Why do they do it?
This is only an example but over the course of one week these companies wanted to put in 1.45 billion but they ended up putting in 3.15 billion.
3.15 billion
1.45 billion -
-------
1.70 billion + surplus
So they put in 1.70 billion dollars over the amount that they were supposed to in order to get a rally going where Bitcoin goes up in value by a lot.
They are also in contact with the stock market listed Bitcoin mining companies so that the Bitcoin mining companies do not sell the Bitcoin. Instead they Bogart the Bitcoin (keep it) so that they can sell at a higher price when the companies get back in touch with them to say it's time to sell.
All of silicon valley is involved as well I believe in my opinion. All the tech companies and private investors with a lot of money and who knows maybe Mr SpaceX and Mr Amazon are also involved.
It's like a cabal. (Private political group) But for cryptocurrency.
So when this rally happens of course other people buy into the ETF like your average Joe. Hoping to profit.
What happens?
The ETF goes higher in value which means Bitcoin goes a lot higher in value. Maybe it will go up to 125,000 this time? Or maybe it will go up to 130,000 this time before going down?
What's the point?
The point is they are going to be selling that 1.7 billion dollar surplus because they only had 1.45 billion that they were going to put in.
That 1.7 billion dollar surplus that got the rally going and when it's time to sell could possibly be worth 7% to 8.5% more. Plus they're all putting in their own money into it because it's like insider trading. When you're putting your money into a stock as an institutional investor of course you're going to put your own money into it too so these people are putting 50 million dollars by themselves, 500 million by themselves. Who knows?
So surplus of 1.7 billion + 7% is now worth 1.819 billion or a gain of 119,000,000 million dollars. So they sell and they make $119 million for their company. Plus how much do they make for themselves and all of their cohorts that they are in contact with?
Insider trading at its finest.
This happens with all companies. Take for instance an airline. Companies know that maybe airlines will go up in the summer. Or they know that it will go up in the travel season for the holidays Thanksgiving and Christmas. So all the different companies they get in touch with each other and they say hey we're going to buy $5 billion of airline one and then the other company tells them okay we're going to buy 2 billion of airline one. Of course again they're all putting in their own money as well.
The Bitcoin rally is not over. We may see as high as 138,000 this rally. Before the bear market hits.
Some say we could see 420,000. I'm not sure about that I wonder if that's for the next rally in 2028 after the halving?
Will you take a leap of faith and do the right thing for humanity and leave a comment under this post with what your opinion is?

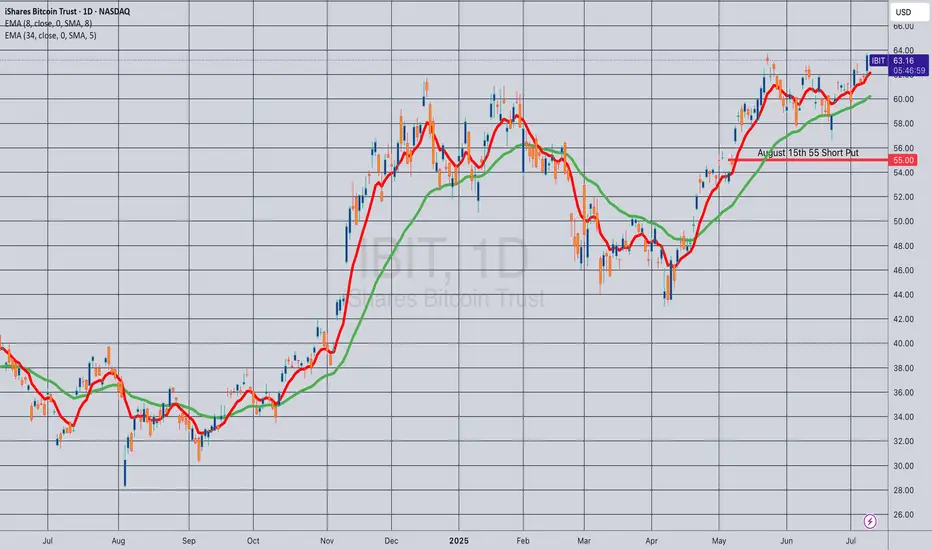
Opening (IRA): IBIT August 15th 55 Short Put... for a .62 credit.
Comments: One of the higher IV ETF's on my board. Targeting the strike paying around 1% of the strike price in credit.
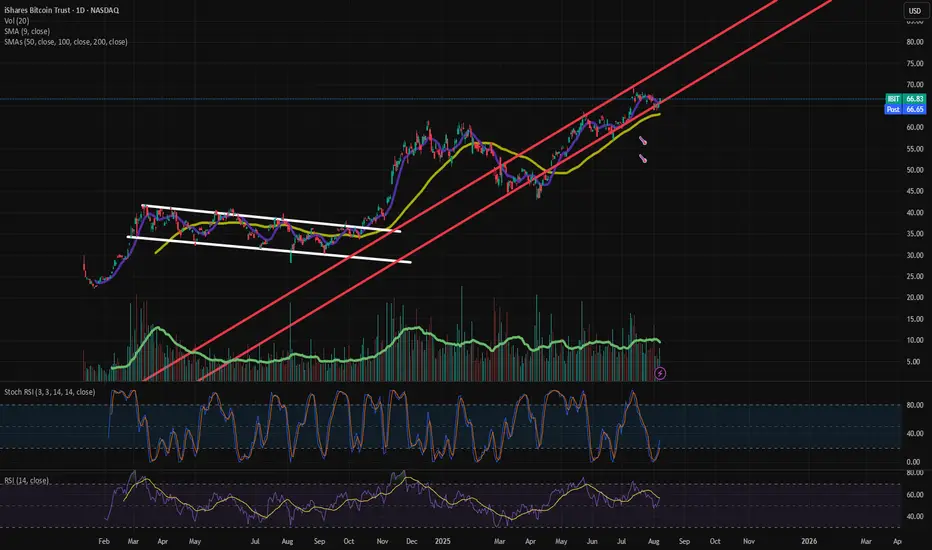
IBIT – Bitcoin Trust Tracking the Channel with PrecisionTicker: NASDAQ:IBIT – iShares Bitcoin Trust
Timeframe: 1D (Daily)
Current Price: $66.83
Bias: Bullish within ascending channel
Outlook: Continuation possible after Stoch RSI reset and trendline bounce
🧠 Idea Summary
IBIT has been trading within a strong ascending channel (marked in red) since late 2023. After a brief consolidation near the channel midline, price is attempting a bounce from key support levels. This resembles the previous bullish flag breakout pattern (white lines) seen in mid-2023.
🔍 Technical Breakdown
📌 Red Ascending Channel
Price has followed a rising parallel channel since late 2023.
The current price is bouncing from the lower bound of this channel.
📌 Previous Bull Flag (White)
In 2023, IBIT broke out of a long consolidation channel with a strong rally — the current structure is mirroring that behavior.
📌 Support/Resistance Levels
🔶 Support: ~$63 (200 SMA)
🔶 Resistance: ~$70 (channel top)
Holding above $63 maintains the bullish structure.
📈 Moving Averages
9 SMA and 50 SMA are both sloping upward, suggesting bullish strength.
Price is currently holding above both, a positive sign for continuation.
🔄 Momentum Indicators
Stoch RSI: Rebounding from oversold (~19), indicating a potential fresh upside leg
RSI (14): Hovering near 57 — still has room to run before overbought territory
📊 Volume
Volume has been consistent with bullish moves, but a breakout above $70 should ideally be accompanied by a volume spike.
🚀 Potential Price Targets
🎯 Target 1: $70 (Channel top & psychological resistance)
🚀 Target 2: $75+ (Channel extension if momentum picks up)
⚠️ Risk Management
A breakdown below $63 and the lower trendline would invalidate the bullish channel and signal a potential trend shift.
Watch for volume divergence or failed follow-through on bullish setups.
🔔 Conclusion
IBIT is respecting technical structure and preparing for a possible continuation move. The recent bounce off the lower trendline, supported by Stoch RSI reset, offers a compelling long setup if momentum follows through. Keep an eye on $70 for breakout confirmation.
✅ Like this idea if you find it useful
💬 Share your thoughts or levels below
📌 Follow me for more crypto/ETF swing setups
$IBITIn crypto there are only two lines.
We would be lucky if we blessed in Dec with:
IBIT 42$
Bitcoin 75K$
