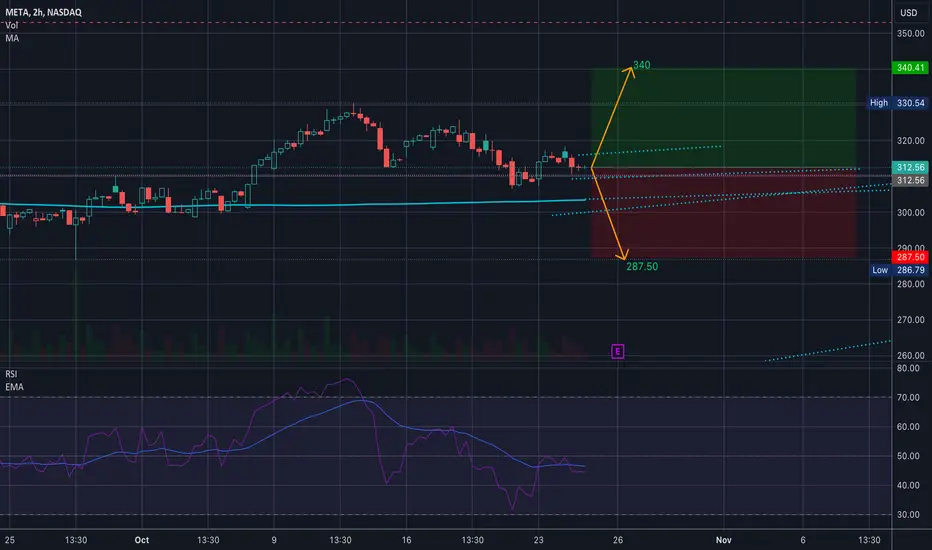
$META Implied Move for Earnings... NASDAQ:META Earnings Implied Move
So Meta’s Implied move for earnings is between 287.50 and 340… 28 dollars in each direction.
And if you are wondering, the implied move is calculated using options...
I did a volume analysis for the year and I feel like I’m going to play downside for earnings tomorrow…
This is not an in depth analysis, just the implied move for record. Happy trading, y’all….
Trade ideas
META | Day trading | 10-24-2023NASDAQ:META
Trend & Moving Averages:
The stock has been in a clear downtrend for the majority of the visible period, as demonstrated by the lower highs and lower lows.
The stock price has been consistently trading below the orange and blue moving averages, reaffirming the bearish sentiment.
More recently, there seems to be an attempt at a reversal as the stock begins to trade above the moving averages and shows a pattern of higher highs and higher lows.
Support & Resistance Levels:
Bearish Line at 312.90 USD: This line seems to act as a recent support, where the price has bounced from it before. If the stock breaches this level going downward, it might continue its bearish trend.
Bullish Line at 317.36 USD: This is a significant resistance level where the price has struggled to break above.
Target Price 1 at 307.69 USD: This is the next significant support level below the bearish line, where the price might aim if it continues the bearish movement.
Target Price 2 at 321.15 USD: This is the next resistance level above the bullish line. Breaking above this level could further solidify a bullish trend.
Volume:
The trading volume is shown at the bottom of the chart. Notably, there seems to be a spike in volume during the bullish movement, suggesting increased buying interest.
Potential Reversal:
As the stock price begins to trade above the moving averages and starts forming higher highs and higher lows, this could be indicative of a potential trend reversal from bearish to bullish. However, it's crucial to monitor if the stock can maintain its position above the moving averages and break above the resistance levels to confirm this.
Ichimoku Cloud:
The stock is currently trading below the shaded area, which is typically seen as a bearish sign. However, it is inching closer to the cloud, suggesting potential bullish momentum if it can break and maintain above it.
To summarize, while the stock has shown a bearish trend for the majority of the visible period, there are recent signs of potential bullish momentum.

META: Buy on the Channel's bottom.Meta is having a strong turnaround day after 7 sessions of decline inside the two month Channel Up. The 1D technical outlook is neutral (RSI = 53.876, MACD = 3.900, ADX = 28.237) and as the RSI S1 (46.50) is holding, today is a strong buy opportunity to target the Channel's top (TP = 345.00). If it drops more, we will make one last buy attempt at the bottom of the Channel Up, marginally over the 1D MA100.
See how well our prior idea has worked:
## If you like our free content follow our profile to get more daily ideas. ##
## Comments and likes are greatly appreciated. ##

meta sell trade- A dark cloud cover (red oval) on October 5, which indicated that the sellers were gaining control after a gap up opening⁷.
- A shooting star (red arrow) on October 11, which signaled a rejection of higher prices and a potential top reversal⁷.
- A bearish engulfing (red oval) on October 18, which confirmed the downtrend and the loss of momentum⁷.
The stock also broke below the 50-day moving average (blue line) on October 19, which acted as a support level in the previous uptrend. This was a bearish crossover that suggested a change in the trend direction . The 50-day moving average is now acting as a resistance level, as the stock failed to close above it on October 20 and 21.
The stock is currently trading near the 200-day moving average (red line), which is another important support level. If the stock breaks below this level, it could trigger more selling pressure and a further decline. The next support levels are at $250 and $200, which are the previous lows in June and February 2023.
The stock is also forming a bearish flag pattern (green lines), which is a continuation pattern that indicates a pause in the downtrend before another drop⁹. The flagpole is formed by the sharp decline from $330.54 to $306.47, and the flag is formed by the consolidation between two parallel trend lines in an uptrend. A break of the lower trend line would signal the activation of the pattern and a target of $282.40, which is calculated by subtracting the length of the flagpole from the breakout point⁹.
Therefore, based on these technical indicators, the outlook for META is bearish and the stock could face more downside risks in the near future. However, this analysis is not a recommendation to buy or sell any securities, and investors should do their own research and due diligence before making any trading decisions.
(1) What Is a Head and Shoulders Chart Pattern in Technical Analysis?. www.investopedia.com
(2) Technical Analysis of Stocks & Securities | CFA Institute. www.cfainstitute.org
(3) Learn About Bear Flag Candlestick Pattern | ThinkMarkets | EN. www.thinkmarkets.com
(4) Meta Platforms Inc. bing.com
(5) META Stock Price Predictions: What Can Investors Expect in 2024?. www.msn.com
(6) Want to Buy Meta Platforms Stock? Be Prepared for a Bumpy Ride. www.msn.com
(7) Meta, Amazon Earnings Put Stock Market to the Test. www.msn.com
(8) Meta Platforms, Inc. (META) Stock Price, News, Quote & History - Yahoo .... finance.yahoo.com
(9) Meta Platforms Inc (META) Stock Price & News - Google Finance. www.google.com
(10) Candlestick Bearish Reversal Patterns - StockCharts.com. school.stockcharts.com
(11) Candlestick Basics: All the Patterns to Master Before Your Next Trade. commodity.com


Want to Buy Meta Platforms Stock? Be Prepared for a Bumpy RideMeta Platforms generated good revenue growth last quarter, but its earnings are still down through through the first half of 2023.
Meta Platforms (META -1.33%) has benefited from increased ad activity on its platform. The company has been delivering some improved growth numbers of late, and investors have become bullish on the tech stock this year. Shares of the company are up almost 160% year to date.
But before you think about jumping on this bandwagon, you should prepare yourself for some volatility in the future.
The metaverse will be a drag on earnings for years
The big problem with Meta always leads back to the metaverse and its Reality Labs business. It doesn't generate much money, and it may never be a significant part of the company's operations. So far this year, the company's Family of Apps segment, which includes popular social media apps Facebook, Instagram, and WhatsApp, has generated over $60 billion in revenue. Reality Labs, by comparison, has brought in $616 million.
That might seem reasonable for a new business, but consider that it has also incurred $7.7 billion of losses in the same period. Meanwhile, the Family of Apps business, which posted $24.4 billion in profit, has allowed Meta Platforms to remain in the black. But on a year-over-year basis, overall operating income of $16.6 billion is down 2%.
And this is with the company's core business doing well. Should its core operations struggle, the bottom line could seriously falter. And investors shouldn't forget the company continually warns that operating losses from Reality Labs will "increase meaningfully year-over-year due to our ongoing product development efforts."
Meta Platforms could make for a volatile investment
If not for Reality Labs, Meta's business would be promising. But as long as that's going to be a key part of its growth strategy, investors should brace for volatility. Meta's growth rate jumped last quarter, but it still faces significant competition like TikTok. And if its Family of Apps business can't generate earnings growth at a faster rate than Reality Labs is incurring losses, the sell-off the stock saw in 2022 could return.
Meta is a risky stock to be holding with its valuation at these levels. and it will require the company's Family of Apps business to be firing on all cylinders for it to continue to draw in growth investors. A big test will come later this month when the company reports its latest round of earnings

META Platforms Options Ahead of EarningsIf you haven`t sold META when ARK did here:
or entered the dip here:
Then analyzing the options chain and the chart patterns of META Platforms prior to the earnings report this week,
I would consider purchasing the $317.50 usd strike price Calls with
an expiration date of 2023-10-27,
for a premium of approximately $10.30.
If these options prove to be profitable prior to the earnings release, I would sell at least half of them.
Looking forward to read your opinion about it.

META BIAS DOWNSIDE with 3 Signal21st Oct 2023.
Bias Meta on downside (after 25th Oct Earnings)
TA Basis
Resisted by 78.6%
Forming Bearish Divergence (RSI)
Weekly Candle show bearish Engulfing

META to CRASH NEXT RUN DO NOT WALK TO THE EXIT Meta is the next one to collapse Based simple on RSI this stock bottomed within 3 of my target and has formed a classic 5 th wave blowoff be safe Wavetimer

MetaPullback here after completing double bottom.
Gap closed at 322 , mission accomplished!
Look for a pullback to 310 before heading higher..
Mid support at 317.
So your short targets would be
317 then 310..
Stop loss over 326.00

META has the potential for an EPIC failThe squeeze to the upside was phenomenal!
But in my view, they over-pumped it - who ever it was...
The white Center-Line provided good support when price failed at the GAP/Resistance Zone. this zone is built just with the range of the GAP-Bar.
After the CL support, meta reached the another temporary high at the orange CL, bounce back to the white CL again and once more got pumped up to the orange CL/GAP/Resistance zone, where it hangs out now.
Of course; If I had the money to move markets, I would want my Stock to be as high as possible to a) unload and b)short it for a Double-Whammy.
The huge divergence with price and RSI speaks for it self.
I know that I know NOTHING.
But I know what I can "Project" into the future.
It's good to be prepared, also for a move in the opposite direction, which is Up Up and away.
That means, if I short, my risk is small. No need to be a Hero and win a T-Shirt for putting myself at risk to loose my House, Cats & Dogs.
I am fully aware, that price is currently ABOVE the white CL and no lower low is broken yet. That's what makes a short so difficult.
Peace4TheWorld!

(META) is showing extremely high implied volatility Meta Platforms (META) is showing extremely high implied volatility in the lead-up to its earnings announcement on Wednesday.
There is also significant volatility skew, with short-term options showing much higher implied volatility than long-term options.
One way to take advantage of this skew is via a diagonal put spread. This option strategy is an advanced strategy because it utilizes options over different expiration periods and different strike prices.
e risk on the trade is on the downside, with a potential maximum loss of $995. This is calculated by taking the difference in the spread (10) multiplied by 100 and factoring in the cost (5).
The maximum potential gain is around $1,035. It would occur if Meta stock closes right at 300 on Oct. 27.
The trade has a nice profit zone between 280 and 370.
If Meta stock stays between these values, the trade should do well. The main risk is if the stock drops below 280.

Potential double-top ahead of earningsMeta Platforms posted a new 52-week high last week, hitting $330.54. After that, it retreated lower, creating a potential setup for a double-top pattern. As a result, we are carefully watching the developments on the daily chart, with the main focus on RSI, which seems to have topped slightly below 70 points last week. In many instances, such behavior is associated with bear markets. Therefore, in the next few days, we will observe whether it will be able to break into the overbought territory; if not, it will act as a warning sign. One thing to consider, however, is that Meta Platforms is scheduled to report earnings next week. Within the past two years, all except for one earnings release were accompanied by a volatile price action and an opening gap the next day. Consequently, we would not be surprised to see a similar occurrence take place this time again. That brings us to the conclusion that staying on the sidelines would be the best alternative until the company releases its earnings.
Illustration 1.01
Illustration 1.01 displays the daily chart of Meta Platforms. Yellow arrows indicate four major opening gaps within the past twelve months. Interestingly, every one of them coincided with the release of the quarterly earnings report.
Technical analysis gauge
Daily time frame = Bullish
Weekly time frame = Bullish
*The gauge does not necessarily indicate where the market will head. Instead, it reflects the constellation of RSI, MACD, Stochastic, DM+-, ADX, and moving averages.
Please feel free to express your ideas and thoughts in the comment section.
DISCLAIMER: This analysis is not intended to encourage any buying or selling of any particular securities. Furthermore, it should not be a basis for taking any trade action by an individual investor. Therefore, your own due diligence is highly advised before entering a trade.

Short Meta Again - Zuc shortMade some good % on a Zuc short earlier this year. Then straight 12 months of up candles is crazy, total clown show. Short here based on history of the monthly RSI crosses. I have the patience to ride it out, will add. Not Advise, Good Luck.

Meta calls gonna be big next weekGrabbing a handful here at the oversell with uptrend. Will pay off nicely if no negative news all next week.

META PENNANT (NOT YET TRIGGERED)Watching this pennant on NASDAQ:META daily (energy building for over 2months) - looking for over 308 for upside breakout to 313-316 then 324-326 or for a break of 297 for downside breakout to 285.66, 274.38 and 266.60
