$NVDA: Structure MemoryRESEARCH NOTES
So we have NVIDIA establishing new ATH - rejecting from there and from another lower high, opening a channel.
The topology covering the area (dual aspect):
Inward
Out
Research on how waves of different % magnitude shape the route of future price and its cycles.
NVDA trade ideas
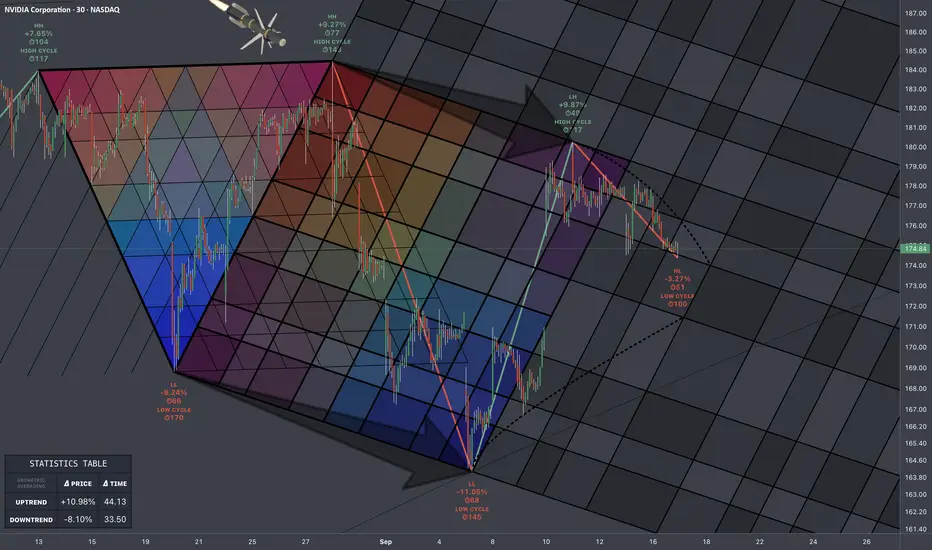
$NVDA: Structural Extension🏛️ RESEARCH NOTES
Rejections at highs look way too systematic. I also see drop in average %𝜟 of both parties at local top of ongoing wave.
⚖️ That means we can extend this structure to cover the possible compression (otherwise the escape).

MARKING LEVELS TO( supply/ demand = trending) BULLISH MARKETS1.Find trend = current market is trending so i MARKed key LEVELS in the
(wkly,dly,1HR,15MIN )
I found the trend in the 15 minute timeframe, Soley focused on that time frame when looking at the next steps
2. wait for a bos {break of structure} in same direction of the trend= looked for a New LL (lower low) to be made= No candle close {real body}
3. waited till price to come to my demand zone
4. entered trade and set my tp to supply zone !
I took a step back to find out in the higher timeframes there was a KEy level of
Resistance so i dragged my tp right to the resistance. Looking to ride the trend.
i need to find a risk to reward
I need to stay patient
I need to stay disciplined

What Is Beta in Stocks and How May It BeUsed?What Does Beta Mean in Stocks, and How May It Be Used in Risk Management?
Beta is a key measure of how a stock moves relative to the market, helping traders assess risk exposure and price volatility. Understanding this indicator can help traders analyse potential price swings and portfolio stability. This article explores how beta works, its implications, and how it may be used in risk analysis.
What Is Beta in Stocks and How Does It Affect Risk?
Beta is a statistical measure that quantifies how a stock’s price fluctuates relative to the broader market. It helps traders analyse systematic risk—the kind that affects most stocks at the same time, such as economic downturns or interest rate changes. The number itself comes from regression analysis, which compares a stock’s potential returns to a benchmark index like the FTSE 100 or S&P 500.
A beta of 1.0 indicates that a share generally tracks the movements of its benchmark index. If the index gains 5%, a stock with a value of 1.0 is likely to rise by about the same amount. A beta above 1 signals greater volatility—company shares with a beta of 1.8 may rise 9% when the market gains 5%, but they also tend to fall more sharply during downturns. A value below 1 suggests lower volatility, with the asset moving less than the broader index.
Interpreting Beta Values
Now, we will examine beta values in detail.
High Beta Stocks (>1.0)
These stocks react strongly to market changes. High beta is common in technology, consumer discretionary, and financials, where investor sentiment drives price movements. While they offer the potential for higher returns, they also come with increased price swings.
Low Beta Stocks (<1.0 but >0)
Lower beta stocks experience smaller movements compared to an index. A value of 0.6, for example, suggests it might rise 3% if the market gains 5%. Sectors like utilities, healthcare, and consumer staples often have these types of stocks, as demand for their products tends to remain stable, except in situations such as the COVID-19 pandemic.
Negative Beta Stocks (<0)
Some assets, such as gold mining company shares, have negative beta values, meaning they move in the opposite direction of the broader market. These assets can act as a hedge when markets decline, though a negative value is relatively rare.
While the beta of a stock provides insights into its volatility, it doesn’t account for company-specific risks or broader economic shifts. Investors often combine this form of analysis with fundamental and technical factors to build a more complete view of exposure.
How Traders Use Beta in Measuring Risk
Rather than examining price movements in isolation, traders use beta to evaluate how a stock reacts to broader trends. This helps them decide whether it aligns with their risk tolerance and market outlook.
Analysing Systematic Risk
Since beta measures sensitivity to the market, it’s useful for assessing systematic risk—the kind of risk that can’t be eliminated through diversification. A stock with a high beta will likely experience sharp swings during broader turbulence, making it appealing for those looking to capitalise on potential momentum but at the cost of greater volatility. In contrast, low-beta shares may hold up better in downturns but won’t rally as aggressively in bull markets.
Beta in Portfolio Construction
Investors often consider this metric when balancing a portfolio’s overall risk level. A portfolio heavily weighted in high-beta company shares can be more volatile, while one with low-beta stocks may offer less volatile potential returns. Some investors focus on diversified beta investing, combining high- and low-beta assets to adjust their exposure depending on overall conditions.
The Capital Asset Pricing Model (CAPM)
Beta is also a key component of the Capital Asset Pricing Model (CAPM), which estimates a stock’s expected return based on its risk level. CAPM considers the relationship between beta and market returns, helping to compare potential opportunities. If the asset is more volatile than an index but offers lower-than-expected rewards, it may not justify the added volatility.
The Limitations of Beta
Beta is a useful tool for assessing how a stock moves relative to an index, but it has shortcomings. Since it’s based on historical price data, it doesn’t always reflect how the asset will behave in the future. It’s important to be aware of its limitations when using it for risk assessment.
1. It Changes Over Time
Beta in a stock is not a fixed number. Company risk profiles can shift due to short-term developments, industry changes, or economic cycles, and impact a stock’s beta, meaning a stock with a value of 1.5 today might move closer to 1.0 over time as conditions evolve.
2. It Doesn’t Account for Company-Specific Risk
Beta measures systematic risk, meaning it doesn’t factor in aspects specific to a company, such as management changes, earnings surprises, or regulatory issues. Two stocks can have the same beta but react very differently to news.
3. High Beta Doesn’t Always Mean Greater Potential Returns
A stock with a beta of 2.0 might move twice as much as the market, but that doesn’t mean it will generate higher potential returns. If the asset consistently underperforms, its added volatility becomes a liability rather than an advantage.
4. Different Market Conditions Affect Reliability
Beta tends to be more stable in normal market conditions but can break down during extreme events, such as financial crises or sudden liquidity shocks. In times of panic, correlations between assets often increase, making the metric less useful for risk analysis.
Practical Examples of Beta in Action
Looking at beta in real-world scenarios helps illustrate how different stocks react. Two well-known examples are NVIDIA (NVDA) and Johnson & Johnson (JNJ), which have very different values.
NVIDIA (NVDA) – 1.76
According to Yahoo Finance, NVIDIA has a 5-year monthly beta of 1.76. This means its price is about 76% more volatile than the S&P 500. If the index gains 10%, NVIDIA’s stock could rise around 17.6%. However, in a downturn, it could fall by a similar magnitude. The tech sector is highly sensitive to market sentiment, innovation cycles, and economic conditions, making high-beta assets like NVIDIA riskier but also capable of higher potential returns.
Johnson & Johnson (JNJ) – 0.46
Johnson & Johnson has a 5-year monthly beta of 0.46 (source: Yahoo Finance), meaning it moves about 54% less than the market. If the index rises or falls 10%, JNJ stock might move by 4.6%. The lower value reflects the so-called stability of the healthcare industry, where consistent demand for products like medical devices and pharmaceuticals tends to lead to more resilient stock performance.
Key Takeaways
Those willing to take on more risk for higher potential returns often favour high-beta stocks like NVIDIA, while those seeking less volatility may prefer low-beta companies such as Johnson & Johnson. However, the measure ignores company-specific risks or specific short-term outperformance factors (e.g. positive earnings or product releases), and it is typically calculated over a long timeframe—5 years in this instance.
The Bottom Line
Understanding the beta definition and how it applies may help traders and investors assess a stock’s volatility. Whether they are focused on high-beta growth stocks or lower-volatility options, this metric may help traders refine their strategy. However, while it may provide useful insights, it should be used alongside other analysis methods for a well-rounded approach.
FAQ
What Does Beta Mean in Stocks?
The beta in stocks meaning refers to a measure of how much a stock moves relative to the broader market. A beta of 1.0 means it generally follows market movements, while a beta above or below 1 indicates higher or lower volatility, respectively.
What Are High Beta Stocks?
High-beta stocks have a beta greater than 1, meaning they tend to move more than the overall market. These assets often belong to technology, consumer discretionary, and financials, where price swings are more pronounced.
What Does a Portfolio Beta Measure?
Portfolio beta calculates the overall volatility of a portfolio relative to an index. It’s determined by weighting each stock’s beta based on its proportion in the portfolio. A portfolio with a value above 1 is more volatile than the market, while one below 1 is less volatile.
What Does a Stock With a Beta of 1.5 Indicate?
A stock with a beta of 1.5 is 50% more volatile than the market. If the index rises 5%, shares might increase by 7.5%, but it could also fall more sharply in downturns.
What Is β?
The symbol β is a Greek letter signifying beta. The beta meaning in finance refers to a stock’s expected performance relative to an index.
This article represents the opinion of the Companies operating under the FXOpen brand only. It is not to be construed as an offer, solicitation, or recommendation with respect to products and services provided by the Companies operating under the FXOpen brand, nor is it to be considered financial advice.
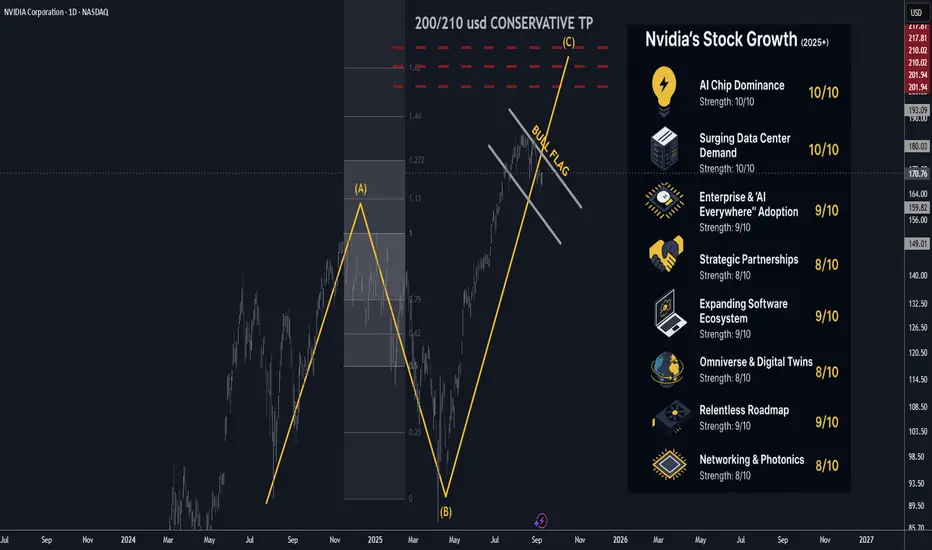
Nvidia (NVDA) 2025+ Catalysts Updated: Analyst Views September🚀 Nvidia (NVDA) 2025+ Catalysts & Risks: Analyst Views — Updated September 2025
________________________________________
📝 Summary Outlook (September 2025)
Nvidia remains at the center of the global AI boom, with dominant GPU share, a strengthening networking/software moat, and multi-year sovereign and enterprise buildouts driving demand. Q2 FY26 confirmed strong momentum, while Q3 guidance points to continued growth. The main risks lie in tariff policy, China licensing, supply chain tightness, and valuation sensitivity. Street consensus remains bullish, with targets in the $207–$211 range and a Strong Buy bias.
🔑 Key Catalysts Driving Nvidia’s Stock Growth (2025+)
1. 🏆 AI Chip Dominance — Score: 10/10
Nvidia still commands ~90%+ of data-center AI accelerators, with CUDA/NVLink lock-in keeping switching costs high.
2. 🏗️ Surging Data Center Demand — Score: 10/10
Hyperscalers remain in an AI “build” cycle. 2025 data-center CapEx is approaching ~$300B, with Nvidia reporting record $41.1B Data Center revenue in its latest quarter.
3. 🌐 Enterprise & “AI Everywhere” Adoption — Score: 8.7/10
Companies across industries are rolling out AI assistants, copilots, and retrieval-augmented applications; Nvidia benefits via GB200 NVL72 racks and RTX-based inference at the edge.
4. 🤝 Strategic/Channel Partnerships — Score: 8.9/10
Cisco is integrating Spectrum-X into networking solutions, while HPE has expanded its Nvidia “AI factory” offerings—broadening reach into enterprise and hybrid AI buildouts.
5. 🚗 Automotive & Robotics — Score: 8.4/10
Auto revenue grew ~70% Y/Y; DRIVE Thor shipments have begun, and Nvidia’s Jetson/AGX Thor and robotics platforms are expanding into industrial automation.
6. 🧑💻 Software & Subscriptions — Score: 8.6/10
Nvidia’s AI Enterprise, DGX Cloud, CUDA-Q, and TensorRT deepen recurring, high-margin revenue and increase developer lock-in.
7. 🌎 Omniverse, Digital Twins & Industrial AI — Score: 8.2/10
Ansys, Siemens, and other industrial software vendors are embedding Omniverse into simulation suites, accelerating adoption of “digital twins” and simulation AI workflows.
8. 🛜 Networking & Photonics — Score: 8.8/10
Spectrum-X Photonics enables co-packaged optics for exascale “AI factories,” improving bandwidth and efficiency while giving Nvidia more end-to-end control.
9. 🧪 Relentless Roadmap (Blackwell → Rubin) — Score: 9.0/10
Blackwell Ultra is ramping into 2025, with the Rubin architecture slated for 2026—sustaining Nvidia’s upgrade cycles.
10. 🌍 Sovereign & Global AI Buildouts — Score: 8.5/10
Europe, the Middle East, and India are launching sovereign AI projects. Saudi-backed Humain alone has committed to tens of thousands of Blackwell chips for 2026 buildouts.
________________________________________
📈 Latest Analyst Recommendations (September 2025)
• Street Stance: Strong Buy/Overweight remains dominant. ~85% of analysts rate NVDA a Buy; avg 12-mo PT ~$207–$211.
• Recent Calls: Multiple firms reiterated Overweight/Buy, with price targets up to $230.
• Common Bull Case: Nvidia’s accelerator lead, software moat, sovereign/enterprise AI pipeline, and expanding networking portfolio.
• Common Cautions: Premium valuation, competition from custom silicon, and export/tariff risk.
________________________________________
🗞️ Latest Events & News (Aug–Sep 2025)
• Q2 FY26 results (reported Aug 27, 2025): Revenue $46.7B (+56% Y/Y); Data Center $41.1B; Blackwell shipments +17% Q/Q; buyback program boosted by $60B.
• Q3 FY26 guidance: ~$54B (±2%) revenue.
• Networking push: Spectrum-X Photonics unveiled; Cisco partnership expanding enterprise deployments.
• Omniverse OEM deal: Ansys to embed Omniverse tech within its simulation platforms.
• Sovereign AI momentum: Saudi Humain centers to deploy 18k+ Blackwell chips starting 2026; UAE and India also ramping large-scale AI initiatives.
• Ecosystem investing: Nvidia continues selective investments in AI startups, strengthening CUDA adoption.
________________________________________
🇺🇸🇨🇳 US–China Tariffs & Export Controls — September 2025 Update
• Tariff truce extended (Aug 2025): Current tariffs remain at ~30% U.S. on Chinese imports and ~10% reciprocal from China. Next decision point: Nov 10, 2025.
• Supreme Court review: The Court will hear a case challenging U.S. executive authority on tariffs this fall.
• China export licensing: U.S. has begun granting licenses for Nvidia’s H20 China-compliant GPUs. Advanced Blackwell exports remain restricted without further approvals.
Impact on Nvidia: Truce reduces near-term disruption, but future tariff or licensing changes remain key risks. China sales are limited to compliant GPUs with lower margins.
________________________________________
⚠️ Key Negative Drivers & Risks (Updated)
1. 🇨🇳 US–China Tech Policy
Tariff truce is temporary; licensing decisions and court rulings keep China exposure uncertain.
2. 🏛️ Regulatory/Legislative Overhang
Proposals like the GAIN AI Act could impose stricter controls on exports and prioritize domestic deployments.
3. 🏭 Supply Chain Bottlenecks
Advanced packaging and HBM memory remain tight despite expansions—potential bottlenecks for shipments.
4. 🧮 Competitive Threats & Custom Silicon
AMD, Intel, and hyperscaler-designed accelerators continue to advance, potentially eroding Nvidia’s hyperscale share.
5. 🏷️ Valuation & Expectations
Nvidia trades at high multiples; any slowdown or guidance miss could trigger volatility.
6. 💵 Customer Concentration
Top cloud giants still account for a large share of revenue; CapEx pauses or custom chip adoption would materially impact results.
________________________________________
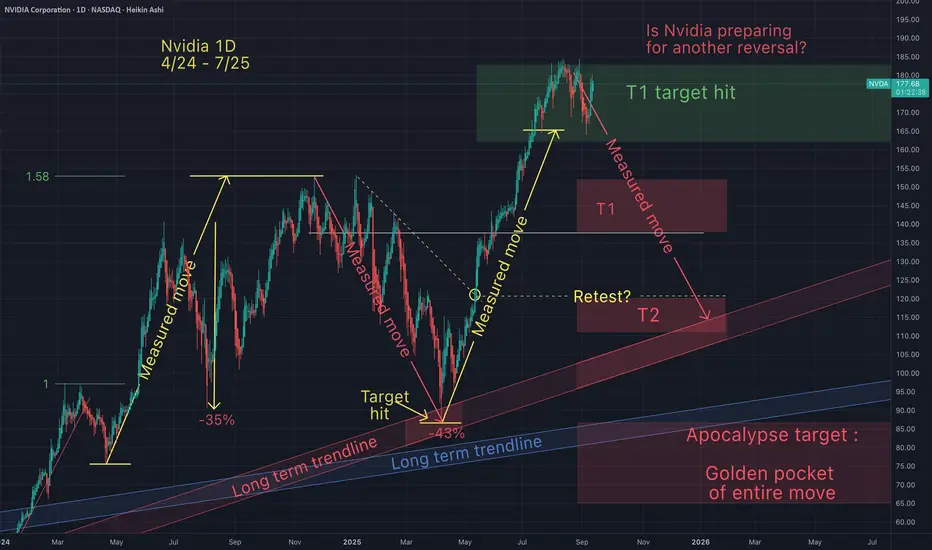
Is Nvidia preparing for a retracement?On July 23rd I posted a chart suggesting that Nvidia had topped (at my green T1). Since then Nvidia has stalled at my T1 range for the past 2 months.
Question remains, will Nvidia retrance from here as anticipated? What do you think, I'd like to hear from you, to gauge sentiment.
May the trends be witht you.

NVDASuccess in forex and stocks comes from a combination of knowledge, discipline, and patience. Understanding market trends, economic factors, and company
fundamentals is crucial, but equally important is controlling emotions and sticking to a well-planned strategy. Continuous learning, adapting to changing conditions, and managing risk wisely can turn opportunities into consistent growth over time.
Consistency, not luck, separates successful traders from the rest.
$NVDA - $280 PT WEEKLY BULL FLAGStay Positioned with Nvidia's Weekly Bullish Chart. A Bull Flag is setting up with an imminent breakout. Long/Short Ratio is also very bullish at almost 60%. Price Target is $280. Remember Pole length of the flag = extended measured move at the breakout point of the flag.

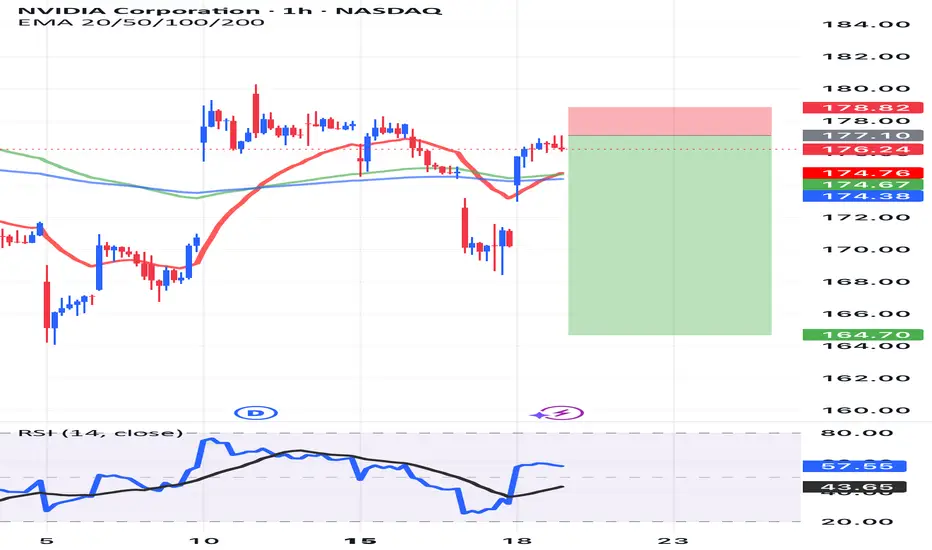
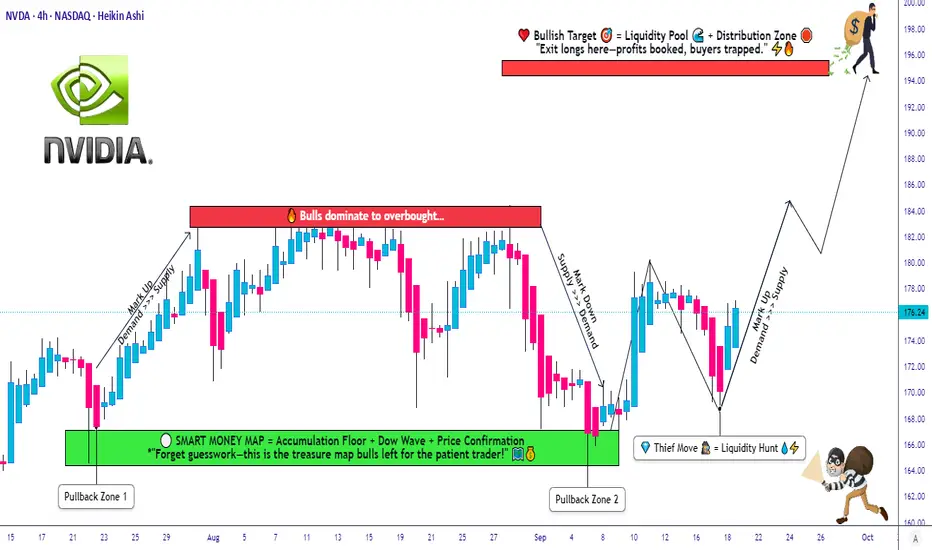
NVDA Setup Explained: Layered Entry + Clear SL/TP Levels😎 NVDA Thief’s Wealth Heist: Swing/Day Trade Blueprint 🚀
Asset: NVIDIA Corporation (NVDA) 📈Vibe: Bullish, sneaky, and ready to snatch profits with style! 💰
Welcome, ladies and gentlemen, to the Thief’s OG Wealth Strategy Map for NVDA!
This is a fun swing/day trading plan designed to grab liquidity like a master thief. Let’s break down this bullish setup with a double bottom pullback, layered entries, and a cheeky escape plan. Ready to outsmart the market? 🕵️♂️
📊 Market Analysis: Why NVDA?
NVDA is riding a bullish wave 🌊, confirmed by a double bottom pullback pattern and a sneaky liquidity grab at key support levels. The stock’s momentum is screaming “UP!” as buyers step in to defend the price. This setup is perfect for swing or day traders looking to capitalize on NVIDIA’s tech-fueled surge. 💻
🗺️ The Thief’s Plan: Bullish Heist Strategy
🎯 Entry Strategy:Deploy the Thief’s Layering Tactic with multiple buy limit orders to maximize your entry precision.
Suggested price levels:
$172.00
$174.00
$176.00
$178.00
Pro Tip: Feel free to add more layers based on your risk appetite and market conditions. The more, the merrier! 🧑💼
🛑 Stop Loss (SL):Set a Thief’s SL at $168.00 to protect your loot.
Note: Dear Thief OGs, this SL is my suggestion, but you’re the boss of your trades! Adjust based on your risk tolerance and let the profits roll. 💸
🎉 Take Profit (TP):Aim for the juicy $195.00 target, where we expect strong resistance, potential overbought conditions, and a possible trap for the unprepared. Lock in those hard-earned gains and escape like a pro! 🏃♂️
Note: This TP is my call, but you do you! Take profits at your own pace and keep the cash flowin’. 😎
🔗 Related Pairs to Watch (in USD)
To boost your market awareness, keep an eye on these correlated assets:
NASDAQ:AMD (Advanced Micro Devices): NVDA’s chipmaking cousin often moves in tandem. A bullish NVDA could signal strength in AMD. 📡
NASDAQ:SMH (VanEck Semiconductor ETF): This ETF tracks the semiconductor sector, including NVDA. Watch for sector-wide momentum. 📊
NASDAQ:QQQ (Invesco QQQ Trust): NVDA’s a heavy hitter in this tech-heavy ETF. QQQ’s trend can confirm NVDA’s direction. 🚀
Key Correlation Point: NVDA’s performance is tied to the broader semiconductor and tech sector. If AMD or SMH shows bullish patterns, it reinforces NVDA’s upside potential. Conversely, weakness in QQQ could signal caution. Stay sharp, thieves! 🕵️
🛠️ Why This Setup Rocks
Double Bottom Pullback: A textbook bullish reversal pattern, signaling strong buying interest. 📉➡️📈
Liquidity Grab: The market’s attempt to shake out weak hands before the real move up. We’re smarter than that! 😏
Layered Entries: Spread your risk across multiple price levels for a smoother ride. 🎢
Risk Management: Clear SL and TP levels keep your heist disciplined and profitable. 🧠
⚠️ Disclaimer
This Thief Style Trading Strategy is just for fun and educational purposes! I’m not a financial advisor, and trading involves risks. Make your own decisions, manage your risk, and trade responsibly. Let’s keep the vibes high and the losses low! 😜
✨ “If you find value in my analysis, a 👍 and 🚀 boost is much appreciated — it helps me share more setups with the community!”
#NVIDIA #NVDA #Trading #SwingTrading #DayTrading #ThiefStrategy #StockMarket #Bullish #TechnicalAnalysis
Nvida BEAR n BULL idea. i'm bearish on nvida right now, this is my idea.
I'm really convinced that nvida will retest the support on old ath.
then go to the price target on green.

$NVDA - Bullish Reverse Head & ShoulderThere is a reverse head & shoulder pattern setting up which is a bullish pattern. Break above the neckline should send the price to near $200.

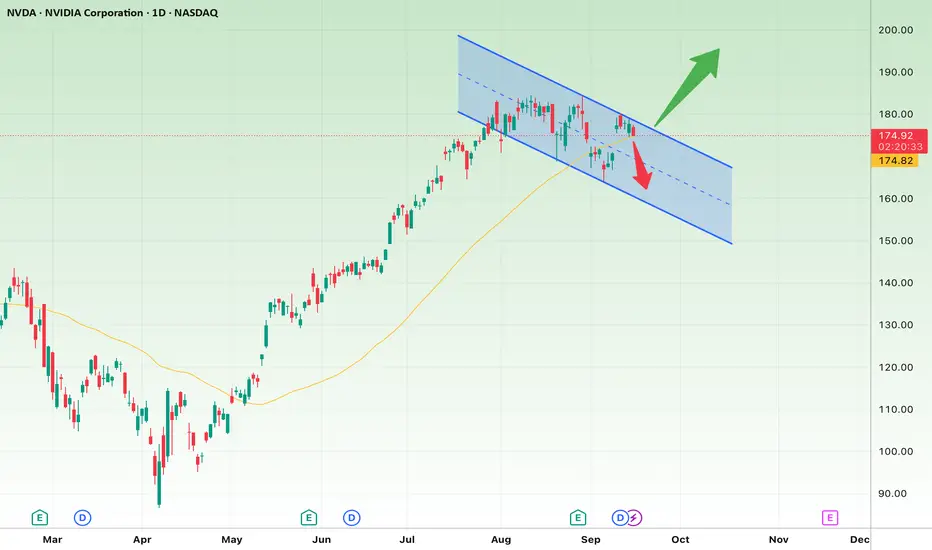
NVIDIA Analysis: Short-Term Gains & Long-Term PotentialShort-Term Analysis (1-2 weeks):
Price Action: The current price is near the lower boundary of the descending channel, with the support level around $174.80. This could act as a good entry point for a potential rebound.
Technical Insights: The chart shows a descending channel, indicating that if the price reaches the lower boundary, there's a likelihood of a short-term reversal.
Price Target: In the short term, the first target would be around $180, which is near the upper resistance of the channel. If broken, a further move toward $185 could be possible.
Stop Loss: If the support at $174.80 breaks, the stop loss could be set at $170.
Long-Term Analysis (1-3 months):
Price Action: If the price manages to break out of the descending channel, a continued bullish trend would likely push the price toward $190. This is a strong resistance level.
Technical Insights: A breakout from the descending channel would indicate a continuation of the bullish trend. In that case, the price might reach higher levels above $190.
Price Target: In the long run, if the price breaks above the channel, the next target could be $200.
Stop Loss: In case the price drops below $170 in the long term, the bearish trend would likely continue, with a stop loss set at $160.
Summary:
Short-Term: Support at $174.80, with a price target of $180 and a stop loss at $170.
Long-Term: Bullish target at $190-$200, with a stop loss at $160.
Always consider fundamental news that could significantly impact price movements.
$NVDA- channel breakout possible here- on watchNVDA - Stock moving towards top of the channel. possible breakout above $179-180 level area. multiple bad and good news coming for the stock. on high watch. above $180 we can see a move towards all time highs.

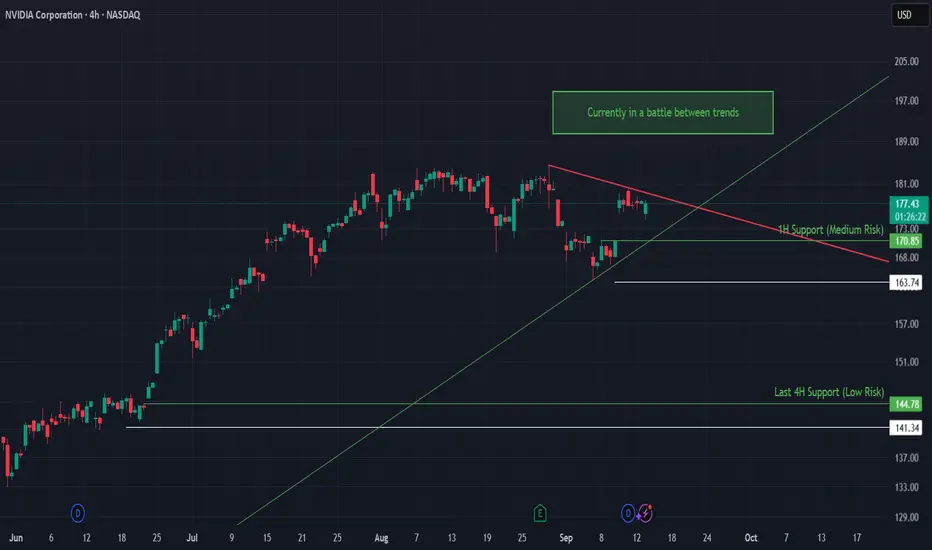
NVDA at a Crossroads: Battle Between TrendlinesNVIDIA is currently consolidating in a tight range, locked between an ascending green trendline of support and a descending red resistance trendline. This setup signals that a breakout is near, with the next directional move likely to bring strong momentum.
🔍 Technical Analysis
Current Price: 176.74
Structure: Triangle squeeze between rising support and falling resistance.
The ascending trendline from June continues to provide strong bullish structure, but the red downtrend capping recent highs must be broken to regain upside momentum.
🛡️ Support Zones (with Stop-Loss):
🟢 170.85 | SL: 163.74 – 1H Support (Medium Risk)
🟢 144.78 | SL: 141.34 – 4H Support (Low Risk, strong base)
🔼 Resistance Levels:
🟥 Red downtrend line near 180 – Breakout above confirms renewed bullish impulse.
🧭 Outlook
Bullish Case: Hold above 170.85 and break the red downtrend → momentum push toward 185–190.
Bearish Case: Failure to hold 170.85 could trigger a deeper pullback into 163 or even 145.
Bias: Neutral to bullish as long as price stays above the green trendline.
🌍 Fundamental Insight
While NVDA remains a market leader in AI and GPUs, recent earnings have highlighted slowing revenue growth compared to prior explosive quarters. This has cooled investor enthusiasm, making technical levels even more important for short-term direction.
✅ Conclusion
NVDA is at a decision point: stuck between trendlines, awaiting a breakout. Bulls must defend 170.85 while bears eye resistance around 180. A resolution here could set the tone for the coming weeks.
⚠️ Disclaimer
This analysis is for educational purposes only and does not constitute financial, investment, or trading advice.
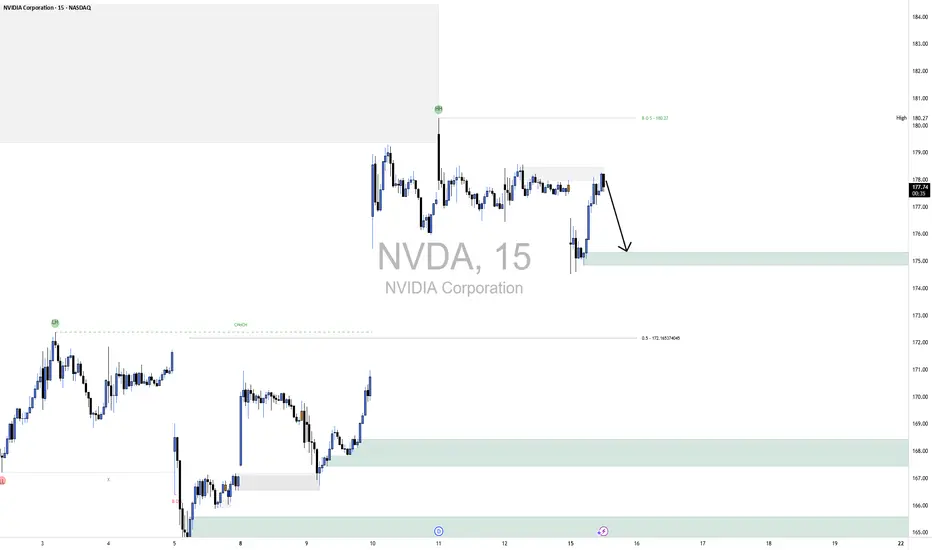
NVDA ShortThe broader market structure on NVDA remains range-bound but with a slight bearish tilt after the recent Break of Structure (BOS) at 180.27, which confirmed sellers pushing price lower from the recent swing high. This BOS indicates short-term momentum favoring the downside, with price unable to reclaim the highs.
Looking at supply and demand, the most recent supply zone near 178–179 caused a sharp reaction and rejection, showing that sellers stepped in with strength. The nearest demand sits at 175–174.5, where buyers previously initiated a strong impulse that led to the most recent rally, making it a valid level to watch for a bounce. Deeper demand exists near 172, which aligns with a 50% retracement level and previously acted as the base of a major move higher.
Price action within the marked region shows that NVDA is currently pulling back from supply, with sellers pushing price lower and momentum slowing on the way down. The most likely next step is a retest of the 175 demand zone. If price reacts bullishly here with strong candles, we could see a bounce back toward 177–178. However, if demand fails to hold and we break below 174.50, continuation toward 172 becomes likely as price seeks deeper liquidity.
The trade bias is currently bearish until we see a strong bullish reaction from demand. Invalidation for shorts would be a clean reclaim and close above 178.50, which would shift structure back toward the upside and likely target 180 again. Momentum currently favors sellers, given the BOS and recent rejection from supply, and candles show lower wicks are minimal—indicating little absorption from buyers yet.
Nvidia - The rally is still not over!🔌Nvidia ( NASDAQ:NVDA ) still heads much higher:
🔎Analysis summary:
For the past decade, Nvidia has perfectly been respecting a major bullish rising channel formation. Currently, Nvidia is still far away from the upper red resistance trendline, which indicates another potential move higher. Just understand that the trend is your closest friend.
📝Levels to watch:
$200
SwingTraderPhil
SwingTrading.Simplified. | Investing.Simplified. | #LONGTERMVISION

NVIDIA (NVDA) BUY NVIDIA (NVDA) is the undisputed king of AI hardware. Its GPUs power most machine learning models, including the systems behind ChatGPT and other generative AI tools. Investors have already seen explosive gains, but demand for AI chips shows no signs of slowing.

Nvidia or new tulipCan u find 10 differences? i'm can't.
History repeats itself.
Do u still think that future is an tech ?

NVDASuccess in forex and stocks comes from a combination of knowledge, discipline, and patience. Understanding market trends, economic factors, and company fundamentals is crucial, but equally important is controlling emotions and sticking to a well-planned strategy. Continuous learning, adapting to changing conditions, and managing risk wisely can turn opportunities into consistent growth over time. Consistency, not luck, separates successful traders from the rest.

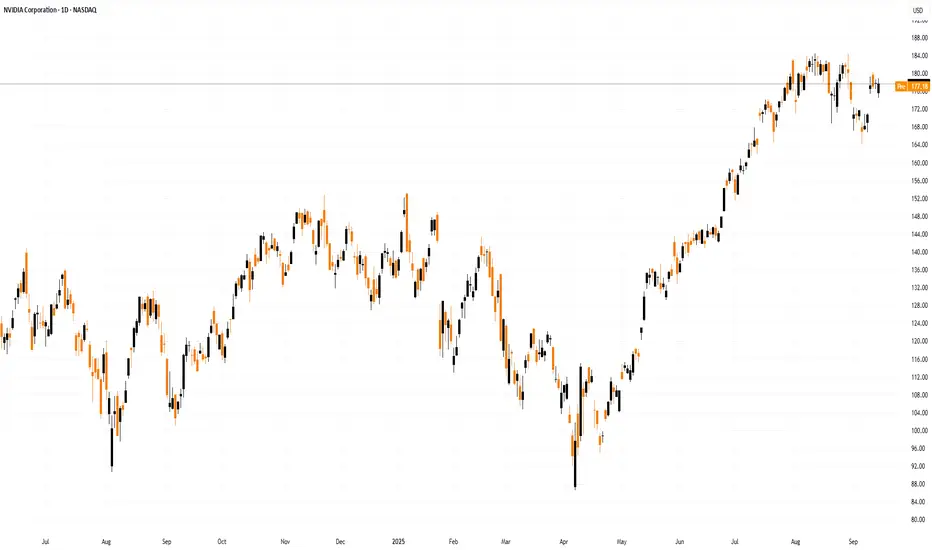
NVDA - Price ProjectionNVDA made a double top on 28/08/2025, since been making Lower Highs and Lower Lows. Althought its still just above SMA50. I see some downside in NVDA before a move up.
The question is where would I be a buyer?
I would inch in to buy for a swing trade at three levels:
- my first buy would be at around 157. This is at a long term trendline that goes back to Mar 2024
- my second buy would be 152.74. This a support level from previous double top
- my third buy would be between 147 and 148. This is a strong level and a confluence of two levels. There is gap fill at 147.90 and Fib retracement level of 38.2% at 147.55
Alternatively, my thesis will be invalid if NVDA close above 184.

Is Nvidia preparing for a reversal?On July 23rd I suggested that Nvidia had reached my take profit zone (T1) and may be preparing for a reversal. Since then price has stalled in my T1 range.
Is Invidia preparing for a reversal? Let me know what do you think?
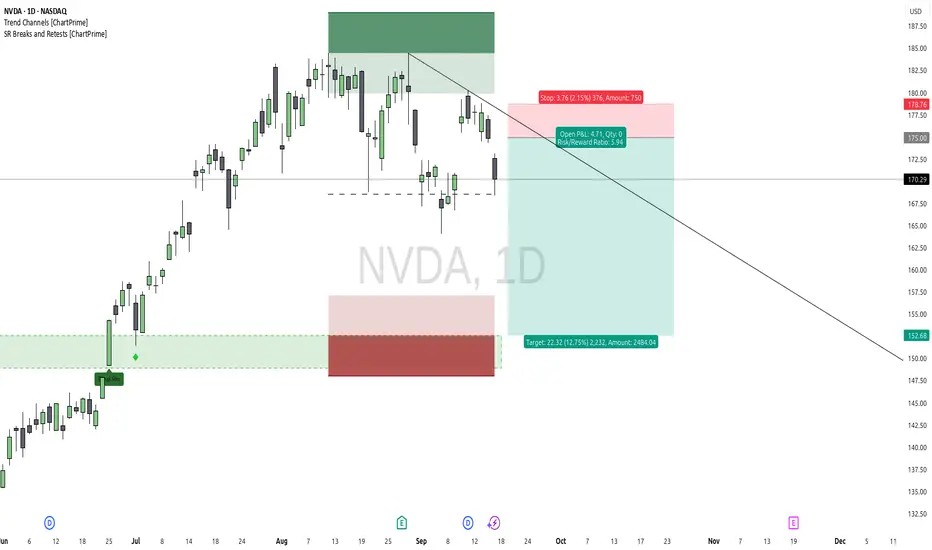
$NVDA: The River Changes Course - A Mean Reversion IdeaThe Technical Landscape
Our prior long setup on NASDAQ:NVDA was invalidated, providing us with the invaluable information that the bullish momentum has stalled. Following the Fed's announcement, the market's breath has changed. We now see a potential downtrend forming on the daily chart, with price creating lower highs and respecting a new descending trendline. The bears, who have been slumbering, appear to be waking up.
Instead of fighting this new current, we look to flow with it. The thesis is no longer about bullish continuation, but about a potential reversion to the mean. Price has a memory, and we are targeting a return to the scene of the previous major breakout, the demand zone around the $152 level. This is simply one piece of the puzzle, viewed without bias or ego.
The Philosophy - Listening When The Market Speaks
The trend is your friend, until it isn't. Our job is not to predict when the friendship will end, but to recognize when the dynamic has changed and act accordingly.
Our previous attempt at a long wasn't a failure; it was the market telling us, at a very small cost, that our hypothesis was incorrect for the current conditions. A limitless trader embraces this information with gratitude, for it protects us from the much greater cost of being stubborn. We are not "flipping" from bull to bear out of emotion. We are simply listening, adapting, and aligning with the price action that is presenting itself right now. Don't be a salmon, stubbornly fighting a new and powerful current. A limitless trader considers all outcomes, and right now, the path of least resistance appears to be pointing down.
An Illustrative Setup
Style: Short / Mean Reversion
Entry: An area of confluence around $175, near the descending trendline resistance.
Stop Loss: A defined stop above recent highs and trendline resistance at $178.75. If price breaks this level, our bearish thesis is invalidated.
Take Profit: Targeting the area of prior breakout, around $152.50.
Risk/Reward: Approximately 1 : 5.9
A safer, more conservative entry could be sought on a break and hold below the $168 support level, but always remember to manage your own risk based on your personal strategy.
Disclaimer: This is not financial advice. It is for educational and informational purposes only. Please conduct your own research and manage your risk accordingly.
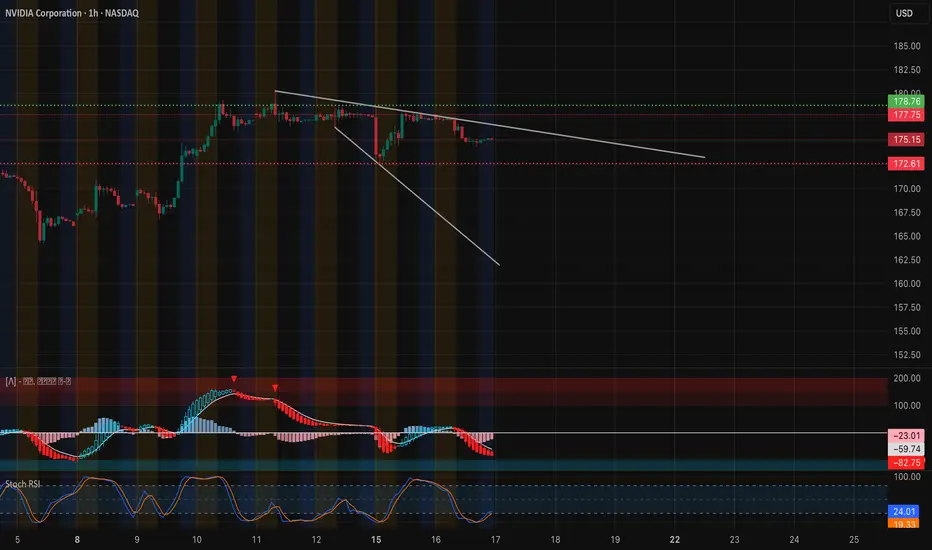
NVDA: Testing Key Support After Sharp Drop –Swing & Scalp Sep 171-Hour Chart Technical View
Nvidia’s 1-hour chart shows clear short-term weakness. After failing near $182.5, price has been trending down and now hovers around $175.15. MACD remains deep in negative territory and Stoch RSI is oversold, hinting at potential for a short-term bounce but no confirmed reversal yet.
* Immediate Support: $172.5 (high-volume node and HVL 09/19)
* Secondary Support: $170 and $166.5
* Resistance: $177.7 and $182.5 are key overhead levels for any rebound
Price is trading under both 9 and 21 EMA, confirming a short-term bearish structure until a clean reclaim above $177.7.
GEX & Options Flow
Options positioning highlights mixed sentiment with cautious call interest:
* Call Walls: $177.5 (2nd call wall), $182.5 (highest positive NET GEX / gamma resistance), and $185.
* Put Walls: $170 and $165 (significant downside hedges).
* GEX Bias: Around 23.5% calls with IVR at 5.7 (IVx ~40.8). This relatively low IVR shows option premiums are moderate despite the pullback.
Dealers may support the $172.5 area, but below that, gamma exposure flips bearish and accelerates downside risk.
Trade Thoughts & Suggestions
* Swing Idea: Aggressive buyers can nibble near $172.5 with a tight stop below $170, aiming for a relief bounce to $177.7–$182.5.
* Scalp Idea: Short bounces into $177.7 resistance if momentum stays weak, or scalp quick long entries off a confirmed double-bottom near $172.5.
* Bearish Scenario: A decisive break under $170 could accelerate selling toward $166.5.
Quick Take
NVDA is in a corrective phase. For Sept 17, all eyes are on $172.5. Holding that level can spark an oversold bounce; losing it could open the door to deeper downside.
Disclaimer: This analysis is for educational purposes only and does not constitute financial advice. Always do your own research and manage risk before trading.