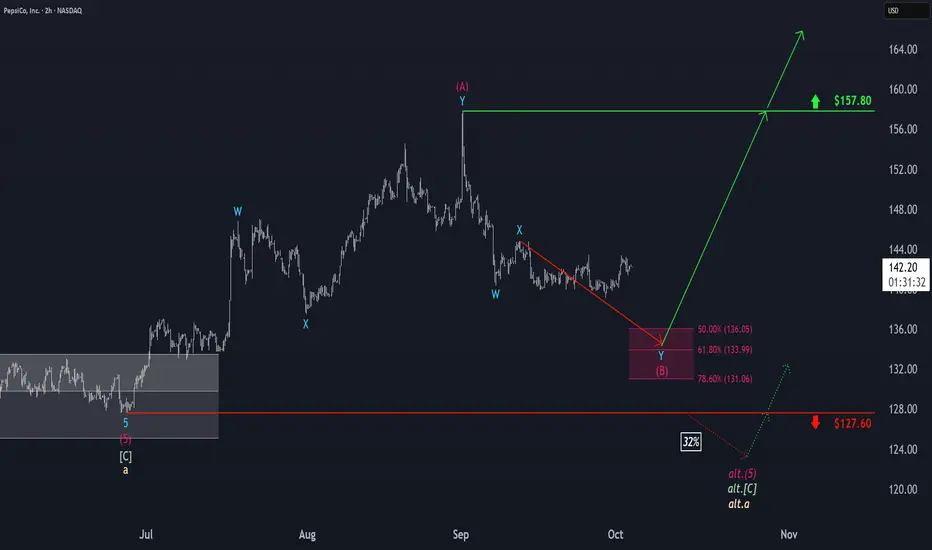
PepsiCo: Approaching the Target ZonePepsi shares have traded mostly sideways within a broader range over the past two weeks. Our primary outlook is that the ongoing magenta wave (B) will continue to move lower, eventually bottoming within the similarly colored long Target Zone between $136.05 and $131.06. From that point, we expect the broader upward trend to resume. However, a sustained move below the $127.60 support level would trigger our alternative scenario (probability: 32%). In this case, the larger beige wave alt.a would remain incomplete, suggesting the correction phase could be deeper and longer than projected in the primary scenario.
PEP trade ideas
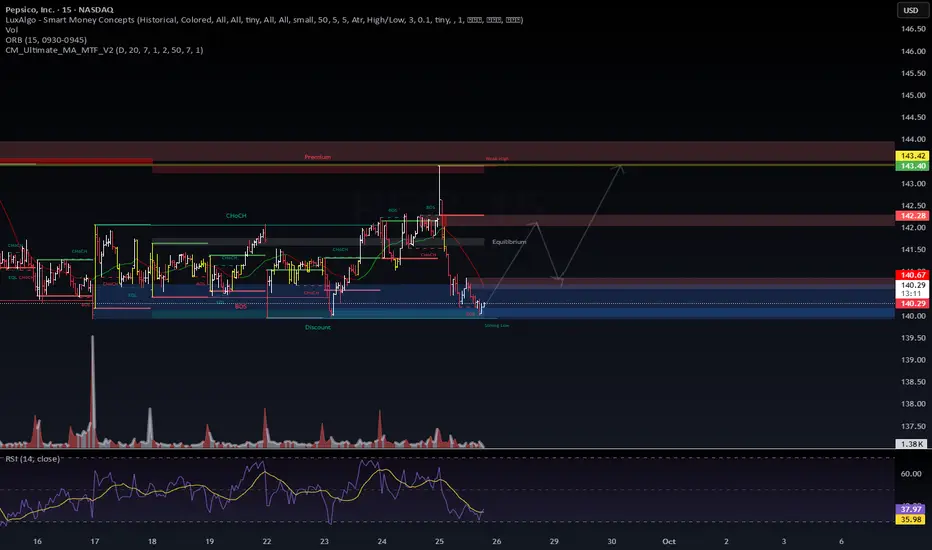
PEP: Discount Zone Test – Will Buyers Defend?NASDAQ:PEP | Discount Zone Test – Will Buyers Defend?
Price is sitting inside the discount / strong low zone (~140) after a sharp selloff.
Scenarios:
🟢 Bullish case: If buyers defend this level, expect a reclaim of 142.28 equilibrium, which opens a move toward the 143.40–143.42 premium zone.
🔴 Bearish case: Failure to hold this low risks a sweep of liquidity below 140 before any reversal attempt.
Confluence:
RSI near 35 = oversold territory → potential reaction zone.
Clear BOS/ChoCH structure showing institutional footprints.
Volume spikes around breaks = liquidity hunts.
Bias: Watching for confirmation bounce in discount zone before scaling in.
📌 Manage risk. Not financial advice.
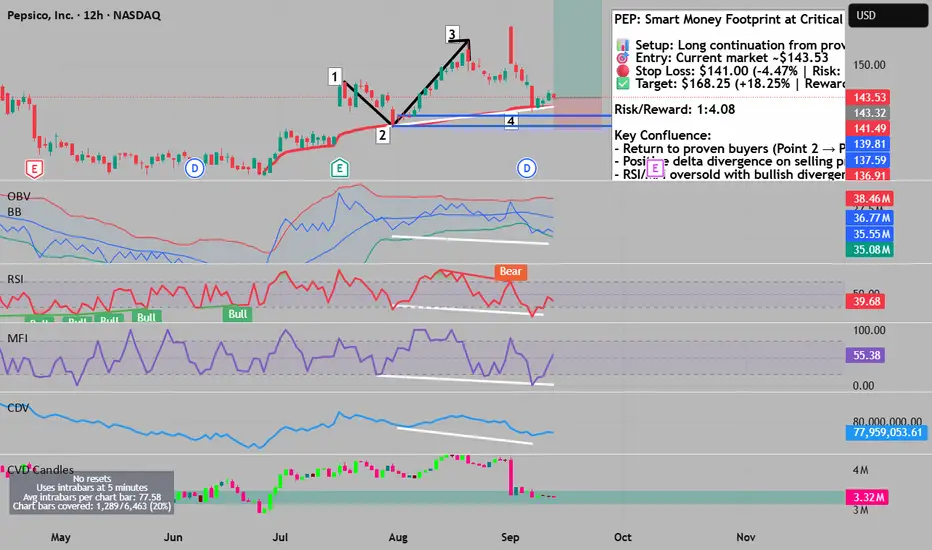
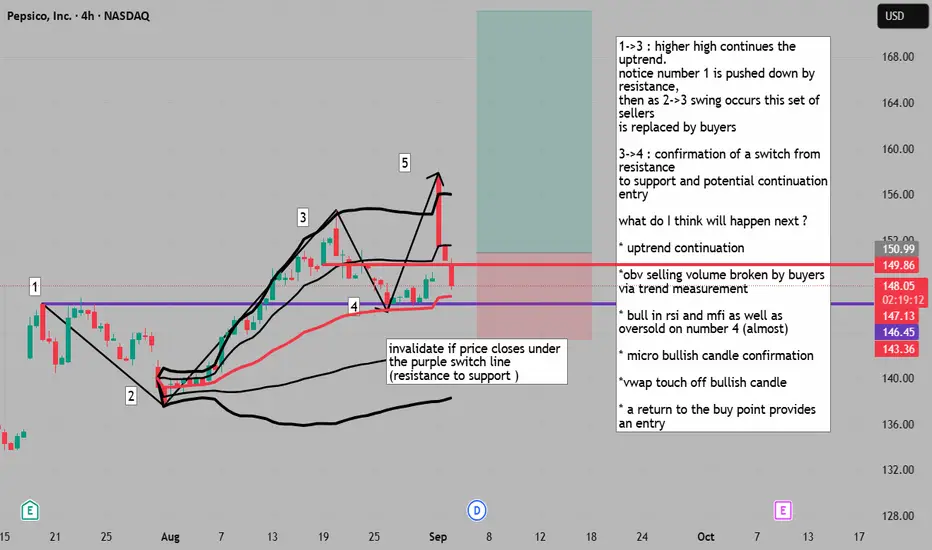
Footprint Data Reveals Stealth Buying at Critical Support### Market Structure & Context
PepsiCo has demonstrated a robust uptrend architecture spanning May through September, establishing a clear sequence of higher highs and higher lows. The current retracement presents a textbook opportunity as price revisits a proven demand zone where institutional buyers previously stepped in with conviction.
The numbered wave structure reveals critical market psychology:
- Point 1 → 3: Breakout confirmation with close above initial resistance
- Point 2: Established as verified institutional accumulation zone
- Point 3 → 4: Natural retracement returning to test proven buyers
### Volume Footprint Intelligence
The granular footprint analysis exposes sophisticated accumulation patterns invisible on traditional charts:
Monday Sept 8: Despite aggressive selling with multiple imbalances, price rejected and closed above a buying imbalance zone. The positive delta on a bearish bar signals hidden institutional absorption of retail selling.
Tuesday Sept 9: Three stacked bullish imbalances formed while price pushed lower—classic absorption pattern. Negative delta divergence confirms smart money accumulating into weakness.
Wednesday Sept 10: Clean bullish close above imbalance with supporting positive delta—accumulation phase transitioning to markup.
Thursday Sept 11: Price conquered the value area high/low of previous three sessions with dual bullish imbalances and positive delta confirmation.
### Multi-Timeframe Oscillator Divergences
The technical mosaic presents compelling bullish divergences across multiple indicators:
- RSI & MFI: Both oscillators display oversold conditions at Point 4 while price forms a higher high versus Point 2—textbook positive divergence
- OBV: Piercing the lower Bollinger Band deviation signals exhausted selling pressure
- CDV: Price returned to pre-discovery consolidation zone—historically a high-probability reversal area
### Anchored VWAP Confluence
The anchored VWAP from the momentum initiation point provides dynamic support precisely at Points 2 and 4, confirming this level as algorithmically significant for institutional participants.
### Risk Management Framework
Entry Zone: $143.53 (current market price)
Stop Loss: $141.00 (-4.47% from entry | Risk: $750 per contract)
Take Profit: $168.25 (+18.25% from entry | Reward: $2,616 per contract)
Risk/Reward Ratio: 1:4.08 — exceptional asymmetric opportunity
Position Sizing: With a 4.08:1 reward-to-risk ratio, this setup offers substantial upside with controlled downside. Size position according to account risk tolerance (1-2% max risk recommended).
### Trade Execution Strategy
Entry Tactics:
- Primary entry at current levels ~$143.53
- Scale-in opportunity on any dip toward $142.50
- Confirmation entry on break above $144.50
Exit Strategy:
- Initial Target: $150.00 (psychological level) — consider taking 25% profits
- Secondary Target: $157.00 (halfway point) — reduce another 25%
- Final Target: $168.25 — exit remaining position or trail stop for continuation
Stop Management:
- Initial stop at $141.00 (below Point 2 support)
- Trail to breakeven once price reaches $150.00
- Trail to $145.00 when price hits $157.00
### Probability Assessment
This setup combines multiple high-conviction factors:
✅ Trend alignment (5-month uptrend intact)
✅ Volume structure confirmation (positive delta divergences)
✅ Technical indicator confluence (4+ bullish signals)
✅ Institutional footprint patterns (absorption visible)
✅ Risk/reward extremely favorable (1:4.08)
✅ Stop placed below critical support structure
The convergence of footprint intelligence, traditional technical analysis, and exceptional risk/reward creates an institutional-grade opportunity. The 4.08:1 reward-to-risk ratio means even with a 25% win rate, this strategy remains profitable long-term.
⚠️ Disclaimer: This analysis represents technical observations only. Always conduct your own due diligence and manage position size according to your risk tolerance.
$PEP Bullish SetupNASDAQ:PEP Bullish Setup 🥤📈
PepsiCo has pulled back sharply from $180+ to $140s, testing long-term channel support. RSI is rebounding from oversold, but price action still suggests some downside chop before a full reversal. That said, the setup is attractive: Pepsi is a global staple brand with pricing power, strong cash flows, and decades of dividend growth (aristocrat status). Even in inflationary environments, demand for beverages + snacks holds steady. At ~20× forward earnings, valuation is more reasonable than the highs. The technicals suggest one more shakeout toward ~$130–135, but the bigger picture points to a reversal higher with a long-term path back toward $170–180. Buy the weakness, collect the dividend, ride the channel.
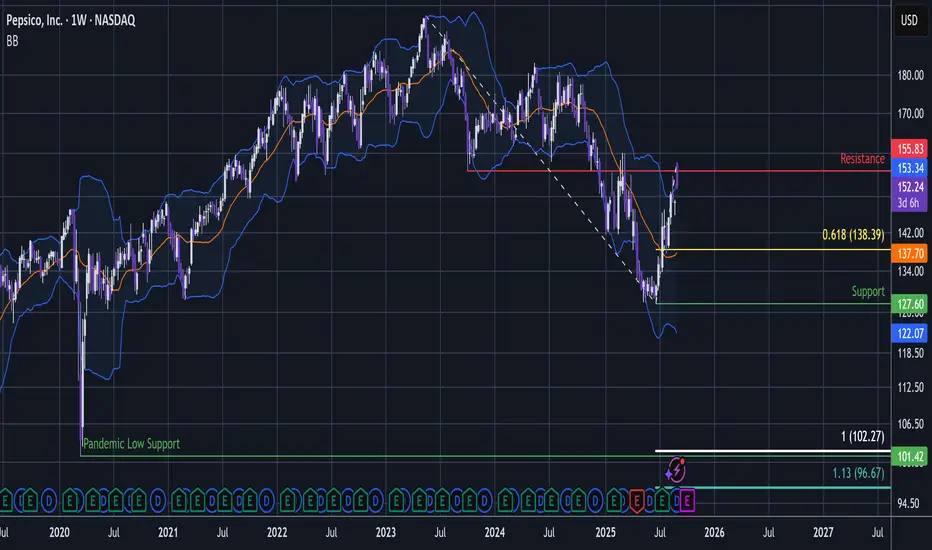
PEP - Good News For Dumb Money: Pepsico Prints A HTF Sell Signal"Good news" for non-technical buyers as "Elliott takes aim at PepsiCo with $4 billion stake; shares rise."
But PepsiCo is printing a nasty Gap-up-dump-down shakeout pattern above resistance as September opens.
This appears to be a terminal shakeout that can send PEP tumbling.
Up on the week chart, the shakeout has pierced into higher liquidity zone above October 2023 resistance.
So with that "hi 5" done and traders shaken out, this can no begin the next wave down.
Also notice how it pops above the Bollinger Bands - signalling a relative trend extremity.
...
This shakeout looks like it may be signalling a major top here.
So this might just be a HTF retracement peak leading to another major wave down.
If it is then a 1:1 Golden Window extension (1 - 1.13) could see PEP get all the way back to 2020 lows to potentially complete a 3 wave correction.
From there might be a great buy.
So I will give 3 targets for this trade.
1) At or slightly above the 0.618 @ $138.39 for shorter term trade
2) At or slightly above the support low @ $127.6 for mid term trade.
3) At or slightly above the Pandemic Low support @ $101.42.
Invalidation: above today's high @ $154.53.
News from REuters:
"Elliott Management on Tuesday disclosed a $4 billion stake in PepsiCo (PEP.O), opens new tab, launching a campaign to restore growth and boost the beverage maker's share price.
The stake in PepsiCo, one of Elliott's biggest holdings, comes as the company tackles choppy demand for its snacks business and pursues a shift to healthier drinks and sodas to address changing consumer preferences."
This analysis is shared for educational purposes only and does not constitute financial advice. Please conduct your own research before making any trading decisions.
PEP (daily): long the cup and handlePepsi long based on technicals: looks to be resolving the handle part of the cup and handle, holding trend from June lows and riding the 20EMA. Williams ticking up, Neutral RSI has room to run, MACD ticking up. Increased tie-up with Celsius seen as positive. This could absolutely take off on a move above 153ish.

PEP CFD: I bought Pepsico stock CFDI bought PEPSICo stock now, will explain the reason in the upcoming videos.
Disclaimer: This is not an investment or financial advise, this content is for education only.
idea for return to support being a cheap entry 1->3 : higher high continues the uptrend.
notice number 1 is pushed down by resistance,
then as 2->3 swing occurs this set of sellers
is replaced by buyers
3->4 : confirmation of a switch from resistance
to support and potential continuation entry
what do I think will happen next ?
* uptrend continuation
*obv selling volume broken by buyers via trend measurement
* bull in rsi and mfi as well as oversold on number 4 (almost)
* micro bullish candle confirmation
*vwap touch off bullish candle
* a return to the buy point provides an entry
PEP 20/08/2025 LongPrice on the monthly chart is trying to close above the 100MA after a long period of downtrending. If the candle closes, it will confirm the return of the uptrend

PEP wedge breakout and 200day sma cross [/imag
NASDAQ:PEP is ready to rip. Bulls just need to step in here so it can go up to 160
I bought in at 135 area, holding shares LT, but there could be opportunities for some swing trading on a solid daily candle close above the wedge.

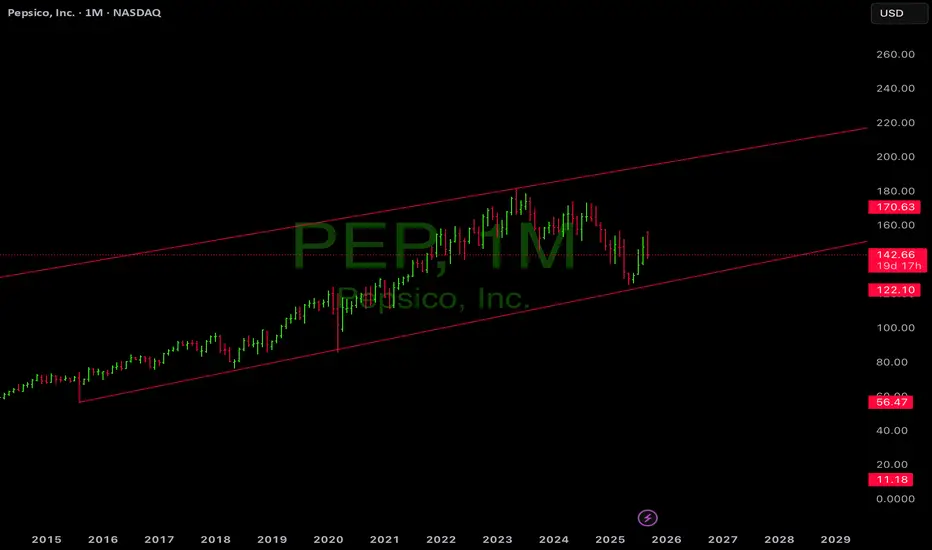
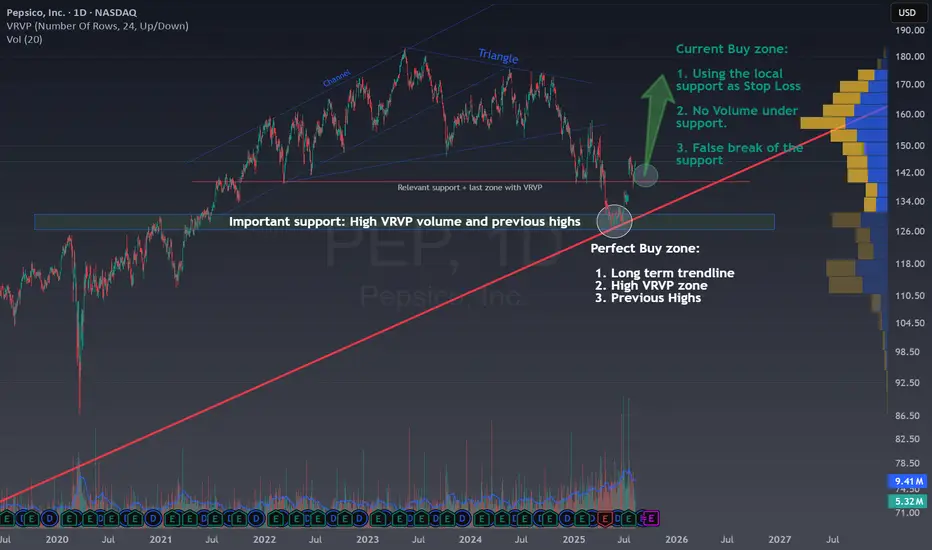
Pepsico Yielded 10,5% For 30 Years And Now Is A BargainPepsiCo Yielded 10.5% for 30 Years and Is Now a Bargain
This is an idea for short-term investors like me who are willing to make a 20% gain in the upcoming weeks , but it is also a long-term entry for those who want to include PepsiCo in their portfolio to enjoy a substantial dividend and the potential to continue experiencing 10.5% annual growth , as it has for the past 30 years.
In the chart above, you can see PepsiCo’s 30-year trendline, which is very important because as long as PepsiCo respects this trendline, a 10.5% yearly growth is expected.
During 2022 and 2023, a channel developed marking the stock’s upward path.
In September 2023, the channel was broken, signaling that in the coming months or years, we might not see new highs.
After that breakout, a triangle appeared, which is usually a continuation pattern, giving hope to bullish investors.
However, as happens with about 30% of triangles, this one broke on the less common side, confirming that PepsiCo was not ready to continue growing .
In fact, breaking this triangle confirmed that we were going to see the price testing the previous resistance area, where there was a high volume of concentrated buying around the $128–130 zone.
For traders familiar with chart patterns, this meant a perfect 15% drop to take advantage of, and there was even an ideal pullback to the triangle, offering a second chance to join the imminent decline.
⭐ Current situation
After the channel breakout that offered a 10% gain and the triangle breakout that yielded 15%, I’m now convinced we’ll have opportunities in the opposite direction, with potential buys that could return 20% in just a few days.
Buying near the red support zone , around $140, offers the chance to set take profits at 20% (~$170) or at the $150 area for a quicker gain.
The risk is minimal, if the price breaks below the red support, it’s better to stay out and look for other opportunities. So, in this setup, I would place the stop loss at $136 (less than 3% risk), just below a recent gap that should offer some protection.
Therefore, we are aiming for a 20% profit while risking only 3%. The risk-to-reward ratio is 7 to 1, which is absolutely incredible and definitely worth taking advantage of.
💬 Does this setup align with your view on NASDAQ:PEP ?
🚀 Hit the rocket if this helped you spot the opportunity and follow for more easy, educational trade ideas!
PEPsico is looking to pop up further NASDAQ:PEP had a strong gap up, and with the latest completion of the cup and handle, it is clear that the upside is likely coming back. Bullish engulfing candle was seen as a strong contender for continued upside. My guess is with the positive momentum, the stock is likely to break above the downtrend channel.
Long-term MACD is strong and histogram is positive. Crossover at the bottom confirms the reversal.
Stochastic oscillator shows oversold signal in.
23-period ROC is positive and DMI shows strongly firm in bullish strength.
Key immediate support is at 138.00 and 168.12 will be our major target.

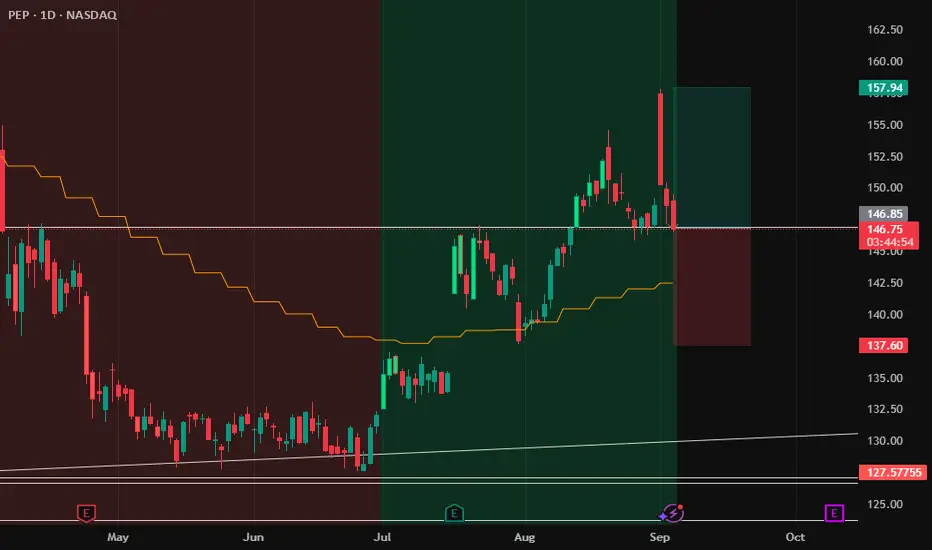
PepsiCo (PEP) Stock Rallies 7.4% Following Earnings ReportPepsiCo (PEP) Stock Rallies 7.4% Following Earnings Report – What Comes Next?
Yesterday, PepsiCo Inc. (PEP) released its quarterly earnings report, which significantly exceeded market expectations:
→ Earnings per share (EPS) came in at $2.12, surpassing the forecast of $2.02.
→ Gross revenue reached $22.7 billion, above the projected $22.3 billion.
In addition, PepsiCo reaffirmed its full-year guidance: the company expects earnings per share to remain virtually unchanged compared to the previous year, while organic revenue is anticipated to grow by a few percentage points.
Executives also outlined development plans for their brand portfolio, emphasising a focus on the growing demand for healthier snacks and a strategic initiative to reduce costs.
These factors contributed to PepsiCo Inc. (PEP) becoming one of the top-performing stocks on the market yesterday – its price surged by 7.4%, reflecting strong investor sentiment. What could come next?
Technical Analysis of PEP Stock Chart
A strong bullish candle formed on the chart yesterday, signalling a spike in demand:
→ The session opened with an impressive bullish gap, decisively breaking through the July resistance level around $137.
→ The share price continued to climb steadily throughout the day, forming a long-bodied candle.
→ The session closed near its high, confirming sustained upward momentum.
Notably, on 27 June (highlighted by an arrow on the chart), the stock posted gains on the highest trading volume of 2025 so far (according to Nasdaq data), which can be interpreted as a potential sign of sentiment reversal driven by institutional investors.
However, the broader picture remains bearish. PEP stock continues to trade within a long-term downward channel, shaped by declining demand for PepsiCo products and intensifying market competition.
Given the above, the following scenario should not be ruled out: the upper boundary of the long-term descending channel may act as resistance in the near term. As the post-earnings euphoria fades, the price could undergo a pullback – for instance, towards the $140 level, which previously served as support.
At the same time, the strong fundamental backdrop, reflecting the company’s operational success, could fuel persistent bullish interest. This may empower buyers to challenge and potentially break the long-standing downtrend in PEP shares.
This article represents the opinion of the Companies operating under the FXOpen brand only. It is not to be construed as an offer, solicitation, or recommendation with respect to products and services provided by the Companies operating under the FXOpen brand, nor is it to be considered financial advice.
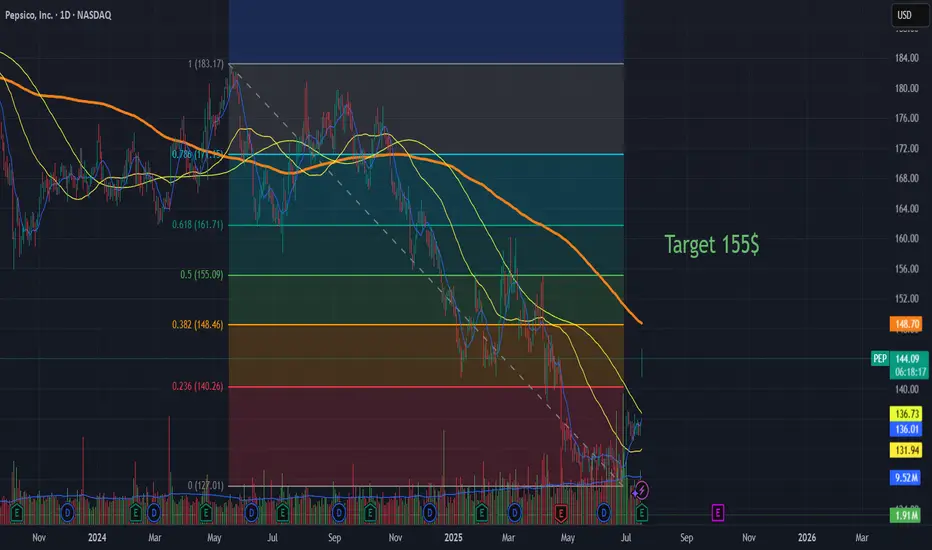
Pepsi can retrace to 155 in short termVery short post:
Pepsi NASDAQ:PEPS had a very good earnings call and based on fb retracement, this will retrace to 155 soon. It has potential to go abive that if the reversal is confirmed.
PEP is in the Wyckoff Accumulation phaseThis Week (July 8 - 12):
Support: The recent consolidation shelf around $130.00 is the first line of defense. The absolute low and our line in the sand is the Selling Climax low at $127.60.
Resistance: The 20-week moving average at $138.30 is the immediate ceiling it needs to break through.
Next Month (July/August):
Support: The $127.60 low remains the critical long-term support.
Resistance: If it can clear the $140 level, the next major area of resistance to watch is around $150.00, a previous support zone that will likely attract sellers.


PEP Long-Term Buy Opportunityhi Traders,
The chart presents a compelling long-term buying opportunity for PepsiCo (PEP). The price is currently sitting in the identified "buy zone", a historically reliable area for accumulation. If we experience further dips, it’s still considered a buying opportunity all the way down to the 200 EMA, which currently sits at $120.62.
Historically, every time PEP’s price approached or touched the 200 EMA on the monthly time frame, it marked a major bottom and a strong reversal point. We believe this time is no different—the long-term trend remains intact and the fundamentals continue to support value.
Additionally, the RSI has reached oversold conditions on the monthly chart, which is rare for this stock and signals a potential undervaluation. Oversold RSI levels have consistently aligned with excellent long-term entry points.
Our target is the previous all-time high (ATH) of $196.48, with expectations to break beyond it as the recovery unfolds. This setup offers a favorable risk-to-reward ratio for long-term investors and swing traders alike.
Summary:
✅ Price in the buy zone
✅ Buying opportunity down to the 200 EMA ($120.62)
✅ Monthly RSI in oversold = undervaluation signal
🎯 Target: Previous ATH and beyond ($196.48+)
Long-term bulls, this is your moment.
Do you agree? Leave your comments!

Update on $PEP: The price finally made its move. Breakout of our Level 0 and confirmed bullish crossover on the daily chart (that is still bearish)
Massive Volume coming.

[PEP] Pepsi investmentI took my first and main position on NASDAQ:PEP just before this little spike.
My target is very high because I want to hold this stock for a while and maybe I will hold even more than what you see on the graph.
Strong confidence for the long run ...
Great Trade !


$PEP Bullish Swing Setup – Oversold & Ready to Rebound ?PepsiCo ( NASDAQ:PEP ) is sitting at a major long-term support after a deep pullback — this could be a strong opportunity for a risk-defined bounce. Here's what the chart is signaling:
🔹 Entry Zone: Price is currently near $128 — a historically significant level that acted as resistance in the past and now aligns with a potential support flip.
🔹 Oversold & Stretched: After a consistent downtrend, NASDAQ:PEP is looking oversold. A bounce is likely as sellers exhaust and dip buyers return at this key level.
🔹 Reversal Structure Building: Early signs of a bottoming pattern are emerging, with potential higher lows forming. If the current structure holds, we could see a climb toward the next resistance zones.
🎯 Targets:
TP1: $154 – minor resistance and previous consolidation zone.
TP2: $197 – major resistance and range high, aligning with earlier highs.
🛡️ Stop Loss: Below $102 — invalidates the support thesis and breaks structure.
💡 Why Price May Rise:
PEP is a defensive name with strong fundamentals, often benefiting during uncertain macro cycles.
Valuation is now more attractive after the sell-off.
The setup offers a high reward-to-risk ratio, especially if broader markets stabilize.
⚖️ Setup Summary:
Entry: ~$128
SL: $102
TP1: $154
TP2: $197
📌 Watching for confirmation with volume or bullish candle structure over the next few sessions.
🚫 Not financial advice — just a technical outlook based on structure and probability.

PEP Earnign call target 158 and 160 The main reason it becuase if we see on the las two quarters on earnings they did not beat the stock has been down -12 percent in 3 months.
Disclaimer- it a opinion

PEP – Bullish Divergence at Weekly DemandPepsiCo (PEP) has retraced into a key weekly demand zone, where price previously launched long bullish legs. At the same time, a bullish divergence is forming between price and RSI, suggesting selling momentum may be weakening.
Structure has clearly shifted bearish over the past two years, with multiple breaks of structure (BoS). However, the current setup shows strong confluence for a potential mean reversion or reversal swing.
Two key supply zones are mapped:
First target (5:1 R:R) at the $141 area — recent supply.
Second target (12:1 R:R) near $162 — major macro supply.
