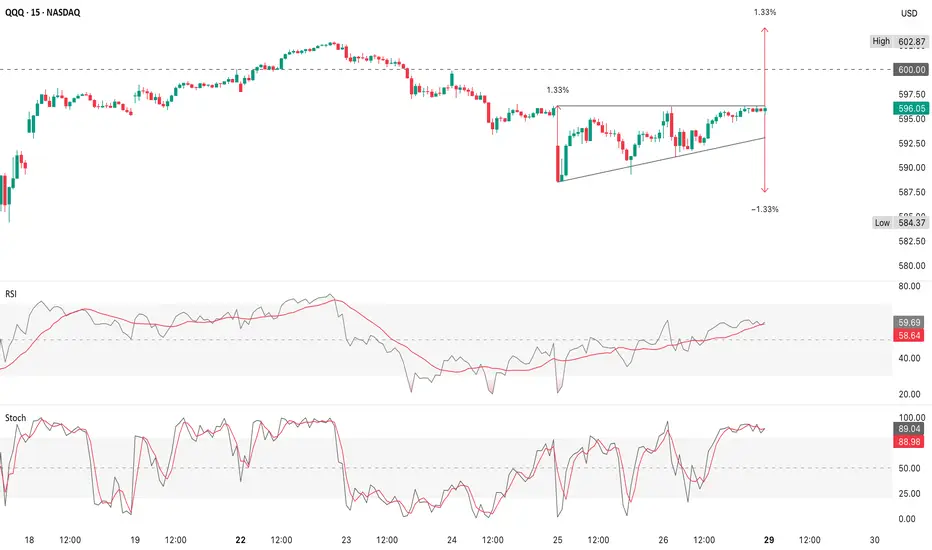
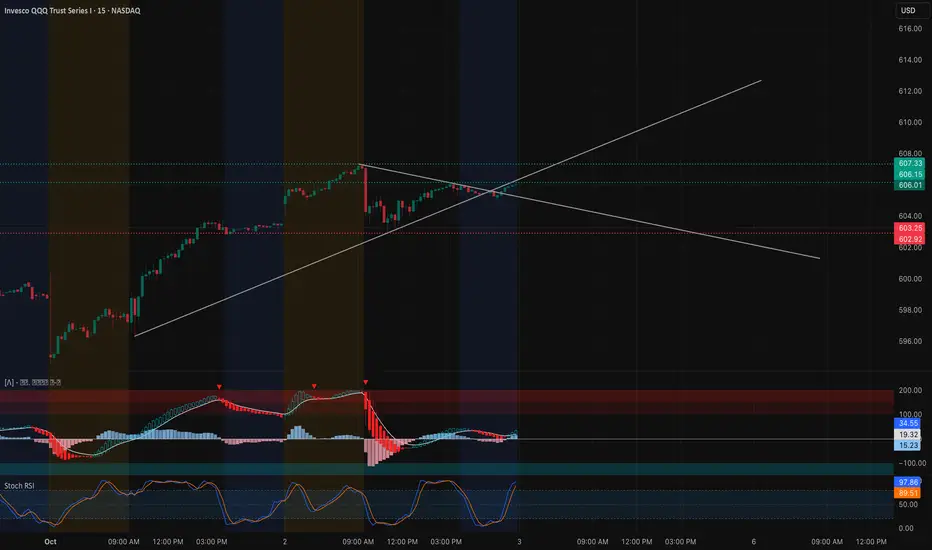
QQQ Springboard PatternThe 15m intraday chart suggests a rising wedge/ascending triangle forming under $597–$598 resistance
The measured move shown is about ±1.33% from the breakout
That puts upside potential near $603 (recent high) or downside risk toward $584–$585
RSI is around 59 - climbing, but not overbought yet
Stochastic is very elevated (~89), which often signals short-term exhaustion
A break above $598–$600 could retest highs at $602–$603
A rejection here could unwind back to $590 or lower support ($584–$586)
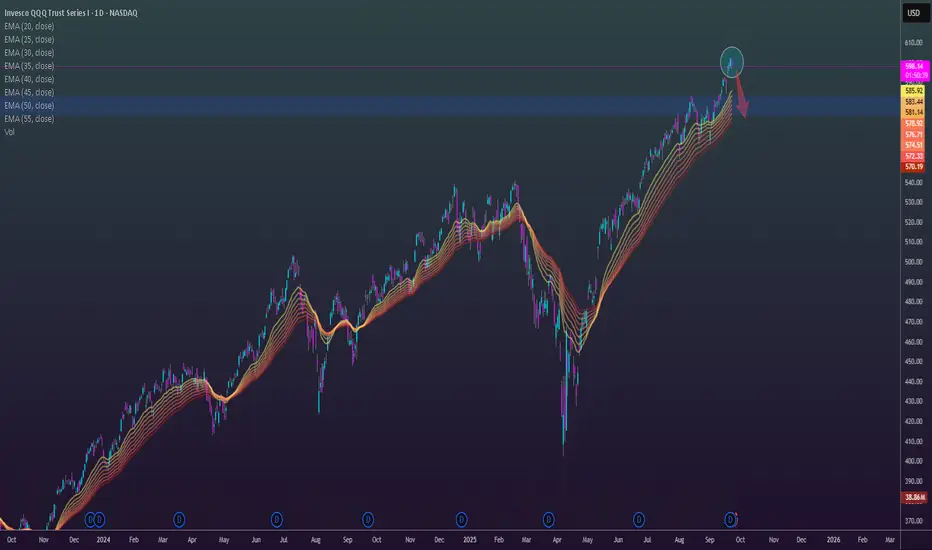
QQQ is in a well-established uptrend
Price has respected moving averages & envelopes for months, with pullbacks shallow (~4–5%) & quickly bought
QQQ is pressing right under the $602–$609 resistance
A weekly close above ~$609 would confirm continuation, with no major overhead resistance
A stall here could lead to mean reversion toward the 20d MA (~$586) or even the 20 MA if sellers press harder
The character of pullbacks (quick, shallow, bought up) favors continuation unless a sharp catalyst breaks the pattern
The key watch is does QQQ consolidate and push through $609, or does it fail and retest $586–$590 support?
The primary trend is up (bulls in control)
$602–$609 = breakout = continuation, rejection = mean reversion to $586–$590
No technical damage unless QQQ breaks below ~$572
QQQ is in a strong uptrend, but this week hinges on the $602–$609 resistance
A breakout = trend extension
A rejection = routine pullback to support
QQQ trade ideas
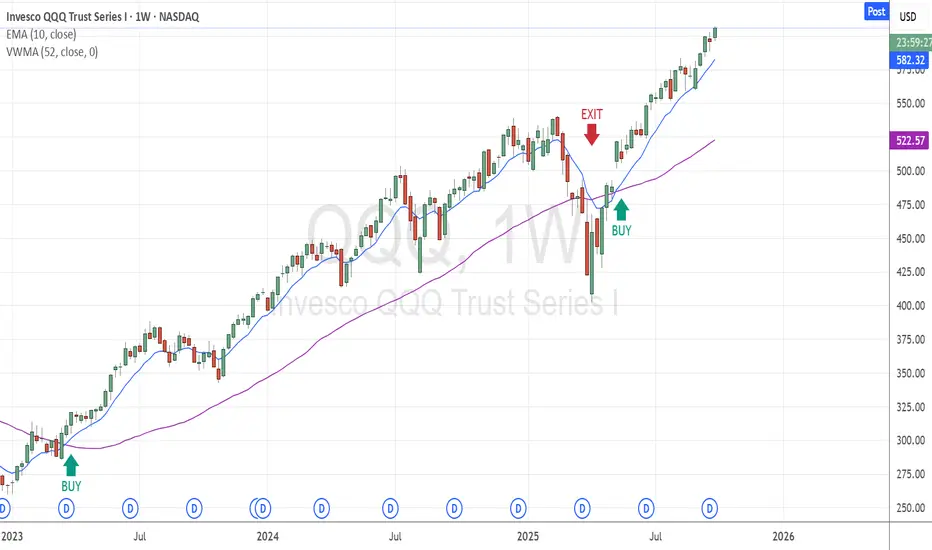
Simple Investment Strategy (Long Term only)This strategy is designed for long-term investors using a simple, two-indicator setup on the weekly chart:
• VWMA (Volume-Weighted Moving Average) – 52-period
• EMA (Exponential Moving Average) – 10-period
✅ Entry Signal (Buy)
• Enter a position when the 10-period EMA crosses above the 52-period VWMA.
This crossover suggests a potential upward trend supported by volume.
❌ Exit Signal (close Long Position)
• Exit the position when the 10-period EMA crosses below the 52-period VWMA.
This indicates a possible trend reversal or weakening momentum.
💡 Additional Note
• When the 10 EMA is below the 52 VWMA, it's best to stay in cash and wait patiently for the next bullish crossover. This helps avoid false entries and keeps you aligned with the broader trend.
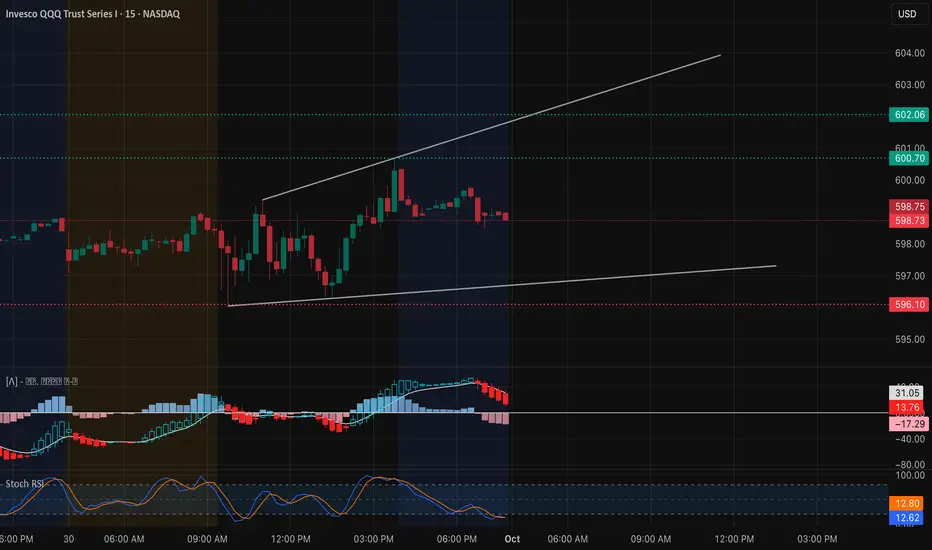
QQQ Oct. 1 – Holding $600, Gamma Pin in Play Intraday View (15-Min Chart)
QQQ has been grinding higher but is now consolidating just above the key $600 handle. The wedge channel shows buyers defending dips, though MACD and Stoch RSI are cooling off.
* Support Levels: $598.75, $596.10, $592.78
* Resistance Levels: $600.70, $602.06, $604.01
* Indicators: MACD histogram rolling red, signaling momentum slowing. Stoch RSI back near oversold, suggesting dip-buyers may step in at lower supports.
📌 Intraday Thought (Oct. 1): As long as $598–$600 holds, QQQ can push for $602+. A breakdown under $598.7 risks testing $596 and below. Intraday scalpers can play the $600 line for both quick bounce longs or rejection shorts.
Options & Swing View (1H + GEX)
Options flow paints a gamma box around $598–$602.
* Upside: Gamma wall at 602, with extensions toward $604. A break above 602 could open momentum toward 605+.
* Downside: Heavy put support at $595, with deeper levels down near 590.
This positioning suggests QQQ may chop between 598–602 near-term unless a catalyst pushes it out of range.
* Bullish Play (Oct. 1): Calls or spreads targeting $602–$605 if $602 breaks with volume.
* Bearish Play: Puts toward $595–$592 if $598 cracks.
* Neutral Play: Sell iron condors between $598–$602 while pinned.
My Thoughts (Oct. 1)
QQQ is showing a classic gamma pin scenario at $600. Market makers may try to keep price trapped here, but a strong break outside $598–$602 will dictate direction. If tech earnings or macro headlines hit, expect that gamma dam to burst and volatility to expand.
Disclaimer: This analysis is for educational purposes only and does not constitute financial advice. Always do your own research and manage risk before trading.
QQQ Tightening Up – Gamma Levels Will Decide Oct 3 Intraday Technical Outlook (15m Chart)
The QQQ closed near $606.01, coiling into a wedge formation after a strong upward push. On the 15-minute chart, the price is sitting right at a confluence of support and resistance trendlines:
* MACD: Starting to recover after a bearish dip, showing early signs of momentum turning back positive.
* Stoch RSI: Pushing back toward overbought, suggesting buyers are regaining control, but overextension risk remains.
* Key Levels: Support sits at $603–602.9, with a deeper floor at $600. Resistance is overhead at $608–610, aligning with the wedge breakout zone.
Intraday takeaway: QQQ is set for a decisive move. Above $608, it could press into $610+, but losing $603 risks a flush back into $600.
Options Sentiment & GEX Outlook (1H Chart)
Gamma exposure highlights a clear battleground for tomorrow’s session:
* Gamma Walls:
* $606–608: Major call resistance cluster and highest positive GEX zone.
* $600: Gamma pivot and HVL level — critical support where dealers may defend.
* $595–590: Heavy put walls below, acting as downside magnets if $600 breaks.
* Implications:
* Holding above $603–606 keeps price magnetized toward $608–610.
* A breakdown under $600 would trigger dealer hedging pressure, driving the Qs toward $595–590.
* Volatility Context: IVR at 17.8 is low, while options positioning skews bearish with 44.8% puts. This suggests traders are hedged defensively, which could amplify a sharp move either way.
My Thoughts & Recommendation
For Oct 3 trading, QQQ is boxed into a gamma range with clear pivot levels:
* Intraday (scalping/trading): Favor longs above $606, aiming for $608–610 breakout. Shorts become attractive on rejections near $608 with downside into $603 and $600.
* Options trading (swing/0DTE): Calls only make sense if QQQ breaks $608 with volume, targeting $610+. If QQQ loses $603 and especially $600, puts toward $595 offer better risk/reward.
Bias heading into Oct 3: Neutral with breakout potential — $608 is the level that decides.
Disclaimer:
This analysis is for educational purposes only and does not constitute financial advice. Always do your own research and manage risk before trading.
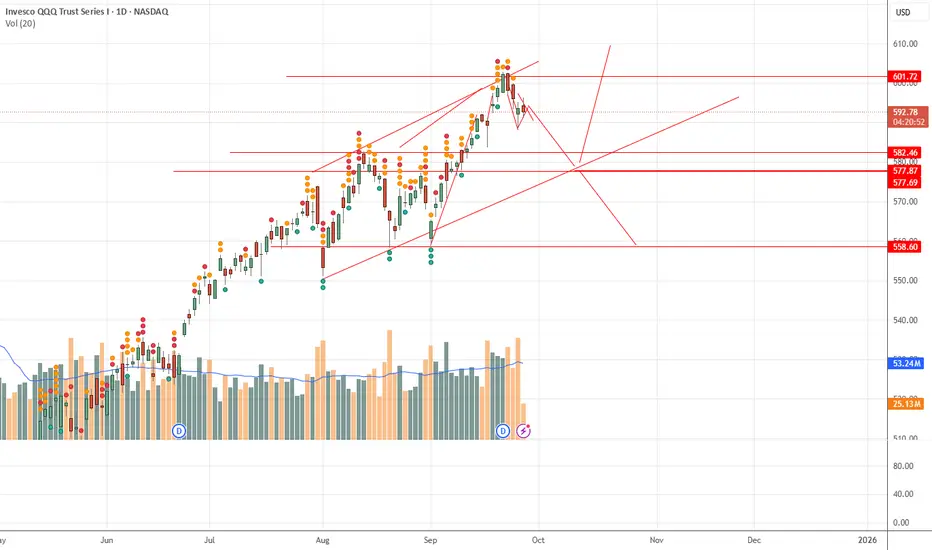
QQQ Daily AnalasysQQQ is in a short-term pullback inside a long-term uptrend. Watch 582–578 support for signs of a bounce. A breakdown could target 559–560. Upside resistance is 594–602.
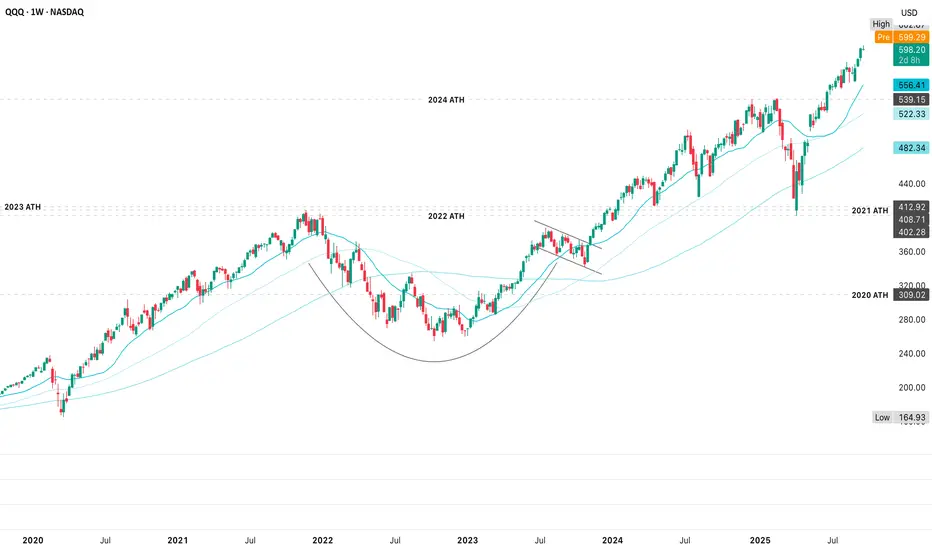
QQQ SEP-OCT 2025QQQ is consolidating near the upper resistance zone after hitting 5.5B volume. Strong supports are at 570 and 530, with a critical open gap around 490 that could act as a magnet if momentum fades. Institutional flows show distribution near highs, but trend support remains intact.
Upside target: 605 if resistance breaks with strength
Downside target: 530, with risk of 490 gap fill if weakness persists
#QQQ #globaltrade #investment #investing #stockmarket #wealth #realestate #markets #economy #finance #money #forex #trading #price #business #currency #blockchain #crypto #cryptocurrency #airdrop #btc #ethereum #ico #altcoin #cryptonews #Bitcoin #ipo

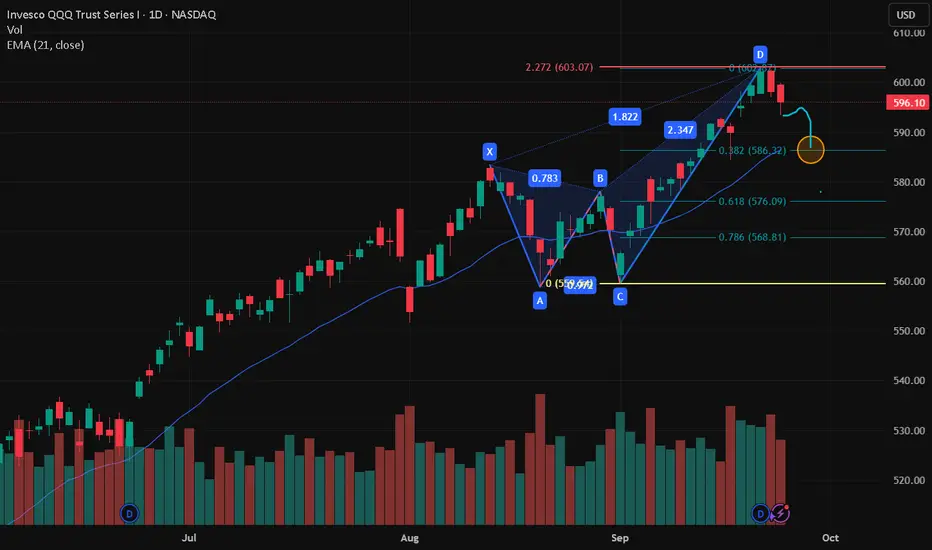
$QQQ completed 2.272% extensionNASDAQ:QQQ completed a 2.272% extension and reached the max of the Harmonic Pattern. I'm a Long only investor. I have sold some NASDAQ:QQQ every day since $593 to raise cash.
Huge Dark Pools and Prints... Will this time be Different?Stock Market Forecast | Mag 7 TSLA NVDA AAPL AMZN
QQQ CME_MINI:NQ1! CME_MINI:ES1! SP:SPX NASDAQ:NDX stock market Forecast

$QQQ Tomorrow’s Trading Range 9.26.25
This is tomorrow’s trading range for SPX - Look at that Island gap in the upper part. What do you think? End of the rally?
Rates were cut, equities are overvalued and it’s time to reverse this beast. Just my opinion - trade the chart not my opinion.
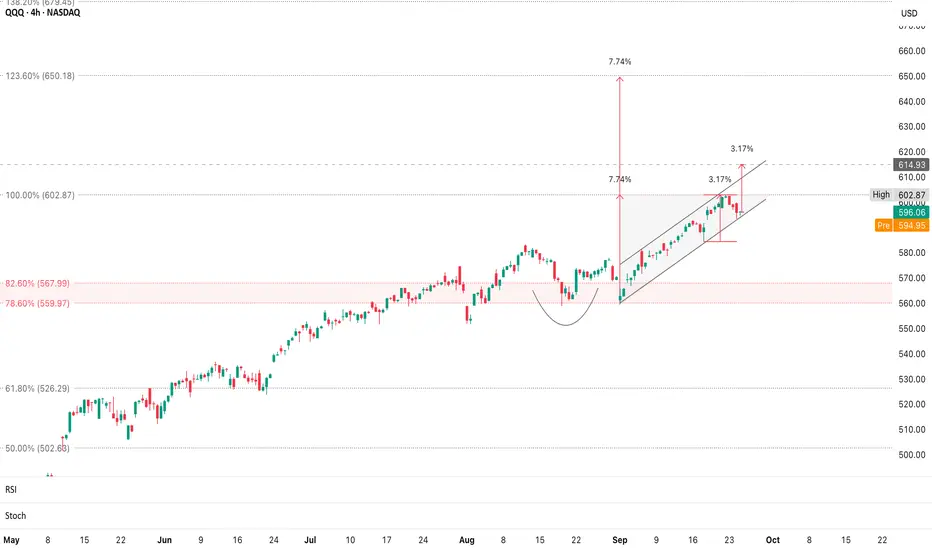
QQQ Channel SupportQQQ is consolidating after a strong rally & holding the rising channel keeps upside targets alive, but a breakdown risks a retrace to mid-$560s
If QQQ holds the channel and clears $602.87, the extension target is $650+ (123.6% Fib)
A break below the channel and $595 could pull back to $560–$567 (Fib support)
Long setup near $595 offers ~3:1 reward if aiming for $615–$650
Short setup below $595 has a cleaner move to $560–$567 (~5% downside)
Right after QQQ’s breakout above $580, price consolidated in a tight rising channel, that’s the small bull flag
If the bull flag breaks upward, it confirms momentum & could push QQQ toward $630 before testing the larger Fib extension at $650
If it fails, the channel support ($595ish) becomes key & a breakdown would negate the flag & risk a dip toward $560–567
The measured move (3.17%) from the flag points to $614.93 (short-term target)
The larger 123.6% extension at $650 remains the next big level
Powell: Stock Prices appear "Fairly Highly Valued"“We do look at overall financial conditions, and we ask ourselves whether our policies are affecting financial conditions in a way that is what we’re trying to achieve,” Powell said. “But you’re right, by many measures, for example, equity prices are fairly highly valued.”
“Markets listen to us and follow and they make an estimation of where they think rates are going. And so they’ll price things in,” Powell said in part of the conversation dealing with mortgage rates.
Though Powell noted the lofty equity values, he said this is “not a time of elevated financial stability risks.”
Not really something you want your central banker saying to keep positive momentum in the stock market. Particularly when the Nasdaq is fairly stretched. A downside scenario could see us pulling back into the EMA bands to 575s for the $QQQ.
QQQ Blow-Off TopsA blow-off top is a rapid, almost vertical rally fueled by FOMO, followed by a sharp reversal; basically, when buyers exhaust themselves all at once at the highs
Steep, accelerating candles
Price goes near vertical with increasingly larger green candles
Little to no pullback along the way
Climactic volume
Volume spikes dramatically; often, the highest in weeks
Sign that everyone rushed in at once
Psychological level tag
Often happens at a round number (QQQ $600)
Big funds sell into retail chasing that breakout
Immediate reversal
After tagging the high, price reverses sharply
Often leaves a long upper wick or a big red candle the next day
In a normal pullback, price runs up, consolidates, dips a little, then continues trend
That parabolic sprint to $602 had some blow-off energy, but volume confirmation & follow-through matter
If QQQ holds $596–$598, then just a pullback
If it slices through $596 to $592 quickly, then the $602 peak was likely a blow-off top
1. November 2021 (~$400)
QQQ ran up nearly vertical into the end of November
Volume surged, RSI > 80 (extreme overbought)
Next sessions was a sharp reversal & that marked the all-time high for over a year
2. July 2023 (~$388)
A straight-line rally into mid-July
RSI & stochastics pinned high
Daily candle with a long upper wick, then a red engulfing candle the next day
QQQ retraced ~5% quickly
3. March 2024 (~$448)
Blow-off type move in tech earnings season
Price overshot resistance, then reversed hard within 2–3 days
QQQ currently reached ~$602 & setup looks similar
Strong parabolic run from ~$584 to $602 (+3%)
RSI was pushing toward overbought
Yesterday's red reversal candle below $600
If QQQ closes below 596, we’d have a failed breakout
Breakdown candle after a parabolic leg
High probability that $602 = short-term blow-off top
If it holds $596–$598 & bounces, then it’s just a consolidation, not a true blow-off
QQQ below $596 confirms the blow-off, while above $598 it’s still possible to rebuild
Blow-off top = acceleration up + exhaustion candle + fast reversal
If $596 breaks with volume, signals sellers are in control
1. $592–$593 (prior breakout shelf)
Textbook first downside target after a blow-off peak; often, where dip-buyers step in
2. $587–$588 (last pivot low before the parabolic run)
If blow-off confirms, this is a high-probability magnet
Stretch Downside (full retracement of blow-off leg)
3. $584 (base of the September run)
Would imply the parabolic move unwinds fully
Only in case of heavy selling/broad market risk-off
Daily close below $596 confirms a blow-off top
RSI roll-over from overbought with price under $596 = momentum shift
Volume spike on red candle = strong confirmation that $602 was exhaustion
If $602 was a blow-off top, QQQ’s clean retracement ladder is $592-$596, $587 & $584 (short-term, medium-term & stretch)
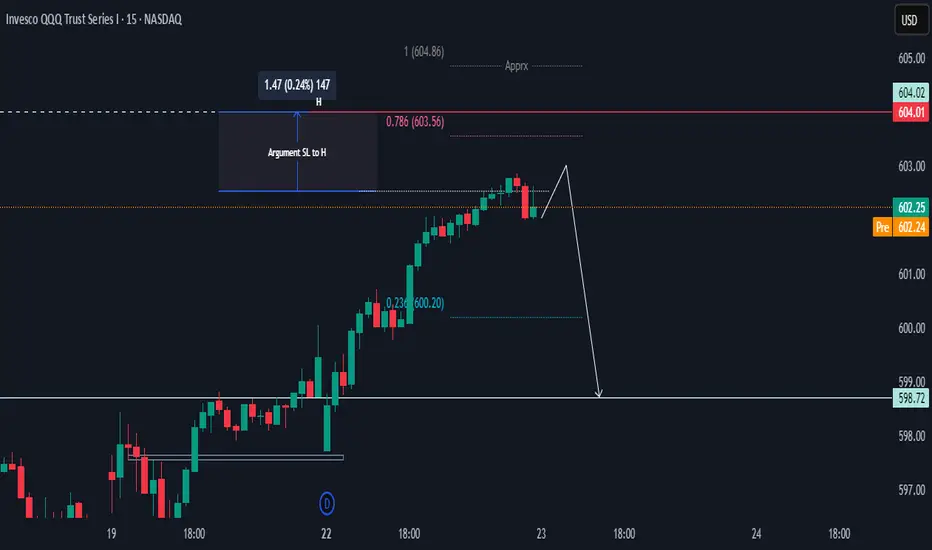
QQQ Potential DropHi there,
QQQ has the potential to drop to 598.72, with a price target of 600.20. The setup will be invalid at 604.02 if there is no sign of improvement. However, if there is momentum improvement, 604.86 will be the approximate invalidation level.
Happy Trading,
K.
Not trading advice
QQQ (19 September)The 20d MA is the heartbeat of this trend
Late August to early September consolidation where QQQ went sideways between $570-$585
The breakout above that consolidation in mid-September created a bullish continuation pattern, which resembles a bull flag/rectangle
Measuring the prior impulse leg (4.36%) & projecting it forward to $608–$609 lines up with this breakout structure
$583 × (1 + 0.0436) ≈ $608–$609
QQQ finished the week stretched at the upper +3% envelope, showing strong, but slightly overextended momentum
Volume was moderate, but supportive with no signs of distribution
The next test is whether it can hold $600 & push into the $608–$609 target zone next week
Momentum is strong, but both RSI & stochastics warn that QQQ is overextended
Near-term risk is a pullback or consolidation at/near $600
Trend remains bullish as long as MACD stays positive & price holds above recent breakout levels
Failure at $600 combined with a break back under $580 would signal a failed breakout & likely mean reversion toward $562–$555
Only a close below $532 would break the entire uptrend structure
$532.17 is the base of the prior summer consolidation & an important bigger-picture support

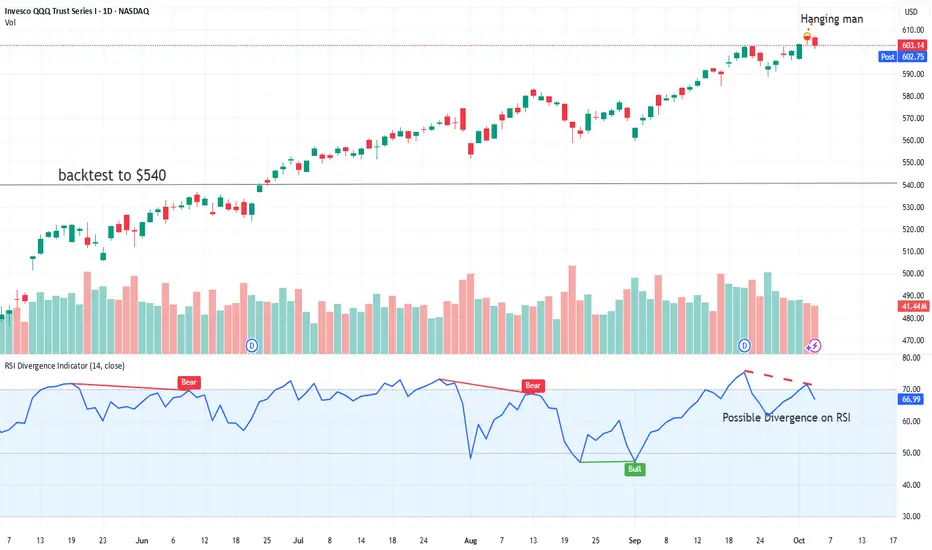
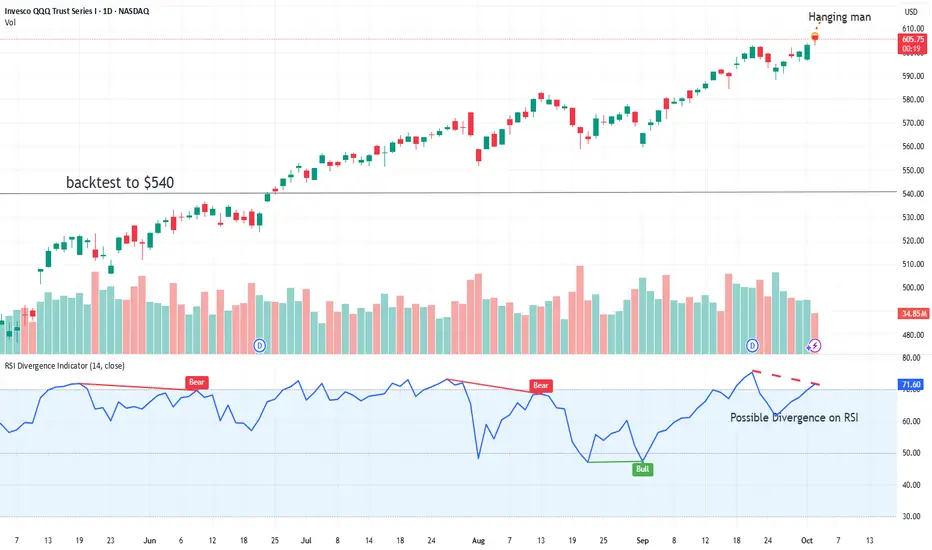
Weak setup for next weekDiverging RSI confirmed with today's faded rally. Lots of uncertainty with the shutdown, but also no release of government data. How will the Fed know to lower rates without data? Markets are at all-time highs, but also at all-time high VALUATIONS. P/S, Case Shiller PE, Earnings Yield, and others all pointing to a sell-off being needed to contain the bulls.
Small Correction 5-10% ?Looks like we will have a small correction hopefully not more than 10%. It could be a good time to buy the dip in nvda, orcl, crwd etc.
Happy trading !!
Not a financial advice.
Possible Bearish Divergence with Hanging Man HammerPossible reversal pattern. Lower Highs on RSI with Higher Highs on price.
Daily candle is a hanging man.
QQQ Measured Moves & PivotsDo you chase the breakout, or wait for confirmation?
1. Buy calls now (since $605 cleared premarket)
PROS
You’re aligned with momentum
If price rips to $610+ off the open, you’re already in
Confirms the bullish measured move extension scenario
CONS
Premarket breaks often fake out at cash open
Chasing is a weaker risk/reward if it pulls back
You’re buying higher IV at the open, which inflates call premiums
2. Wait for retest of $600–$602 support
PROS
Cleaner entry with defined risk (stop under $598)
Better pricing on calls if IV cools during the dip
Confirms bulls are defending $600 as new floor
CONS
You might miss if there’s no retest and it rockets straight to $610+
Discipline can feel like “missed trade” even though it’s good risk management
3. Balanced Play (what many pros do)
Scale in with a starter call position on the breakout (>$605)
If $600–$602 is tested & defended with volume, add size
That way you’re not empty-handed if it runs, but you still get confirmation if it pulls back

QQQ Bullish Continuation BiasThat long lower wick + strong volume at the end of the day shows the dip was bought aggressively (buyers stepped in quickly when price pulled back)
Confirmed with volume so not just a “wick,” but actual conviction (institutions/algos defending the level)
That turns what could have been a “top signal” into more of a healthy consolidation candle inside an uptrend
When you see long wicks + heavy volume near support or resistance, it’s usually a sign of absorption with big money is willing to take the other side
At $600–$603, that’s especially important because it’s both a breakout retest & psychological level
As long as price holds above $600, that wick + volume combo suggests bulls still in control
A move through $605 on volume now has higher odds of continuation toward $610
Only if we see heavy sell volume without the wick (closing weak under $600) would it flip to bearish

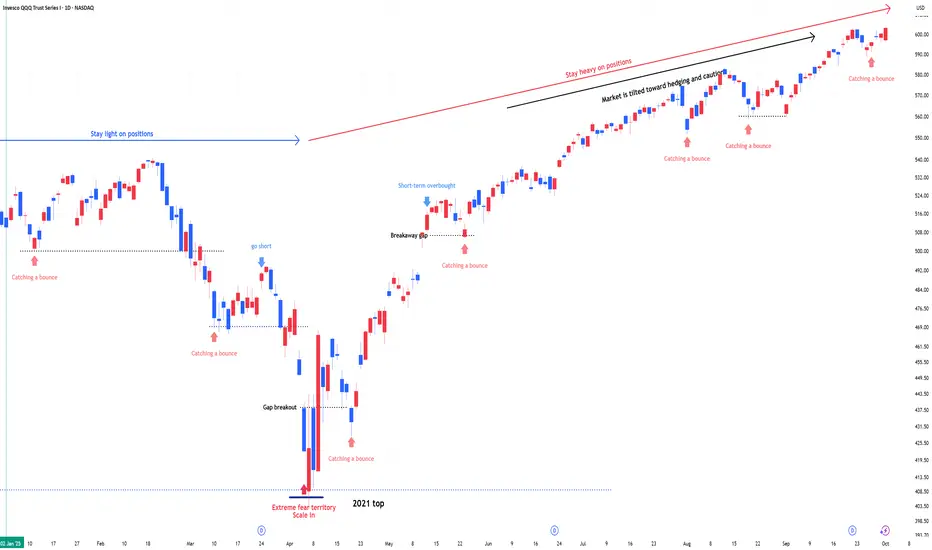
QQQ : Stay heavy on positionsQQQ : Stay heavy on positions (QLD, TQQQ)
Entering a risk-on, high-volatility zone.
In stay light on positions zones, I hold QQQ and reduce exposure.
In stay heavy on positions zones, I increase allocation using a mix of QLD and TQQQ.
** This analysis is based solely on the quantification of crowd psychology.
It does not incorporate price action, trading volume, or macroeconomic indicators.
QQQ Sitting Near HighsQQQ is in a long-term uptrend, but near-term is at decision resistance ($603)
Short-term momentum looks stretched, while the 1h/4h charts suggest buyers still have control unless $588 breaks down
15m chart suggests overbought, signaling short-term caution
1h chart shows QQQ is building momentum, leaning bullish if $603 breaks
4h chart shows the larger uptrend intact, sitting near highs, but momentum slowing
1. Bullish
Breakout above $602–$603 (double-top resistance)
Short-term signals QQQ is overbought, so some chop/pullback may happen before a clean breakout
Medium-term shows RSI trending up, Stoch rebounding, which suggests fuel for another leg higher
Bigger picture is still in a strong uptrend, consolidation near highs, no major breakdown
$610–$615 (measured breakout & round number magnet)
$622–$625 (extension if momentum holds)
Stop-loss (risk control) at $596–$598 (to avoid false breakout traps)
~55% (slight edge to bulls)
Trend favors upside, momentum still constructive on 1h/4h, but 15m overbought tempers confidence
2. Bearish
Failure to hold $600 could test $588 neckline
Short-term is overbought, ripe for a pullback
Medium-term double-top structure is still in play if rejection holds
Bigger picture retracement levels ($560–$567) if neckline fails
Pattern risk (double top) is real, but bulls still control trend unless neckline gives way
$588 (neckline)
$572–$573 (measured move from double top)
$560–$567 (Fib support, must hold for bull trend survival)
Stop-loss (risk control) above $603–$605 (don’t fight a breakout)
~45%

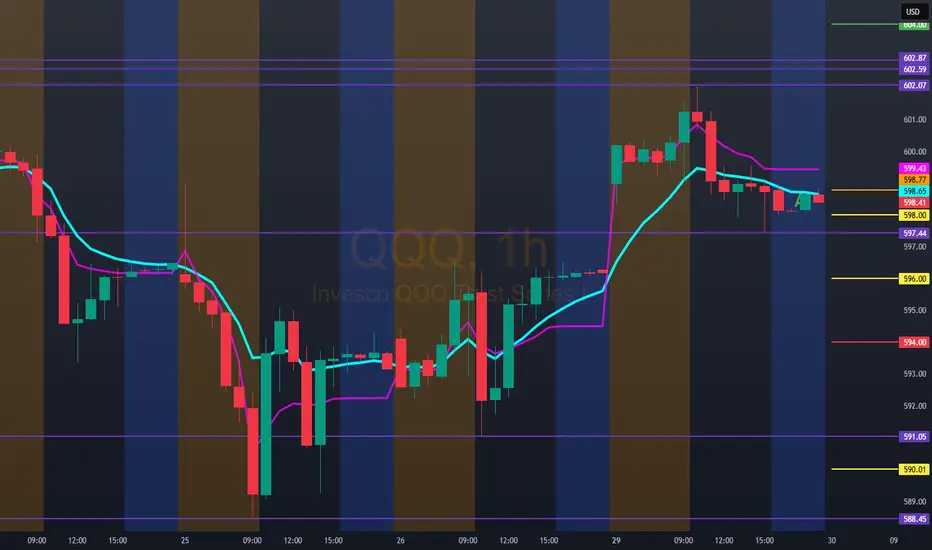
Hello trader, for tomorrow 9/30/25 QQQ: 598.73Bullish entry above 604.00/606.00 with a double top of 602.87, stop below the VAWP.
Bearish entry only below 594.00. The price could rebound to 596.00. If it breaks 596.00, our bearish entry for continuity is 594.00, possible up to 590.00, stop above the VAWP.