Trade ideas

SPY: Forecast & Trading Plan
The analysis of the SPY chart clearly shows us that the pair is finally about to go up due to the rising pressure from the buyers.
❤️ Please, support our work with like & comment! ❤️

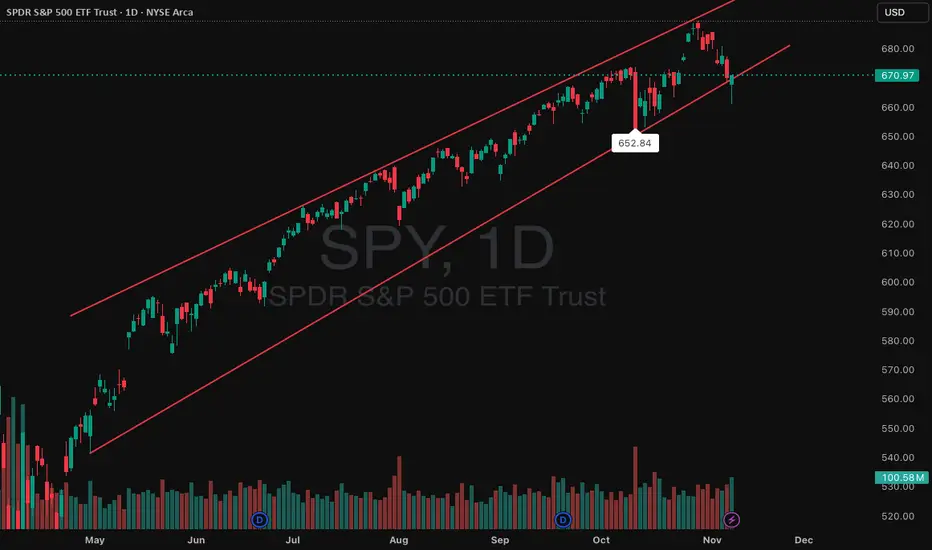
SPY Rising Channel Break or Shakeout?SPY has been riding a clean rising channel for months and just briefly wicked below the lower trendline, then bounced back above — meaning this is a pivot moment. If SPY can reclaim ~675+ and hold, this was likely just a shakeout and the uptrend continues. If SPY instead rolls back over and closes under ~665 again, then the rising channel is broken and a deeper pullback is likely. This week’s close is extremely important — bulls need to hold/defend this lower channel.
Bullish continuation (trend holds):
Buy debit call spread if you see SPY reclaims & holds >675:
Buy 680C / Sell 690C
Target move back toward upper channel.
Bearish break (channel fails):
If SPY loses 665 on a close:
Buy 660P / Sell 650P
Target: move toward 650 zone where next support sits.
SPY Massive Long! BUY!
My dear followers,
I analysed this chart on SPY and concluded the following:
The market is trading on 670.89 pivot level.
Bias - Bullish
Technical Indicators: Both Super Trend & Pivot HL indicate a highly probable Bullish continuation.
Target - 678.65
About Used Indicators:
A super-trend indicator is plotted on either above or below the closing price to signal a buy or sell. The indicator changes color, based on whether or not you should be buying. If the super-trend indicator moves below the closing price, the indicator turns green, and it signals an entry point or points to buy.
Disclosure: I am part of Trade Nation's Influencer program and receive a monthly fee for using their TradingView charts in my analysis.
———————————
WISH YOU ALL LUCK

SPY Support LevelsIf we hold 667, we should bounce, otherwise 664 is channel resistance. If that doesn’t hold we will be racing downwards

Credit Spread Scanner | 2025-11-06💰 Credit Spread Scanner | 2025-11-06
💰 CREDIT SPREAD INCOME SCANNER
📅 Analysis Date: 2025-11-06
🤖 AI Engine: QS
📊 Opportunities Analyzed: 9
⚡ Pipeline: 10-Stage Optimized S&P 500 Scan
════════════════════════════════════════════════════════════════════════════════
💰 TOP 9 CREDIT SPREAD OPPORTUNITIES
Generated: November 06, 2025 at 10:18 PM
════════════════════════════════════════════════════════════════════════════════
📊 10 Total Opportunities • ✅ 4 Ready to Trade • ⏸️ 5 Monitor
────────────────────────────────────────────────────────────────────────────────
┌─ #1 ⏸️ NASDAQ:INTC • Bull Put • WAIT
│
│ 💵 Strikes: $36/$35
│ 📅 DTE: 15 days
│ 📈 ROI: 50.0% • PoP: 66.5%
│ 🔴 Risk Level: High Risk (7/10)
│
│ 📰 Catalyst: High risk of continued negative analyst commentary or price target revisions within the 15-day period. No major scheduled corporate events, but sentiment is fragile.
│
│ 💡 Skip. The HEAT score of 7 reflects high risk from conflicting and negative news immediately following earnings. The "Sell" rating introduces significant downside pressure that the 6.2% buffer may not adequately cover, especially with a high 50% ROI indicating elevated premium due to risk.
└───────────────────────────────────────────────────────────────────────────────
┌─ #2 ⏸️ NASDAQ:MU • Bull Put • WAIT
│
│ 💵 Strikes: $235/$225
│ 📅 DTE: 8 days
│ 📈 ROI: 49.3% • PoP: 60.8%
│ 🟡 Risk Level: Medium Risk (6/10)
│
│ 📰 Catalyst: A Supreme Court ruling or significant new policy announcement from Trump on tariffs is a potential high-impact event within the next 8 days.
│
│ 💡 Wait. The HEAT is 6 due to a major unresolved macro catalyst. The combination of a low 3.2% buffer and high exposure to tariff news makes this trade too risky in the short term. Wait for clarity on the tariff situation.
└───────────────────────────────────────────────────────────────────────────────
┌─ #3 ✅ NASDAQ:NVDA • Bull Put • ENTER NOW
│
│ 💵 Strikes: $180/$175
│ 📅 DTE: 36 days
│ 📈 ROI: 47.1% • PoP: 60.1%
│ 🟡 Risk Level: Medium Risk (4/10)
│
│ 📰 Catalyst: No major company-specific catalysts within the next 36 days. Primary risk remains broader market or AI sector sentiment shifts.
│
│ 💡 Trade. The HEAT is a low 4. The news is positive and supportive. With a 36-day DTE and a 4.5% buffer, the trade has time to withstand minor fluctuations. The bullish news reduces the probability of a sharp drop to the short strike.
└───────────────────────────────────────────────────────────────────────────────
┌─ #4 ✅ NASDAQ:AMD • Bull Put • ENTER NOW
│
│ 💵 Strikes: $225/$220
│ 📅 DTE: 29 days
│ 📈 ROI: 44.9% • PoP: 62.3%
│ 🟢 Risk Level: Low Risk (3/10)
│
│ 📰 Catalyst: Very low. No company-specific news or imminent catalysts identified in the provided data.
│
│ 💡 Trade. The HEAT is a low 3, indicating a stable news environment. The 5.8% buffer is healthy, and the lack of AMD-specific news suggests low volatility, favoring the probability of success for this bull put spread.
└───────────────────────────────────────────────────────────────────────────────
┌─ #5 ✅ NASDAQ:GOOG • Bull Put • ENTER NOW
│
│ 💵 Strikes: $275/$270
│ 📅 DTE: 43 days
│ 📈 ROI: 42.9% • PoP: 63.6%
│ 🟡 Risk Level: Medium Risk (5/10)
│
│ 📰 Catalyst: Low within 43 days. This is a development story, not a near-term earnings or product launch catalyst.
│
│ 💡 Trade. The HEAT is a medium 5. The news is impactful but not an immediate catalyst. The long 43-day DTE provides a large window for the news to be digested and for the trade to manage volatility. The 3.9% buffer is acceptable given the timeframe.
└───────────────────────────────────────────────────────────────────────────────
┌─ #6 ⏸️ NASDAQ:HOOD • Bull Put • WAIT
│
│ 💵 Strikes: $120/$115
│ 📅 DTE: 29 days
│ 📈 ROI: 42.9% • PoP: 62.6%
│ 🔴 Risk Level: High Risk (8/10)
│
│ 📰 Catalyst: Very High. The trade is entered immediately after a major earnings catalyst. Th
e stock is still finding its new price level, and analyst adjustments are likely in the coming days.
│
│ 💡 Skip. The HEAT is 8 due to the immediate aftermath of earnings. Entering a credit spread during this period of high volatility and price discovery is exceptionally risky, despite the attractive 7.2% buffer. It is better to wait for the stock to stabilize.
└───────────────────────────────────────────────────────────────────────────────
┌─ #7 ⏸️ NASDAQ:SOFI • Bull Put • WAIT
│
│ 💵 Strikes: $26/$25
│ 📅 DTE: 15 days
│ 📈 ROI: 42.9% • PoP: 62.2%
│ 🔴 Risk Level: High Risk (7/10)
│
│ 📰 Catalyst: High. Similar to HOOD, the trade is initiated in the post-earnings period where volatility remains elevated and analyst price targets may be updated.
│
│ 💡 Wait. The HEAT is 7. The news is good, but the risk comes from the timing. Allow a few days for the post-earnings volatility to settle before considering entry. The 15-day DTE is too short to comfortably absorb this initial volatility.
└───────────────────────────────────────────────────────────────────────────────
┌─ #8 ✅ NASDAQ:GOOGL • Bull Put • ENTER NOW
│
│ 💵 Strikes: $275/$270
│ 📅 DTE: 36 days
│ 📈 ROI: 40.8% • PoP: 64.2%
│ 🟡 Risk Level: Medium Risk (5/10)
│
│ 📰 Catalyst: Low within 36 days. This is a development story, not a near-term catalyst.
│
│ 💡 Trade. The analysis is identical to GOOG Trade
└───────────────────────────────────────────────────────────────────────────────
┌─ #5 ⏸️ CBOE:HEAT • 5 is manageable given the 36-day DTE and 3.7% buffer. The news is not a immediate • WAIT
│
│ 💵 Strikes: threat.
│ 📅 DTE: N/A days
│ 📈 ROI: N/A • PoP: N/A
│ ⚪ Risk Level: Unknown (N/A/10)
│
│ 📰 Catalyst: No catalysts
│
│ 💡 Pending
└───────────────────────────────────────────────────────────────────────────────
┌─ #9 ⏸️ NASDAQ:COIN • Bull Put • WAIT
│
│ 💵 Strikes: $285/$275**
│ 📅 DTE: 15 days
│ 📈 ROI: 40.8% • PoP: 63.8%
│ 🔴 Risk Level: High Risk (8/10)
│
│ 📰 Catalyst: Very High. COIN is exposed to any further Trump com
mentary on tariffs or crypto, as well as continued sell-offs in the Nasdaq. The asset class is inherently volatile, and the current news cycle is ...
│
│ 💡 Skip. The HEAT is 8. Entering a bullish position on COIN during a period of documented market sell-offs and negative crypto news is highly risky. The 5.2% buffer is likely insufficient to protect against continued volatility from macro headlines.
└───────────────────────────────────────────────────────────────────────────────
────────────────────────────────────────────────────────────────────────────────
📖 QUICK GUIDE:
✅ ENTER NOW → High probability setup, optimal timing, low-medium risk
⏸️ WAIT → Monitor for better entry or catalyst resolution
🟢 Low Risk → Heat 1-3 (stable, far from catalysts)
🟡 Med Risk → Heat 4-6 (moderate volatility)
🔴 High Risk → Heat 7-10 (near catalysts, high volatility)
💎 Position Sizing: 2-5% per trade • Max 2-3 concurrent spreads
🎯 Exit Strategy: Take profit at 50% max gain or stop at 2x loss
════════════════════════════════════════════════════════════════════════════════
💎 Premium Analysis | Market-wide credit spread opportunities

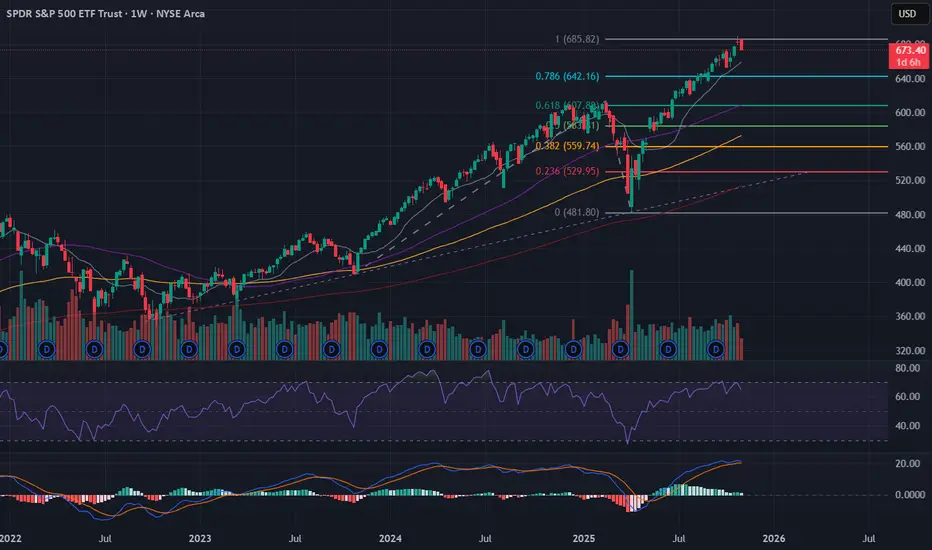
SPY 3W Giga macro Fib (log)Ladies and Gentleman, this is totally normal and totally NOT a fraudulent market !

Just an idea- short entry at 673 retest fail breakoutSelling pressure will likely continue. I expect a push to the upside but fail breakout then further move down. Open to feedback
$SPY: THE REACTORS ARE STARTING TO FAIL AMEX:SPY : This pullback looks different compared to previous ones since the rally started from the April lows. It's the first time a pullback has lasted more than five days. Today's MACD sell signal was further reinforced by the RSI 14 dropping below the 50 line.

$SPY - running out of steam?Macroeconomic backdrop:
Fed uncertainty: Hawkish Fed speak as of this morning and post-Fed interest rate decision overall, the market’s confidence in continuing rate cuts is fading.
Labour market cracks: Ongoing job-cut headlines from large-caps hint at weakness, and continued signs of a cooling job market could weigh on consumer sentiment.
Momentum factor losing strength: High-beta speculative names such as NYSE:IONQ , NYSE:OKLO , NYSE:JOBY , and NASDAQ:KTOS have begun to roll over before the weakness in AMEX:SPY - often an early sign that the broader momentum is weakening.
Technicals:
The rally failed to sustain a breakout above the $685 resistance zone, showing exhaustion near prior swing highs.
Volume divergence and flattening short-term moving averages support the idea that upside momentum is waning.
If macro sentiment stays negative, the next logical retracement target sits near the $642 Fib support, aligning with prior consolidation levels.
Stop-loss: $692 - just above the all-time high, to protect against a renewed momentum leg higher.
Thesis:
After an extended move with minimal pullback, SPY looks vulnerable to a short-term correction. Macro indecision, fading momentum, and sector-wide complacency all point to a market that could start pricing in overvaluation relative to fundamentals.
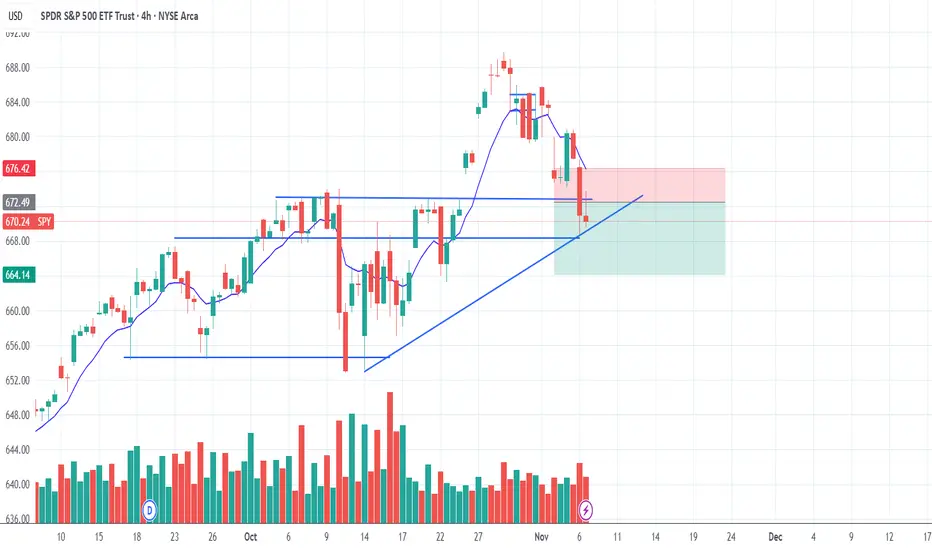
SPY Bullish: Flag Breakout Toward 691–705SPY on the 1D is trending cleanly higher, with price holding above the MA20/60/120 and consolidating near the highs in a neat bull flag. Short-term resistance sits at $691.70 (ATH), while key structure support is anchored around $654.00. The flag’s ceiling is near $685.00, and the MA20 around $672.84 has been acting as first dynamic support after October’s sharp shakeout and swift recovery.
Primary path: a daily close above $685.00 on rising volume opens the door to a retest of $691.70, with extension toward $705.00 based on the measured move. Traders can consider two tactics: buy dips into the MA20 support zone at $672.00–$675.00, or buy strength on a break-and-close above $685.00. Initial profit-taking can be staged back into $691.70, with runners left for $705.00 if momentum expands.
If the flag fails, a decisive close back below the MA20/flag support near $672.00 risks a fade toward $660.00. The bullish thesis is invalidated on a daily close below $654.00, which would mark a larger structure break. A tactical stop just under $670.00 keeps risk contained while the consolidation resolves.
This is a study, not financial advice. Manage risk and invalidations

Idea that I hadA scenario that i thought of: A 5 leg push lower to 650 which looks like a head and shoulders

$SPY $SPX Scenarios — Wednesday, Nov 5, 2025🔮 AMEX:SPY SP:SPX Scenarios — Wednesday, Nov 5, 2025 🔮
🌍 Market-Moving Headlines
🚩 First clean data of the week: After delays in earlier reports, Wednesday brings ADP Employment and ISM Services — the first confirmed macro prints to gauge real economic momentum.
📉 Labor tone check: ADP’s private payroll growth of 22,000 vs -32,000 prior suggests continued softness but potential stabilization ahead of Friday’s NFP.
💼 Services resilience: ISM Services expected to tick up slightly to 50.5, hovering near the expansion line — a critical signal for Q4 GDP trajectory.
💬 Market tone: With shutdown-delayed data still missing, traders focus on rate-cut odds, yields, and Treasury auctions for directional cues.
📊 Key Data and Events (ET)
⏰ 8:15 AM — ADP Employment (Oct) | +22,000 vs -32,000 prior 🚩
⏰ 9:45 AM — S&P Final U.S. Services PMI (Oct) | 55.2
⏰ 10:00 AM — ISM Services (Oct) | 50.5 expected, 50.0 prior 🚩
⚠️ Note:
Unlike earlier-week reports, all of Wednesday’s data are confirmed to release on schedule — making this the first meaningful macro catalyst since the FOMC. Expect intraday volatility around 8:15 AM (ADP) and 10:00 AM (ISM).
⚠️ Disclaimer: Educational and informational only — not financial advice.
📌 #trading #stockmarket #SPY #SPX #ADP #ISM #PMI #yields #Fed #inflation #bonds #economy #macro

SPY DEMAND LEVEL BELOW|LONG|
✅SPY tapped into the demand level and printed bullish reaction wicks, signaling a short-term rebound toward 678$. Liquidity above minor highs could be targeted. Time Frame 2H.
LONG🚀
✅Like and subscribe to never miss a new idea!✅

Update on the markets November 4thSPX rallied in the morning but was rejected at the trendline I was following. Vix now over it's 18ma. My feeling is this will continue to drop with some small bounces here and there. If it gets over 6820 I'm incorrect.

$SPY $SPX Scenarios — Tuesday, Nov 4, 2025🔮 AMEX:SPY SP:SPX Scenarios — Tuesday, Nov 4, 2025 🔮
🌍 Market-Moving Headlines
🚩 Jobs data on deck: Tuesday’s focus is on labor demand — the JOLTS report remains a key barometer for wage pressure, though it may not print due to the shutdown.
⚠️ Data blackout continues: The Trade Balance and Factory Orders are both delayed government releases, keeping markets dependent on Fed tone and price action.
💬 Fed-speak pre-jobs: Vice Chair Bowman’s early-morning remarks will frame policy bias ahead of ADP and Friday’s NFP.
💻 Volatility compression: With few confirmed reports, traders watch AMEX:SPY ’s range behavior and TVC:VIX positioning before the labor-data surge mid-week.
📊 Key Data and Events (ET)
⏰ 6:35 AM — Michelle Bowman (Fed Vice Chair) speech
⏰ ⚠️ 8:30 AM — U.S. Trade Deficit (Sept) — may not print
⏰ ⚠️ 10:00 AM — Factory Orders (Sept) — may not print
⏰ ⚠️ 10:00 AM — Job Openings (JOLTS, Sept) — may not print
⚠️ Note:
All three macro reports are subject to delay under the continuing government shutdown. Expect headline-driven trading and low data-volume volatility until Wednesday’s ADP and ISM Services releases.
⚠️ Disclaimer: Educational and informational only — not financial advice.
📌 #trading #stockmarket #SPY #SPX #Fed #Bowman #JOLTS #TradeBalance #FactoryOrders #bonds #yields #economy #shutdown #macro

First Monday of NovemeberSPX still in a consolidation but can hit 6900 today on a bounce. taking out Friday' lows would be bearish. Usoil still holding above it's 18ma, needs to get above 63 for a significant move up to start. BTC still battling with 110k, but looking weaker. Gold still in a bear flag formation.

November 3 - November 7The market has been showing no signs of slowing down as of late. Every dip is being aggressively bought and fear hedging of SPX puts and Gold is appearing to be providing more liquidity to keep prices moving higher. I posted this in Minds earlier and will add because it sums up my assessment of where the market is currently at and it’s potential achilles’ heel.
“The US will continue to have one of the most stable market environments compared to the rest of the world, making it a safe place to store capital. While the trade deficit gives the US some leverage over China when it comes to trade, the fact that China is the #3 foreign holder of US debt gives them the “trump card” in the trade war.
Rate cuts will continue to be stimulative and help keep the Fed’s interest payments from getting out of control (for now) but things can quickly unravel if yields start rising to the point where it forces the Fed back into QE prematurely.
This is why Trump keeps backing down from the most extreme measures in the trade war. He knows US companies cannot withstand 100%+ tariffs and China could stop buying Treasuries and start pushing yields higher. This is why I keep an eye on TVC:MOVE when there is stock market volatility to make sure there isn’t growing institutional hedging of Treasuries.
I still need to look everything over to determine my bias for this week but with the trade war entering what I think will be a temporary phase of relief, I’m not seeing strong bearish fundamentals at this point in time.”
Here is what I’m seeing for the week ahead.
+-+-+-+-+-+-+-+-+-+-+-+-+-+-+-+-+-+-+-+-+-+-+-+-+-+-+-+-+-+-+-+-+-+-+-+-+-+-+-+-+-+-
1. Macro
The dollar TVC:DXY is reaching the top of its range and the hollow candles have been less than bullish, so I think the index may once again peak around 100 before reverting back to the average. I am keeping this in mind when comparing other assets to the dollar.
The TVC:US03MY / TVC:US10Y yield spread is once again quite wide, which was recently driven by a rise in the 10Y yield while the 3M yield mostly remained flat, as I suspected would happen in my previous post. The overall trend for both is still slanting downward, so while it’s never great to see the 10Y yield rising, the wider spread is healthier to see. On the contrary, FRED:DFII10 (inflation-indexed 10Y bond) went up on the last available date, Thursday 10/30, so it will be important to watch the Forward Inflation Gauge (bottom right) to see if the market starts to send any inflation signals.
I have updated the formula for the inflation gauge as well to broaden the scope. The new formula is
= US03MY*0.25+US10Y*0.50+US30Y*0.25-DFII10
I decided to include the TVC:US30Y bond since its yield is of the biggest concern to policymakers and weight the average to place the most significance on the 10Y yield. As the shutdown continues, the Fed will be placed in an increasingly difficult position without official data. Since PCE was not published on Friday, this is depriving us of a key piece of data that would show if the market is correct in pricing in lower inflation or if the spread between Real/Implied inflation will continue to widen. This is why yields will yields will provide important clues, especially if the shutdown starts nearing an end. If real employment and inflation data will be released soon after, will the market begin to sell bonds due to lack in confidence or continue the course?
Next on commodities, TVC:GOLD is sitting on its average level and could go either way from here. I’d expect a retracement higher but who knows. As I mentioned above, if the dollar TVC:DXY starts to revert lower, it could help Gold move back up a few points. I’m not expecting much out of Gold for at least another week. It will be interesting to see what happens with Oil and Commodities (bottom right) this week in relation to the dollar index. If for whatever reason, the dollar rallies, it could push oil and ag/metal commodities down, but the alternative may be of greater concern: if the Dollar moves lower again, commodities could surge well above the average in correlation which could be perceived as inflationary since the rise in prices (especially when it comes to copper) has more to do with US trade policy rather than pure international demand. I read earlier today in The Economist that Copper is trading at a higher spot price on the New York exchange compared to London, so to summarize, I will be watching the Macro chart very closely this week, as I think important signals are on the horizon.
2. FX
Other currency indices continuing to fall will help bolster the dollar’s relative standing, so it will be important to keep an eye on this as well as the week unfolds for clues on the Dollar, which in turn will have an effect on commodities. I have the bond yields indexed to 100 again here to show the change and as I mentioned in the introduction, the 3M chart (top) shows how investors are much calmer on the US in the short term compared to other countries. 10Y bonds rose across the board at the end of October but seem to be leveling off.
3. Risk
I don’t draw on my charts as much these days but I think there are some interesting points on this layout that I want to illustrate. First, on the corporate bond yield premium spread (high yield - investment grade) the most recent data (Thursday 10/30) shows the spread went up, which could potentially be a higher low. It will be important to watch this and, to a lesser degree, $HYG/LQD (for intraday) for signals of stress in credit markets.
Next, I still believe the $ES1!/GOLD chart shows the spread found a bottom, so even if Gold gains on ES this week, I think gold’s preference over stocks may continue to decline. Another important development last week was how AMEX:SPY broke out of the rising channel over AMEX:RSP (equal weighted ETF) and held on Friday. As you can see on the bottom chart, TVC:NDQ outperformed the other indices quite well, so I take this as a signal of extreme demand for Tech and other mega-cap stocks that are weighted the highest.
Takeaway: Keep an eye on corporate credit but unless there is a significant change, stocks look biased in favor of Tech and other mega caps.
4. Sector Bias
Tech ( AMEX:XLK ) has been moving up against SP:SPX since the end of October, so the risk appetite is continuing to grow. As I mentioned about $SPY/RSP , this supports that the highest weighted stocks will continue to outperform.
5. Futures Bias
There was some bearish intraday activity on Futures at the end of last week, especially on Friday, where Realized Volatility increased and institutions hedged by buying SPX puts ( TVC:VIX ) and VIX calls ( CBOE:VVIX ), USI:PCSPX was quote high, however there was divergence with VIX, so the weighted index so the institutional interest may have been lower than what the weighted index was indicating.
On the right side, you can see the CVD momentum was in a downtrend from Wednesday-Friday which reacted ahead of the ES price and captured a maximum 1.46% decline
Lastly, I have switched back to Renko from Line Break, as I think the ATR calculation provides better noise filtering while being more reactive to fast changes. Here you can see that the price could not reclaim weekly VWAP (dotted line) Thursday or Friday, so sellers were in control those days and dealers bought into the volatility. It also looks like the price tried to form a range and failed, causing it to slide lower. Right now it will be important to see which way the price goes. If it retraces higher, will it make a new ATH or fail to do so? That could be an important signal to gauge how much strength buyers still have.
Conclusion:
Out of all the charts, I would say that if I were to view the ES chart in isolation I would probably have a bearish bias, and beyond the chart there are developing macro signals that could provide support to the bearish fundamental case (commodity rally, rising corporate credit spreads, dealers short gamma) that will be important to watch for signs of continuation. On the flip side, if I were to view every chart excluding ES, I would say this environment could still support continued upside for the indices (ES1!/Gold spread, the weighted index outperforming unweighted, AMEX:XLK pivot, and low Treasury volatility TVC:MOVE ).
I think this juxtaposition illustrates that the market is uncertain as well. Macro indicators are at what may be an inflection point, so the fear hedging after the 10/22 to 10/30 rally is justifiable since stock market performance will likely be greatly influenced by Macro forces if anything changes. It also seems like arguments can be made that the Dollar rising or falling this week (especially if it’s quick) could have negative ripple effects in the markets this week. I believe the worst case for stocks this week would be a dollar sell off.
For these reasons, it would be reckless to be anything but Neutral here. I’d prefer to play the bull side if it seems like volatility will “unwind”, but if the market seems like it’s going to keep buying into Volatility, I will expect to see lower prices across the indices.
Regardless of what happens this week, I do think SPX hitting 7k this year is all but inevitable, so if I do take a bearish bias, it will be for the short term and will be reassessed on a daily basis. Let me know what you think and thanks for reading.

$SPY $SPX Scenarios — Week of Nov 3 → Nov 7, 2025🔮 AMEX:SPY SP:SPX Scenarios — Week of Nov 3 → Nov 7, 2025 🔮
🌍 Market-Moving Headlines
🚩 Post-FOMC digestion: After Powell’s Oct 29 presser, traders watch whether yields and the dollar cool or extend higher.
📈 Labor-week spotlight: Friday’s Jobs Report (NFP, wages, unemployment) anchors the week — rate-path odds hinge on those prints.
💬 Fed tone in focus: Multiple governors and regional presidents hit the circuit after the FOMC — every nuance matters for December guidance.
⚠️ Shutdown watch: Several BEA and Census releases (Factory Orders, Trade Balance, GDP components) may not print on time if the government remains partially shuttered.
💻 Earnings taper off: Final big-cap names and sector leaders wrap Q3 results, shaping sentiment into mid-November.
📊 Key Data and Events (ET)
Mon Nov 3
⏰ ⚠️ 8:30 AM — Durable Goods Orders (Sept) | Ex-transportation subset — BEA report; possible delay
⏰ 10:00 AM — Factory Orders (Sept) ⚠️ possible delay
Tue Nov 4
⏰ 9:00 AM — S&P Case-Shiller Home Price Index (Aug)
⏰ 10:00 AM — Consumer Confidence (Oct) 🚩
Wed Nov 5
⏰ ⚠️ 8:30 AM — Advanced Trade Balance in Goods (Sept) | Retail and Wholesale Inventories — Census; may be delayed
⏰ 10:00 AM — Pending Home Sales (Sept)
⏰ 🚩 2:00 PM — FOMC Rate Decision
⏰ 🚩 2:30 PM — Fed Chair Powell Press Conference
Thu Nov 6
⏰ 🚩 8:30 AM — Initial Jobless Claims (Oct 25) expected on schedule
⏰ 🚩 8:30 AM — GDP (Q3, Advance) ⚠️ BEA data; delay possible
⏰ 9:55 AM — Fed Vice Chair Michelle Bowman speaks
Fri Nov 7
⏰ 🚩 8:30 AM — PCE and Core PCE (Sept) along with Personal Income, Spending, and Employment Cost Index ⚠️ BEA risk
⏰ 9:45 AM — Chicago PMI (Oct)
⏰ 12:00 PM — Cleveland Fed President Hammack and Atlanta Fed President Bostic remarks
⚠️ Note:
Shutdown risk applies to BEA and Census releases marked with ⚠️
Confirmed live data include Jobless Claims, FOMC decisions, and Fed speeches — these will drive most of the week’s price action.
Friday’s PCE print (if released) remains the key inflation gauge.
⚠️ Disclaimer: Educational and informational only — not financial advice.
📌 #trading #stockmarket #SPY #SPX #Fed #Powell #FOMC #PCE #GDP #JoblessClaims #inflation #bonds #yields #economy #macro

SPY 30 minute outlook for 3 to 7 NovemberThe most important thing first
Only trade at the map levels. For this week that list is short. 678, 682, 685, 690, and the gap zone 671 to 672. Everything else is noise until price reaches one of these spots. Your job is to listen for acceptance or rejection at the level, then act with a small number of simple rules.
Why this matters this week
The last print on Friday was near 682. Buyers defended higher lows for two weeks, yet supply still lurks above 685. This creates a tight battlefield where patience has an edge. We also walk into a week with event windows that can move liquidity at specific times. That makes a level based plan far more useful than chasing mid range impulses.
The map you can trade
Place these levels on a clean thirty minute chart. No indicators are required for the core read.
700 round number magnet. Respect the gravity if price runs
690 first upside checkpoint above the band
685 first breakout gate. Acceptance here often pulls price into 690
682 pivot around Friday close. That is the middle of the week map
678 first support inside balance
671 to 672 open gap zone from late October
665 next shelf under the gap
661 to 662 fifty day context on the daily, not a trigger but important reference
Mark a simple session based VWAP if you like, only as a way to define impulse and pullback structure. If VWAP pins near 682 during cash hours, treat that as the intraday axle.
Catalysts to respect
Write the event times directly on your chart. Private payrolls, the two ISM prints, and Treasury supply updates are the likely spark plugs. The idea is not to predict the number. The idea is to protect your risk into the time stamp and let the reaction tell you when to press or stand down. Most reactions that stick will retest a level. That is the entry you want.
Three rules for entries and exits
Keep it simple. You need only three.
Break and hold
Above 685 for fifteen minutes, buy the first pullback that holds the breakout line. Use the impulse low as your stop. First target 690. If momentum stays firm, trail under higher swing lows and let the tape pull you toward 700. If the retest under 685 appears, stand aside and wait for a clean reclaim before trying again.
Reject and rotate
If price rejects 685 early and bleeds back under 682, fade pushes back into 682 only when the tape is balanced and liquidity is thick. First target the other edge at 678. Second target is a test of the 671 to 672 gap zone. Cut the idea if a higher low forms above 682 and buyers reclaim the pivot.
Explore and revert
If 678 breaks and fails to reclaim, let price explore 671 to 672. Two ways to trade it. Either do nothing and stalk reversal structure inside the gap zone, or short failed bounces that cannot get back above 678 with a target at the top of the gap. In both cases the invalidation is a fast reclaim of 682 with improving tape.
How to size and manage
Define one Discipline unit for the week. That is your full risk per idea
Use one half unit when you trade against the outer edge of the weekly options expected move. At Monday open write the current expected move upper and lower bounds on your chart and treat them as fences for scaling
Take partials into logical magnets. Into 690 from a 685 break. Into 678 from a 682 rejection. Into 671 to 672 after a 678 failure. The objective is to convert risk into house money early, then trail with intent
What to watch intraday
A breadth or depth improvement during a 685 reclaim. That is usually the cleanest long of the day. You will see it in tape speed and order book thickness rather than in oscillators
A stall near 690 with lower highs on five minute bars. That is usually the place to stop pressing longs and to hand the rest of the work to the trail
A false break under 678 that immediately rips back through 682. That is the place to flip your bias for a rotation toward 685 again
Scenarios in plain language
Trend continuation
If buyers clear 685 and hold it on the retest, the path of least resistance is higher. Aim for a measured push into 690. If the tape is squeezing and liquidity stays supportive you can keep a runner for a look at 700. The evidence you need is simple. Higher lows on five and ten minute bars and no heavy selling into the bid.
Range rotation
If we reject 685 early, expect a ping pong week between 678 and 685 with a pivot near 682. You fade the edge only when the tape is calm. You do not fade when a data release has just hit, because the first reaction can keep running.
Pullback to value
If 678 gives way and cannot reclaim, let it go. The highest quality buy zone is down near 671 to 672 where trapped shorts may cover. The first long is often the retest that holds the top of the gap and prints a higher low on five minute bars.
Risk and discipline
Cut losers fast at the level, not in the middle of the range
Never widen stops during event minutes
Do not add size mid range. Add only at the level after confirmation
If you take three trades and all three fail to hold structure, step away for an hour. That reset often saves the day
Closing note
You do not need ten indicators and a dozen opinions this week. You need five levels, three rules, and one risk unit. Write them down. Trade only when price comes to you. Let the market do the heavy lifting.
Reminder
Education and analytics only. No advice. No guarantees. Process beats prediction.

SPY BEARS ARE STRONG HERE|SHORT
SPY SIGNAL
Trade Direction: short
Entry Level: 681.87
Target Level: 650.12
Stop Loss: 702.99
RISK PROFILE
Risk level: medium
Suggested risk: 1%
Timeframe: 9h
Disclosure: I am part of Trade Nation's Influencer program and receive a monthly fee for using their TradingView charts in my analysis.
✅LIKE AND COMMENT MY IDEAS✅

FII Inflows vs. Outflows: Understanding Market SentimentIntroduction
In the ever-evolving landscape of global finance, Foreign Institutional Investors (FIIs) play a pivotal role in shaping the sentiment and direction of emerging markets like India. FIIs — such as hedge funds, pension funds, mutual funds, and insurance companies — bring large volumes of capital into domestic markets, seeking growth and diversification. Their investment behavior, whether inflows (buying) or outflows (selling), often acts as a powerful barometer of market confidence, macroeconomic outlook, and global risk appetite.
Understanding the dynamics between FII inflows and outflows helps investors, policymakers, and analysts interpret shifts in market sentiment and anticipate potential market movements. These capital flows can amplify trends, fuel rallies, or trigger corrections — depending on their magnitude and timing.
1. Who Are Foreign Institutional Investors (FIIs)?
Foreign Institutional Investors are large investment entities registered outside the domestic country that invest in financial assets like equities, bonds, or derivatives. They differ from Foreign Direct Investors (FDIs) because FIIs typically invest in financial markets for shorter durations rather than building physical assets or infrastructure.
Examples of FIIs:
Global mutual funds like BlackRock, Vanguard, and Fidelity.
Sovereign wealth funds from countries such as Singapore’s GIC or Norway’s NBIM.
Hedge funds and private equity firms seeking high returns in emerging economies.
Pension and insurance funds looking for diversification and long-term growth.
Their decisions to enter or exit a market depend on several factors — ranging from macroeconomic stability and policy reforms to global interest rates and currency strength.
2. The Concept of FII Inflows and Outflows
FII Inflows
These occur when FIIs purchase securities in the domestic market, leading to a net inflow of foreign capital. This typically indicates positive sentiment, suggesting investors have confidence in the country’s growth prospects, policy stability, or corporate earnings potential.
FII Outflows
Conversely, when FIIs sell domestic assets and repatriate funds, it leads to an outflow. This usually signals risk aversion, uncertainty, or profit-taking, reflecting a decline in investor confidence or shifts toward safer global assets.
The net FII position — inflows minus outflows — is a key metric that analysts monitor daily. Sustained inflows can lift stock indices, strengthen the domestic currency, and improve liquidity, while sustained outflows can depress markets and weaken sentiment.
3. Why FIIs Matter to Emerging Markets
FIIs are critical to the functioning of emerging economies for several reasons:
Capital Boost: They inject much-needed liquidity into the capital markets, helping firms raise funds efficiently.
Market Depth and Efficiency: FII participation improves price discovery and reduces volatility over the long term.
Currency Support: Inflows strengthen the domestic currency as foreign investors convert their dollars or euros into local currency.
Confidence Indicator: The presence of FIIs signals global confidence in the country's financial stability and growth prospects.
However, dependence on foreign capital can also make markets vulnerable to global shocks. Sudden withdrawals, as seen during crises like 2008 or 2020, can trigger sharp corrections and currency depreciation.
4. Factors Influencing FII Flows
The movement of FII money is influenced by a complex mix of global and domestic factors:
A. Global Factors
US Federal Reserve Policies: Higher US interest rates often trigger FII outflows from emerging markets as investors shift to safer, higher-yielding US assets.
Global Risk Sentiment: During geopolitical tensions or financial crises, FIIs typically move money to safe havens like the US dollar or gold.
Commodity Prices: Changes in crude oil or commodity prices can influence inflation and currency strength, indirectly affecting FII behavior.
Exchange Rates: A weakening local currency reduces returns for foreign investors, often leading to outflows.
B. Domestic Factors
Economic Growth Outlook: Strong GDP growth, industrial production, and corporate earnings attract FIIs.
Inflation and Interest Rates: Moderate inflation and stable monetary policy create a favorable investment climate.
Government Reforms: Policy measures such as tax simplification, infrastructure development, or digitalization enhance investor confidence.
Political Stability: A stable political environment assures investors of continuity in policy and governance.
5. The Relationship Between FII Flows and Market Sentiment
A. Inflows Reflect Optimism
When FIIs pour money into equity markets, it signals confidence in future growth and profitability. Such periods often coincide with bullish market phases, rising stock prices, and increased participation from domestic investors.
For example, in 2020–2021, FIIs heavily invested in Indian markets, betting on post-pandemic recovery, leading to a massive rally in benchmark indices like Nifty and Sensex.
B. Outflows Indicate Caution or Fear
Outflows usually occur during economic uncertainty, inflation fears, or political instability. When FIIs sell, markets tend to correct sharply due to the sheer volume of their trades. Domestic investors often interpret outflows as early warning signs, triggering a chain reaction of selling.
C. Market Sentiment Feedback Loop
FII behavior not only reflects market sentiment but also amplifies it. Positive inflows drive asset prices up, which in turn attracts more investors — creating a self-reinforcing cycle. Conversely, heavy outflows can depress prices, leading to panic and further withdrawals.
6. Impact of FII Flows on Key Market Variables
A. Stock Market Performance
FII inflows increase demand for equities, driving prices up and expanding market capitalization. Conversely, sustained outflows can cause sharp corrections. FIIs often focus on large-cap stocks and sectors like banking, IT, and energy, which heavily influence benchmark indices.
B. Currency Exchange Rate
Inflows strengthen the local currency as foreign investors convert foreign exchange into domestic currency. Outflows do the opposite — large-scale selling can weaken the currency, making imports costlier and impacting inflation.
C. Bond Yields
In the debt market, FII participation affects yields and borrowing costs. Heavy inflows reduce yields, signaling strong demand, while outflows push yields higher due to reduced liquidity.
D. Market Liquidity
FII inflows improve liquidity and enhance market efficiency, allowing smoother trade execution and tighter spreads. Outflows, however, can reduce liquidity and increase volatility.
7. Case Studies: FII Flows and Market Behavior
A. The 2008 Global Financial Crisis
During the 2008 crisis, FIIs pulled out billions from emerging markets amid a flight to safety. India witnessed a sharp fall in equity indices as foreign investors exited in panic, illustrating how global shocks translate into domestic volatility.
B. The Post-Pandemic Rally (2020–2021)
After the initial selloff in early 2020, FIIs returned aggressively as liquidity surged globally due to low interest rates and stimulus packages. India saw record FII inflows, propelling markets to all-time highs by 2021.
C. The 2022 Tightening Cycle
When central banks, led by the US Federal Reserve, began hiking rates in 2022, FIIs started withdrawing capital from riskier markets. This led to corrections in emerging market equities and depreciation of currencies like the Indian rupee.
8. The Role of Domestic Investors (DIIs) as a Counterbalance
Domestic Institutional Investors (DIIs) — such as mutual funds, insurance companies, and pension funds — often act as a stabilizing force. When FIIs exit, DIIs tend to buy the dips, cushioning the market from excessive volatility.
For example, in 2022, even though FIIs sold heavily, Indian markets remained relatively resilient due to strong DII inflows supported by growing domestic retail participation through SIPs (Systematic Investment Plans).
This increasing domestic base reduces overdependence on FIIs, making markets more internally stable over time.
9. Interpreting FII Data to Gauge Market Sentiment
Market participants regularly track FII activity to understand near-term and long-term sentiment.
Key indicators include:
Daily/Weekly FII Net Investment Data: Published by exchanges like NSE and BSE.
Sectoral FII Holdings: Shows which sectors are favored or avoided.
Derivative Positions: Reveal whether FIIs are bullish or bearish through futures and options data.
Typical Interpretations:
Continuous Inflows: Indicate optimism and risk appetite.
Moderate Outflows: May suggest short-term profit booking.
Heavy Outflows: Reflect fear or macroeconomic stress.
Mixed Trends: Suggest uncertainty or global event-driven reactions.
10. Policy Measures to Attract and Retain FII Investment
Governments and regulators often adopt strategies to maintain investor confidence and encourage foreign participation:
Stable Tax Regime: Simplified and predictable tax structures attract long-term investors.
Ease of Capital Entry and Exit: Liberalized investment norms ensure flexibility for FIIs.
Robust Regulatory Framework: Transparency in corporate governance and accounting standards boosts trust.
Infrastructure and Reform Push: Continuous improvement in logistics, digitalization, and reforms strengthens the investment ecosystem.
11. Risks of Overdependence on FII Flows
While FII inflows are beneficial, overreliance can be risky. Markets heavily influenced by foreign flows become vulnerable to global shocks. A sudden reversal in sentiment can trigger:
Sharp market corrections.
Currency depreciation.
Capital flight and liquidity stress.
Negative wealth effect on domestic investors.
Hence, building strong domestic participation and promoting long-term investments are key to achieving market resilience.
12. Future Outlook: FII Behavior in a Changing Global Landscape
As global markets evolve, FII strategies are becoming more data-driven, ESG-oriented, and diversified.
Trends to watch include:
Shift Toward Sustainable Investments: Environmental, Social, and Governance (ESG) factors are influencing allocation decisions.
AI and Quantitative Investing: FIIs increasingly use algorithms to detect opportunities in real-time.
Focus on Emerging Economies: Despite risks, long-term growth prospects in India, Indonesia, and Brazil continue to attract interest.
Rising Domestic Institutional Strength: With DIIs gaining momentum, the market is gradually balancing foreign and local influences.
Conclusion
The battle between FII inflows and outflows serves as a pulse check on global and domestic market sentiment. Inflows bring optimism, liquidity, and growth; outflows bring caution, correction, and discipline. Together, they reflect how global investors perceive a nation’s economic health and future trajectory.
For traders and policymakers alike, understanding the patterns and triggers of FII movements offers valuable insights into market cycles, risk trends, and sentiment shifts. While FIIs will continue to influence markets, a robust domestic investor base ensures that the market’s foundation remains resilient — balancing the scales of global capital dynamics.