$XLE Plan for this weeksolid orange are intraday actionable plays
dotted are take profit targets
Harmonic pts are for longer dated positions
Trade ideas


XLE - A lot of accumulation under $50 since JulyAVD in white
Crude oil CL1! futures in pink
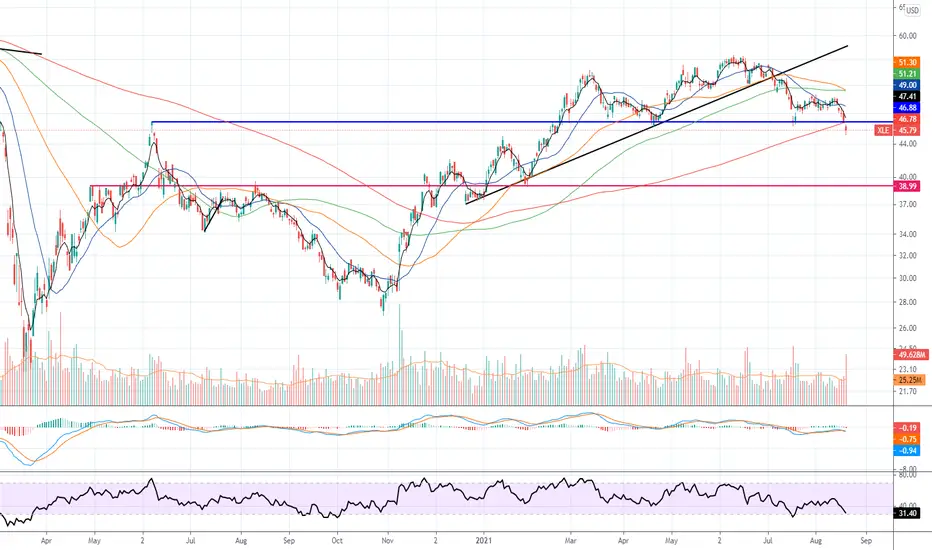
Notice the accumulation since the July low. The range between 51 and 47, shown as a darvas box, is now very clear.
Darvas would play these as breakouts with stops below the low of the box, but I prefer to bottom fish the low end of the range.

Energy flashing a buy signal (Technical Analysis)AMEX:XLE
NYMEX:CL1!
NYSE:XOM NYSE:AMPY
Energy stocks, crude oil, and the XLE energy ETF all flashing buy signals. $100 oil looks invitable.
From failed moves come fast moves, and oil/energy stocks failed an attempted breakdown below the neckline.
A few favorite long ideas: $LPI, $AMPY, $XLE, CL1 (futures), $XOM

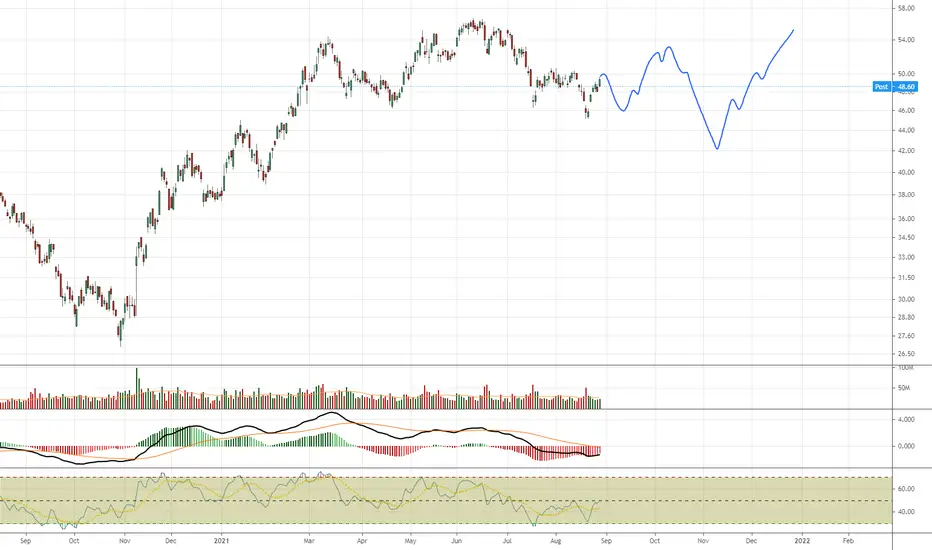
$XLE - Getting crushed but looks goodXLE is has pulled back over 15% from its high. Yielding 4.5% now. If you believe inflation is not just transitory and in the reopening of the US into 2022, this is a good idea. I've never been a big fan of energy but their are several tailwinds possible to continue to drive this higher into next year.

XLE swings short over the POC if oil supportsShorter term swing, short could target the low of the recent range if oil is weak too

$XLE bounce with cheap OTM callsEnergy was the stand out sector today up 3.74% on good volume.. as we mentioned a few days ago it looks to have confirmed a double bottom and being the cheapest sector on a fwd p/e and price/book basis it’s a contrarian and catch up play some major players are getting into.. more to come here.. some upside OTM calls IVs are cheaper than ATM and HV..

Energy ETF May Be Squeezing Toward a BreakoutCrude oil and natural gas are rallying this week as traders focus on tighter supplies and the potential for a winter demand spike. It may create an opportunity in the SPDR Energy Fund, which has been left for dead despite the move in physical products.
Notice the convergence between the rising 200-day simple moving average (SMA) and the declining 50-day SMA. This creates the potential for a breakout.
Next, consider the lows of July 19, August 19 and September 9. These have formed a rounded bottom with support increasingly close to the downward-sloping trend line along the recent highs.
Third, XLE's MACD has been steadily rising during this entire consolidation phase.
Finally, the 8-day exponential moving average (EMA) has just crossed above the 21-day EMA. That could potentially indicate that short-term momentum is turning more bullish.
TradeStation is a pioneer in the trading industry, providing access to stocks, options, futures and cryptocurrencies. See our Overview for more.

XLE LongUpdate to previous XLE long. XLE following early reflation trade fractal in Q4 2020.
Invalidated without a clear bounce in coming weeks.


$XLE good to LONG XLE is in line with Crude (refer to my previous post.
Price is now siting above MA200 and EMA9 and just touched MA20 on Aug 24 before retrace down a bit.
Keep an eye on this one

Bullish island reversal with positive momentum divergenceThe SPDR Select energy sector ETF (XLE) is gapping up to kick off the week and creating a 2-bar bullish island reversal at prior support and with bullish momentum divergence. This could be exactly what the bulls needed to kick this prior leader back into gear.
No position personally, but looks good for at least short-term continuation.

Short term: XLE back to resistancePossible H/S pattern setting up in XLE. Don't know if it all plays out but I think XLE pushes back to right shoulders top.


Bearish top formation on XLE Energy stocksIt looks like some form of topping pattern in $XLE - 46.25 key level to trigger.
Focus on 50.57 and 52.50 as resistance levels to keep a bearish bias.


Energy Stocks Are Hugely Oversold, By This MeasureEnergy is the top performing sector this year, despite two months of weakness. It now appears hugely oversold in comparison with crude oil prices.
The chart below shows the ratio of the SPDR Energy ETF against crude oil CFDs. Notice how the current ratio is among the lowest of all time.
The next chart shows USOIL with daily candles. It had a quick dive under $66 and the 50-day simple moving average (SMA) early last week, but immediately recovered. That now looks like a false breakdown. Its 8-day exponential moving average (EMA) has also just crossed above the 21-day EMA.
Returning to our main chart of XLE, notice how prices bounced around $46.50. This was the low in April, and the blow-off peak back in June 2020 when the market initially rebounded from the pandemic. Now that this level has been tested and held, the bulls may target the next major obstacle: the historical long-term resistance at $56 that we cited in mid-June.
TradeStation is a pioneer in the trading industry, providing access to stocks, options, futures and cryptocurrencies. See our Overview for more.


