Trade ideas

XLE: Support Holds as More Buyers Step InXLE - Support holds as more buyers step in; this is a good time to start layering in and attempting jump back in

XLE Upside Idea XLE is seeing a bullish crossover on the macd on the daily timeframe and holding pivot support. I believe we can see a bounce off these levels and test the previous high. With reopening in focus and strong performance in energy in the recent week (also earnings of big energy names such as XOM on friday) we can see a potential quick rise in energy stocks.

energy and oil can go crazy so after listening to powel today i saw many things
people don't want cash
they want bonds, they want stocks, they want housing
I think the amount of buying we will see will be crazy and the inflation will go up. i don't necessarily invest like i believe there is inflation but there is
Powel basically said let inflation go up not a problem
oil can go crazy bc it is a measure of inflation in gas prices in a way and the supply chain issues are still bad
i think XLE can see $55-$65 soon
I think oil goes crazy into the summer and chills in highs during summer and then I need more information to talk after that
anyways I think everything is crazy bullish
I don't think anything is in bubble territory yet
watch for more "GME" situations crazy NFT prices and fear in the fed
besides that our so far %90 earnings beats says it makes sense for us to go higher
good luck traders :)

XLE is a tough cookie - bearish trend & negative corr. to WTIWatch for a bounce at the 100 day (which coincides with a major trendline and 0.618 retracement).

XLE Long September 50 CallsJumping into XLE here.
Oil will need to rebound if the market intends to press on, and we see this as a highly likely scenario.
We also had a very nice bounce off the 50% Fibonacci line, as well as a confirmation of support on the 50 EMA.
With a bullish market and multiple entry factors, this looks like a perfect setup for a 10/20% option return.
Feel free to follow this thread as we will be posting updates as this thing moves like all of our trades.
Good luck, All!

APA inter-market analysis ➡️Pattern recognized:
Running flat
➡️Hypothesis:
Bullish
➡️Catalyst:
Earnings in less than 12 days
➡️Conclusion:
Weekly calls that expire after earnings
***This does not constitute financial advice.***
If you like what you see why not support us?
👇


XLE energy not done yetXLE is sitting at a support area and has a decent R of 2.08 if it makes another move back to previous highs.
A play can also be made on CVX, XOM or one of my favorites for a Swing OR Hold play, PBA. If you like dividends then PBA provides
while you wait for an up-move.


XLE Potential Downside IdeaDoing some technical analysis for XLE. Just an idea of how price can move in the coming days or weeks.

Energy is bouta nutXLE has formed a triangle I'm looking to go long once it breaks out. Let me know your thoughts on my charting or whatever.


$XLE cup and handleLooking for a one year base breakout from the cup and handle. Rising energy and crude oil is expected on many different charts. I expect XLE to break above 60 before summer.

Energy Sector Pullback LevelAMEX:XLE is setting up a pullback level to the bottom of the Daily Ichimoku cloud matching with the 2021 Q1 50% Retracement level. It is showing a similar pullback pattern to one of its component stocks NYSE:COP which I took a position in this morning.

50EMA break $XLE, simple analysisXLE looks to be entering a downtrend. If the 50EMA break holds, we should be heading towards the low 44s. RSI is in a downtrend as well. MACD crossing into the bearish territory.
This is a decent EFT to have in your LT portfolio with a ~5.5% dividend. Low 40s would be nice. Mid to high 30s would be great.


Hourly positive divergence on MACDShowing bull divergence on energy with stochastic at bottom of range turning up.

Inter-market analysis NOV 🌦NOV is looking to head up as earnings approaches. Both the XLE and NOV formed running flats Elliott Correction waves.

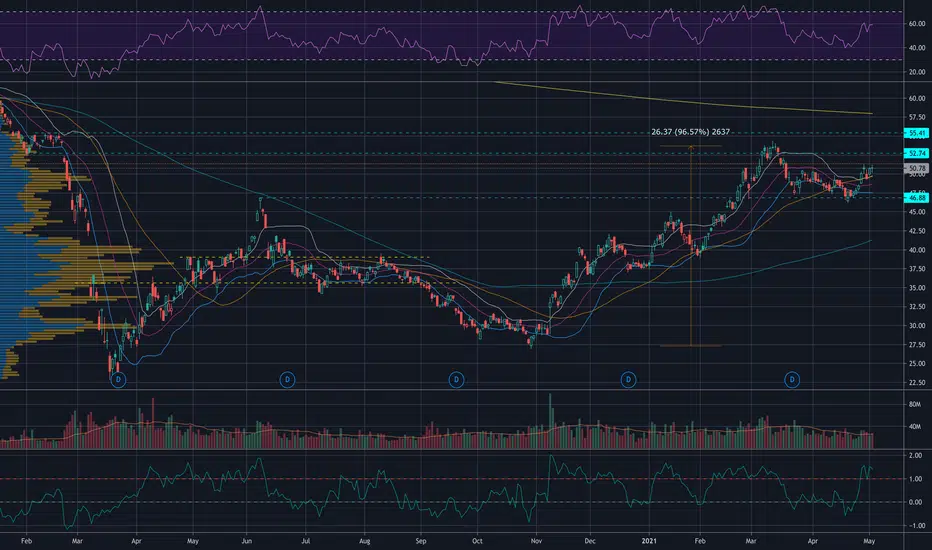
Another Healthy Pullback in Energy ETF?Energy is the strongest sector this year, but is down in the last month. Is it time to buy the pullback?
This chart of the SPDR Energy ETF has some interesting patterns. First are the candlesticks from March 23 and 25: an inverted hammer and then a normal hammer. Both of these are bottoming patterns, which were confirmed when prices bounced in following sessions.
Next, notice XLE’s tight range as it holds $49. That level is also interesting because it was the weekly low immediately after another bounce in early March.
Third, consider the peak around $54 last month. That matched the close on February 21, 2020, immediately before the coronavirus crash. It’s not a surprise that level would offer resistance after XLE doubled from the lows.
But now the sector could make another stab at a breakout – especially as travel resumes in coming months. Cruise and airline restrictions have already been eased. Memorial Day’s on May 31. Just two weeks after that, California reopens fully.
TradeStation is a pioneer in the trading industry, providing access to stocks, options, futures and cryptocurrencies. See our Overview for more.
