XLE-WTI correlation; cue to XLE Cup and Handle 2-year breakoutXLE and WTI demonstrate high level of correlation i.e. move in same direction. XLE provides stock-ETF alternative for traders who do not trade WTI. Interesting to note that WTI has outperformed XLE since Q4 2017 while the latter was capped at a 2-year high printed in December 2016.
Bullish view of WTI and XLE
in previous piece I was looking for swing long WTI as a continuation trade. I see it sitting at potential support. At same time XLE is capped at 2-year high resembling a cup and handle pattern. If WTI long continuation is correct, XLE may do a breakout above this resistance. In fact there is room for XLE to catch up since it is underperforming WTI in the near term.
Bearish alternative
There is a bearish view. When correlation is found question is always which is correct A or B? What if WTI is bearish? Then XLE resistance is justified and the current underperformance would be easily justified as a divergence.
I stick to the bullish view.
Trade ideas

THE WEEK AHEAD: XLE, XOPWith this quarter's earnings pretty much in the rear view mirror, there isn't much single name to play here, particularly since we start right back up again with earnings around the July monthly. Consequently, if you're going to play single name, you may get caught in a volatility expansion running into earnings, so if you absolutely can't resist the urge to pay single name, pay attention to when the next earnings announcements are for the underlying you're playing and take profit aggressively to avoid being "expanded" running into the announcement.
All that being said, there isn't much volatility in single name underlyings at the moment anyway: ORCL (earnings in 17 days), XOM, DIS, CAT, and MSFT round out the top five, but all have background implied volatility at or below 25% and lie in the lower half of their respective 52-week ranges.
As far as exchange-traded funds are concerned, there's no surprise there: energy and/or petro is where the volatility lies at the moment, with USO, XLE, and XOP in the top 5 (the others are FXE and XLU), with their ranks/background coming in at 63/30, 39/21, and 36/34, respectively.
Pictured here is an XLE July 20th 70/80 short strangle that is slightly skewed to the downside, since I think that is where the risk lies. Here are the metrics:
Probability of Profit: 70%
Max Profit: $113/contract
Max Loss/Buying Power Effect: Undefined/$1175/contract
Break Evens: 68.87/81.13
Delta: -9.81
Theta: 3.00
As a potential defined risk alternative, consider an iron fly in the smaller XOP: the July 20th 34/41/41/48 has risk one to make one metrics, is worth a 3.51 credit, and will pay better than the XLE short strangle at 50% max, assuming that price stays within your break evens of 37.49 and 44.51 long enough for you to extract 25% max (.88 profit) out of the trade.

8% Above 50 DayXLE is 8% above its 50 day moving average. Doesn't mean a *massive* reversal, can work off overbought over time.

Compare Equal Weighting to Market Cap Weighting in ETFsAdvance Decline Lines are powerful leading indicators.
Anothr way to explore leads and lags is to see how an equal weighted ETF compares to a market cap weighted ETF
Move the time horizon around to compare XOP (equal) to XLE (market cap)

Breakout Scenario suggests - Energy up! Breakout scenario in XLE
Consolidation range now should act as support


ETF small pull back before testing 280Weekly stoch on ETF They also will rigg banks know earnings done and they sold off XLF


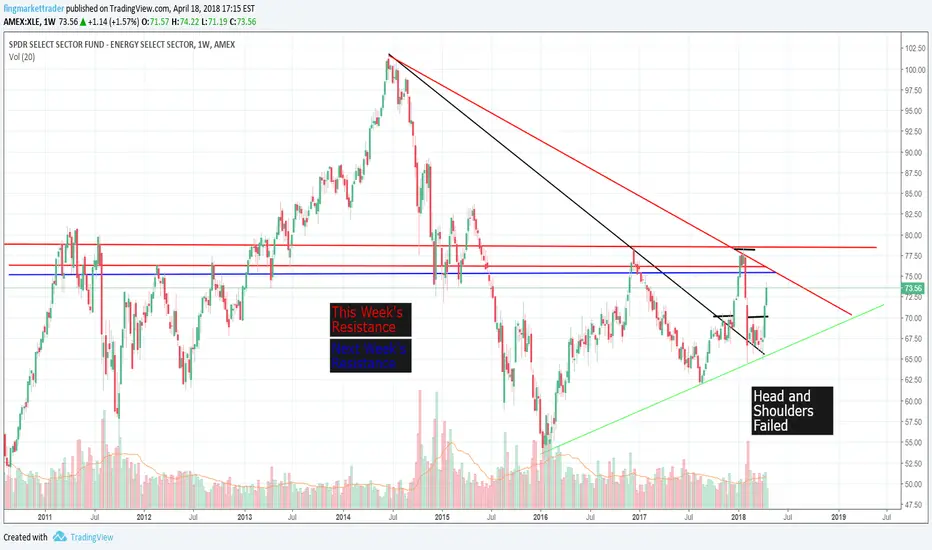
XLE Head and Shoulders Failure Weekly TimeframeXLE is looking strong and should continue up. The Red line just above the Blue line is this weeks first resistance. The Blue line would be considered next weeks resistance if XLE can not test this week.


XLE Energy Play?Energy broke out, set a limit order at the 100day moving average and try to ride the wave up.

$XLE Golden Cross$XLE Golden Cross on the 1hr chart. Oil on the rise. Expect to see mid 70s+ in very near term.

Has the Energy Sector Bottomed Out?Energy stocks in the US rose sharply on Tuesday April 10. XLE went up about 3% with some major stocks like Exxon, Halliburton, Occidental Petroleum or Devon rising substantially.
Looks to us that Energy stocks are ready for a breakout, after years of underperforming the overall market.

Long XLE via June 15 '18 71 CallsAttractive risk/reward after significant sector underperformance vs SPY
S/L below demand zone around 66
Increased confidence above 68.25 opening up room towards 50% retracement area

XLE seeing huge bullish flowI am not a believer in the energy pop in May idea that large money is chasing after here. I guess geopolitical risk could change that. Personally, I think more likely we break trend next couple weeks. I am not giving a bias till flow gives us a better tell.

XLE AccumulationLooks like classic accumulation for big run in energy. Looks like year of commodities getting prepared.


OPENING: XLE JULY 20TH 67 LONG/APRIL 27TH 71 SHORT CALL DIAGONAL... for a 3.14/contract debit (78.5% width of spread).
Another neutral to bullish assumption setup with plenty of time to reduce cost basis. Currently, it looks like you could get a better fill than I did (mid currently at 3.00, 75% of the width of the spread, which is what you're looking for in these setups).
Here, I'm shooting for 20% of what I put the trade on for.
Metrics:
Max Profit: .86/contract*
Max Loss: 3.14/contract
Theta: .37
Delta: 32.33
* -- Assuming no rolls of the short call and finish of the underlying above the short call strike at expiry.
** -- Assuming no rolls of the short call and finish of the underlying below the long call strike at expiry.

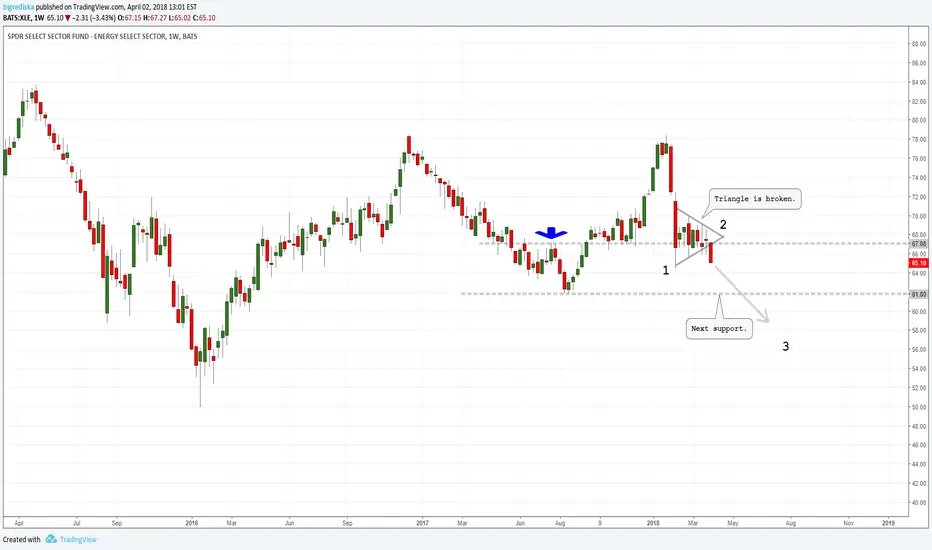
Bearish: Energy Sector testing major $67 support levelTraders have reacted to this $67 level since June 2017 and now being tested as support. Intraday it's been broken many times but look for a break below to continue lower to $64 and $62 targets.
