Energy Sector Trend DownAll major companies across the globe related to energy sector might have made a top... oil bounced down hard as well. Some relief on inlfation or just moment situation... for now its down trend!
Trade ideas

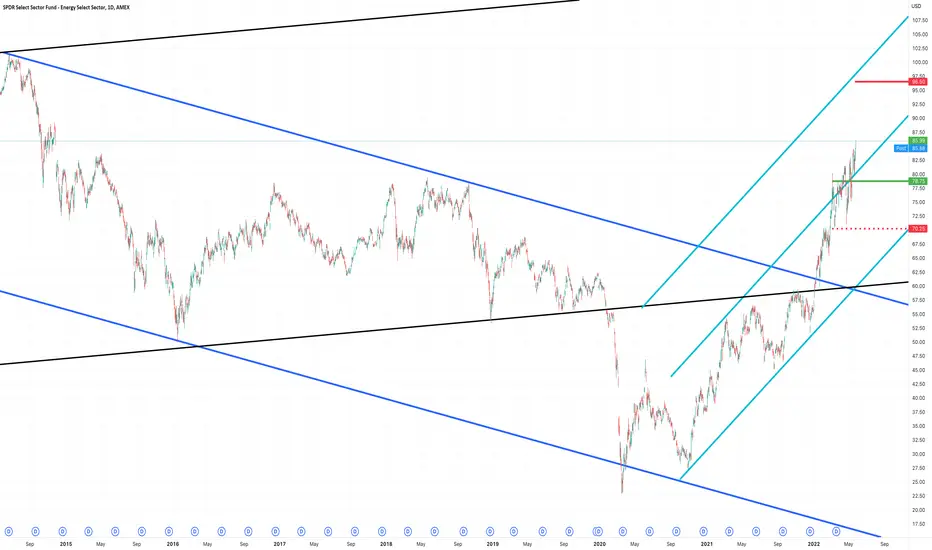
XLE breaks TL but holds vol profile zone(75-77); is 71 or 65 nxtUpdate on my last post that XLE energy sector must hold the red trendline at 79.
BEARISH CASE shortterm: On Thursday it broke not only the TL but also broke below my yellow consolidation box.(middle one). As of now it is holding the volume profile zone at 75 to 77 area. Looking at the heavy selling volume in all sectors, a double bottom at 71 is very probable. 76.70 is the 0.618 Fib level while 71 is the 0.786 Fib.
Worse, we may even see a retest of the blue wedge at the 65 pivot line. That will be a 100% retracement back to the Feb 24 invasion low. (It broke out of the blue wedge & retested it last Jan 2022 & proceeded to make a measured 10 points move to 82 & then another 10 points move to 92)
Still BULLISH longterm:
If XLE bottoms out at the current volume profile zone & reclaims the red trendline in the next few days, we may see a retest of 92 or maybe even push another 10 points higher to 102. You may ask if that is still possible with a slowing economy? Bear markets on average starts 5 months before actual recession (2 consecutive Quarters of negative GDP). We are now at the 5th month but employment & production & consumption numbers still suggest recession is still far out maybe in 2H2023. Either we are in uncharted territory with a prolonged bear market or maybe we will see another melt-up rally first before recession kicks in. This will be possible if inflation & rates slow down with the FED pivoting to less hawkish stance in September after the already priced-in June & July 75 basis point rate hikes.
Note: A slowly rising dollar will not be good for commodities like oil, food, industrial metals & gold but it will help cushion the bad effects of inflation on buying power…good for imports but bad for exports.
Not trading advice. Pls like & follow if this helps!

Is $XLE making a bearish ascending wedge?It seems like the Energy sector ETF $XLE is making an ascending bearish wedge.
It's showing lots of resistance around the $82.9 area and hasn't be able to close above it for the past ~2weeks.
I wouldn't be surprised if it has a fake breakout to the upside before eventually falling back inside the wedge.
Keep an eye out for a break to the down side as the measured objective would be around the $64.7 area.
I'm neutral for the time being but keeping a close eye on this for a bearish reversal.

$XLE ~ Appears correction is occurring...As shown, finally it appears energy companies are cooling off. Expectation is XLE continues to rollover and will create a exceptional opportunity within the next 12-24 months. Will track closely and when the opportunity presents itself, we will be ready.

XLEThe Energy Select Sector SPDR (XLE) is a non-diversified ETF. It tracks the largest oil and gas, consumer fuels and power equipment companies in the S&P 500. The ETF has a dividend yield of 2.5%, and is up 59.8% year-to-date.
The fund is down 5.2% on Monday and is set to see a further decline, however the long-term trend for energy is strongly positive.
Take advantage of short-term weakness at the appropriate opportunity. It is only a matter of time before stocks resume their journey to new highs. Buy the XLE at $80.50 lmt gtc

Rising Wedge in Energy ETFEnergy stocks have been ripping all year , but now there’s a potential reversal pattern in the key sector ETF.
The SPDR Energy Fund has made higher lows and higher highs since mid-May, but the lows have ascended more quickly than the highs. The result has been a rising wedge. That’s a potential bearish reversal pattern with highs failing to confirm the enthusiasm of the lows.
Next, the Parabolic SAR indicator just flipped from a bullish reading to a bearish reading.
Third is the Moving Average Distance indicator at the bottom of the chart. This Custom Script shows price’s distance from a moving average -- in this case the 50-day simple (SMA). Notice how it recently neared the top of its range. While this isn’t a definitive signal in isolation, it shows how Energy is out of step with the broader market. (The S&P 500 is 7 percent under its 50-day SMA while Energy is 9 percent above .) This may create the potential for some catchup to the downside.
Finally, you have the level around $89.22 where XLE peaked in November 2014 before beginning a six-year slide. The fund’s failed breakout through this area could also suggest longer-term resistance remains in effect -- at least for the time being.
TradeStation has, for decades, advanced the trading industry, providing access to stocks, options, futures and cryptocurrencies. See our Overview for more.
Important Information
TradeStation Securities, Inc., TradeStation Crypto, Inc., and TradeStation Technologies, Inc. are each wholly owned subsidiaries of TradeStation Group, Inc., all operating, and providing products and services, under the TradeStation brand and trademark. You Can Trade, Inc. is also a wholly owned subsidiary of TradeStation Group, Inc., operating under its own brand and trademarks. TradeStation Crypto, Inc. offers to self-directed investors and traders cryptocurrency brokerage services. It is neither licensed with the SEC or the CFTC nor is it a Member of NFA. When applying for, or purchasing, accounts, subscriptions, products, and services, it is important that you know which company you will be dealing with. Please click here for further important information explaining what this means.
This content is for informational and educational purposes only. This is not a recommendation regarding any investment or investment strategy. Any opinions expressed herein are those of the author and do not represent the views or opinions of TradeStation or any of its affiliates.
Investing involves risks. Past performance, whether actual or indicated by historical tests of strategies, is no guarantee of future performance or success. There is a possibility that you may sustain a loss equal to or greater than your entire investment regardless of which asset class you trade (equities, options, futures, or digital assets); therefore, you should not invest or risk money that you cannot afford to lose. Before trading any asset class, first read the relevant risk disclosure statements on the Important Documents page, found here: www.tradestation.com .

6/12/22 XLESPDR Select Sector Fund - Energy Select Sector ( AMEX:XLE )
Sector: Miscellaneous (Investment Trusts/Mutual Funds)
Market Capitalization: $--
Current Price: $88.71
Breakout price: $90.50
Buy Zone (Top/Bottom Range): $84.30-$74.05
Price Target: $112.00-$114.20
Estimated Duration to Target: 133-140d
Contract of Interest: $XLE 9/16/22 90c
Trade price as of publish date: $5.90/contract

Energy sector continues to trend against S&P500Energy is going strong, long term trend is set with $XLE outperforming the benchmark index despite market volatility and rates breaking out higher last week.
$XLE/$SPY made a classic Wycoff pattern then shot up higher this year. If history is a guide, this trend is the beginning of at least a decade long uptrend.

XLE may retrace to 82 @ TL; more pain to come if 79 breaksUpdate on my previous warning that XLE is soon to retrace.
BULLISH CASE: XLE reached ATH 93.31, my FIb 2.0 target & retraced. It should bounce at the red Dec2021 trendline @ 82…FIb 1.0 which is a previous April top.
BEARISH CASE: XLE had a very impressive run up since its pandemic low & a correction is overdue at this ideal time when extreme high oil price may dampen demand & OPEC & US to increase production. This correction will be temporary since China has re-opened from lockdown & demand will slowly increase going forward pointing a higher wave 3 or a wave 5 after a potential wave 4 correction whichever case may play out. But if 79 (FIB 0.50 retracement from 65 to ATH) is lost, more pain will come to the broader market SPX. This may also mean that wave 3 has peaked & an ABC wave 4 down may be underway.
Not trading advice

XLE Trading The Bullish SequenceIn this update we review the recent price action in XLE and identify the next high probability trading pattern and price objectives

xle buy signalhello everyone.
this ETF is going to hit 97, therefore you can buy it at current price or 86. your stoploss is 79 and take profit at 97.
don't forget risk management.
good luck.

even my dead grandmother is long XLEShe needs to get ready for a rude awakening on energy prices, we're close to a top or already there today. Logical target is about 75.

XLE short idea
Cracks are starting to show
Been overbought for a while
See the chart for stop and PT

XLE up 100%+ (option price) before June 17thI believe June will be big for the Energy Sector.
Before June 17th, we could see an increase of at least 100% (OTM option price).
Using options so time is the only SL.
Strike: 90
Current Mark Price: 0.71

This Won’t End Well……….It may seem pretty obvious when looking at this chart, but every time oil has spiked rapidly like this, it follows with a massive downturn. It will be interesting to see what happens in the next couple months with crude.


$XLE Incoming Buying Opportunity Posting from a mobile device. I apologize if the chart image isn't perfect.
This is $XLE Energy SPDR ETF. Weekly Candle is forming an Evening Star. High probability of a powerful sell off coming. Long term energy charts are all very bullish. Take profits and/or look for buying opportunities for new longs.

Peak Oil? Downwards reversal loadingXLE is showing early signs of a significant reversal following a 27.5% gain since April 25th this year.
1. Bearish rising wedge pattern forming on the Daily timeframe
2. Descending volume across pattern vs rising price
3. Five unfilled gaps to the downside
Short from $87

XLE a W3 BO of 2GANN FAN lines+wedge move or a bulltrap to W4?XLE formed a big H&S pattern in 2002 & has since bottomed during pandemic. From there, it started a blue rising wedge which had a more chance of breaking down. However, due to the Russian invasion, it broke to the upside above the H&S green neckline.. Measuring the height of this wedge gives a target of 82.40 which XLE had reached & recently exceeded. It also exceeded 2 GANN FAN lines from 2002 & 2020 lows but registered a big red candle the next day.
I think XLE is currently at an impulse wave 3 of 3. XLE must hold 79 for wave 3 to continue higher. Losing 79 may signal a corrective wave 4 of 3 back down to retest the wedge at near the 68 level before a wave 5 0f 3 starts. It may even retest the green H&S neckline started in 2002 approximately near the 66 level.
Supports at 79, 68 & 66.
Resistances at 88 (1.618 Fib) & 92.24(2.0 Fib of recent wave b in a zigzag move)
There is better chance of XLE holding 79 with wave 4 & do the last wave 5 of 3 as the world energy crisis is not abading in the near future. XLE is the ultimate winning sector for months.
Not trading advice

Shorter term XLE short ideaHello friends. We are already in a some macro puts on XLE, but this is a much shorter term idea. We are expecting that over the next few days, XLE will likely fall down. This is because we have price increasing while buying is decreasing, plus the Wave Master indicator is printing several sell signals. Confluence is key!
Thanks for playing,

All set to hit 120?Looks bullish and trading away from its trend line, we can have a big bullish leg towards 120.

XLE trade in progressTaking a look at the XLE, I've analyzed multi-year structures for your review.
I've also plotted area(s) of entry, stop loss and target...
The WTI market has been coiling for quite sometime, I wouldn't be surprised if we break out and start to trend to the upside.
Energy is one of the few performing sectors. I just wanted to share this with you all and I'll keep you updated as it progresses.
A Rising Wedge in the XLE is setting up a shortXLE looks like its forming a nice Rising Wedge on the daily chart. The bad news is we're heading into the Summer which usually leads to higher demand, and Rising Wedges aren't particularly good performers from a statistical standpoint. The good news is that they do offer about 2:1 odds of a reversal once the Wedge breaks. In addition, the momentum indicators are displaying significant bearish divergences, and regardless of seasonality, the macro picture is suggesting global slowing of demand for energy. Therefore, the sum of the evidence makes this look like a good short candidate for a swing trade.
Where it gets a little more tricky is deciding how to get short. As mentioned above, there's about a 2/3 chance of a reversal. The problem is that historically speaking, the average moves of the reversals (-8%) aren't much to get excited about. Over the next 30 days, the Options market is anticipating about +/ $8.84 of movement. This aligns nicely with the idea of a breakdown from the wedge, which could take price down to the Point Of Control on the Volume Profile aruond $76.
All things considered, I like the idea of trading this with a defined risk position like a vertical spread. Something like buying the $80 PUT and selling the $78 in the July 1st expiration. This is trading for about a $0.51 debit and would mature to somewhere north of $1.00 if XLE falls to $76 over the next 37 days.
Thanks for reading; all the standard risk disclaimers apply .
