Three dives and rebound XBT:USDThe classical three dives and rebound chart on BTC, seen numerous times before -> Return to an average mean of around 90 large per.
Key data points
Previous close
—
Open
—
Day's range
—

BITCOIN FORECAST RANGE BETWEEN 66K AND 50K Just testing a theory I've had for awhile now... BTC seems to move between a certain range ever sense its initial spring into a bullish market from around 5k. Using the springs initial range and finding a rough 50% area between the price points you can almost exactly forecast (Swings & Corrections).

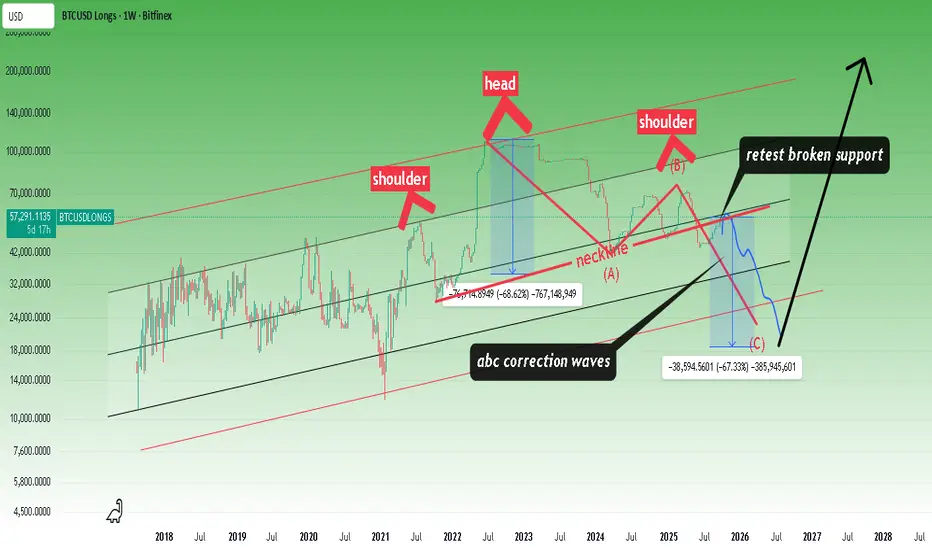
Bitcoin Bear Market Outlook🔴 Over the next 10 months, INDEX:BTCUSD is expected to correct the entire rally from the 2022 low, with downside potential toward the 37K – 30K zone to retest the previous base.
🔵 The structure of the decline remains uncertain, it could unfold as a sharp aggressive drop or a slow bleeding move.

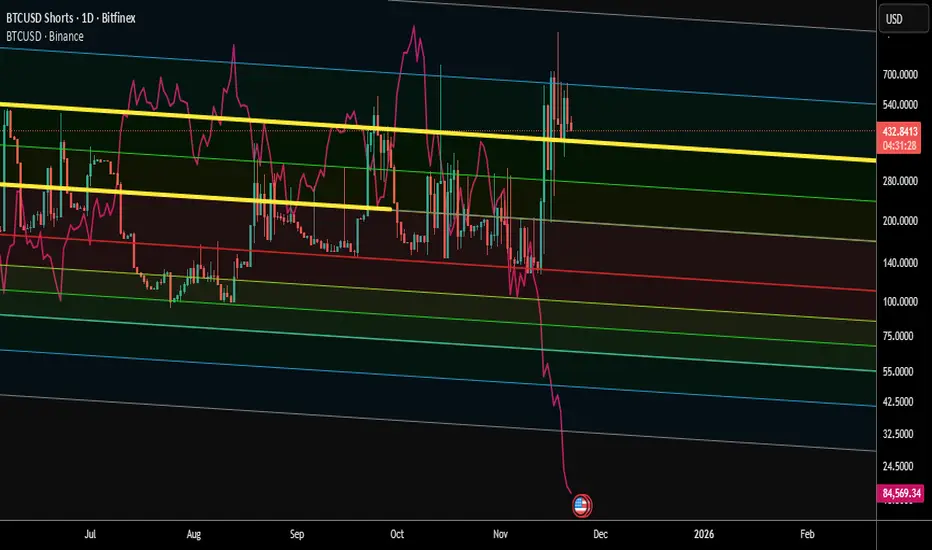
BINANCE LEVERAGED SHORTS WHILE THE EXCHANGE OF BITFNX BUY 6/25BUYING BTC AS THEY DUMP THE PRICE TO PAY LESS TAXES AND CONTRIBUTE TO USD INFLATION.FRAUD OF EXCHANGES AND RICH PEOPLE.
THIS IS THE CHART analysis of the binance leveraged shorts are being heavily shorted, meanswhile, the bitfinex exchange has been buying btc since June 2026; the exchange of bitfi
Bitcoin Bear Market Outlook🔴 INDEX:BTCUSD has confirmed a cycle peak near Target area 127K and begun correcting the entire rally from the 2022 low. This corrective phase could extend for a full year (Oct 2025 – Sep 2026), with the evolving structure defining the depth and character of the move.
🟠 The April 2025 lows (80K–

Possible bearish move on cryptoExited last week, as struggling to enter back into the channel.
If key support breaks, could be a long fall

BTC USA-CHINA Tariff War IndecisionTwo scenarios outlined for BTC as price moves lower due to China-US tariff war. Wait for close confirmation to proceed with long scenario. Shorts have already been triggered (Invalidation is close above resistance).
GGs

Corrective waves continue.Bitcoin's bullish sentiment still far outweighs its bearish sentiment. In my opinion, this is a balancing act. I think the market will stabilize in the coming months.
* The purpose of my graphic drawings is purely educational.
* What i write here is not an investment advice. Please do your own res
Jesse Livermore "opposite day-trading", using emojis.FEAR (crash). HOPE (all will be ok). GREED (safety).
Red flag (Fear, take profit).
People in markets dominantly have two emotion. Greed and fear. Fear (FOMO, fear of judgement, fear of not being right (we want to be right, not make money), fear of failure or not being good enough). Greed (forcing

XBT 113k -> HIGHSSeeing a strong level of support being tested currently at the 113k region
- Watching for buy setup to form
- Higher high higher low break of recent high
- Confirm using indicators

See all ideas
Displays a symbol's value movements over previous years to identify recurring trends.