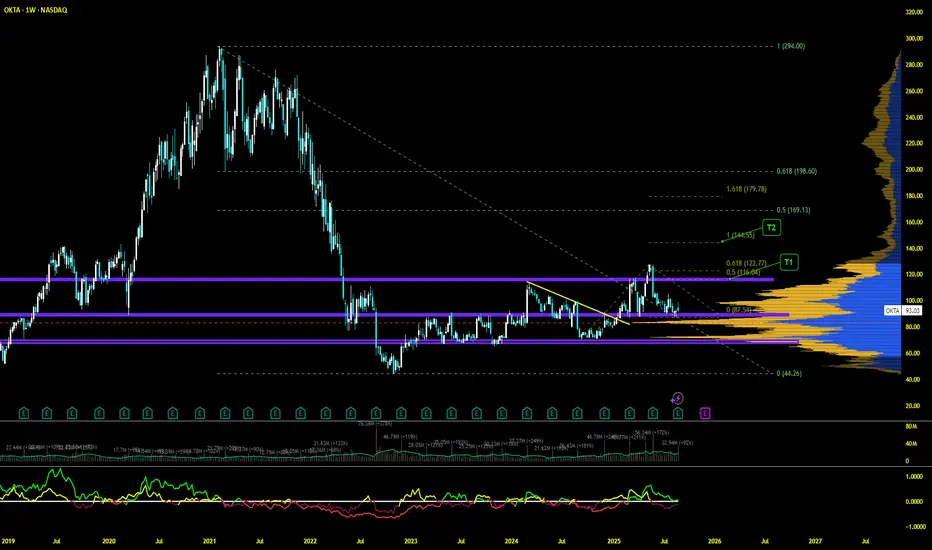
Clean Support and consolidation - Support buy Swing setup Weekly/Monthly Chart looking constructive with clear consolidation since may 2022 up till now
Key Levels $115 / $87 / $70 and $100(just adding this to pay my respect for Psych levels :D)
VRVP clearly crossed above that $87 in Jan 2025 and then held it even though 6 months touched it but never broke
Key facts today
Next report date
—
Report period
—
EPS estimate
—
Revenue estimate
—
0.787 CHF
25.53 M CHF
2.38 B CHF
167.46 M
About Okta, Inc.
Sector
Industry
CEO
Todd McKinnon
Website
Headquarters
San Francisco
Founded
2009
ISIN
US6792951054
FIGI
BBG00LVF1L25
Okta, Inc. engages in the provision of an identity management platform for enterprises. It operates through the United States and International geographical segments. The firm's products include single sign-on, multi-factor authentication, access gateway, API access management, authentication, adaptive MFA and lifecycle management. The company was founded by Todd McKinnon and J. Frederic Kerrest in 2009 and is headquartered in San Francisco, CA.
Related stocks
OKTA - =======
Volume
=======
-Decreasing
==========
Price Action
==========
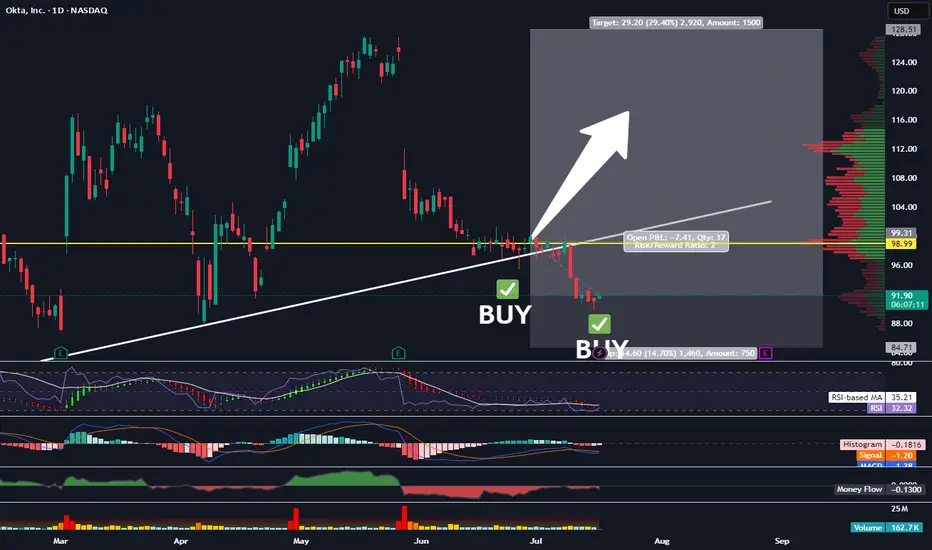
- Bearish flag noticed
- Broken downtrend line but buying pressure is not strong
=================
Technical Indicators
=================
- Ichimoku
>>> price within cloud
>>> red kumo noticed
>>> Tenken + Chiku - below cl
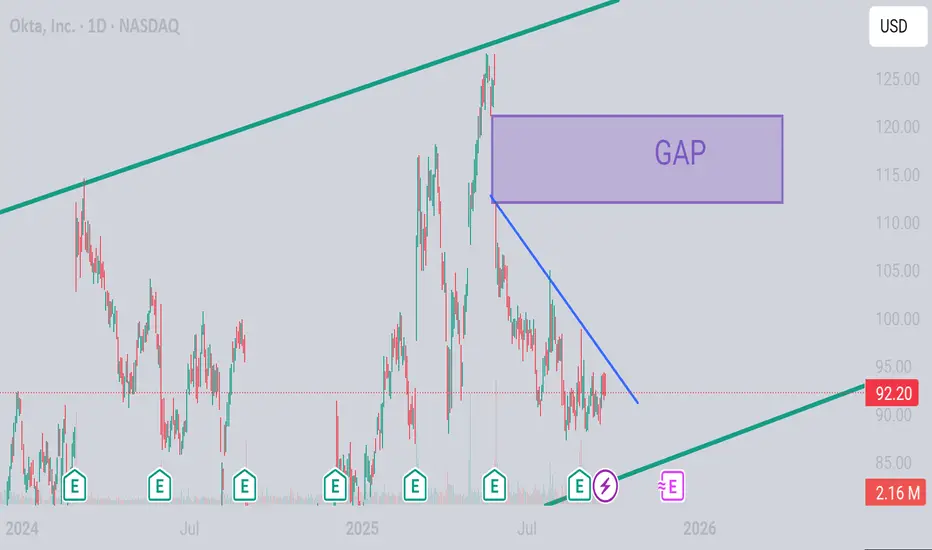
$OKTA wants to "secure" the bag NASDAQ:OKTA 's upward momentum is still in play in this long channel. Just take a look at it's weekly chart. Showing the daily chart here to show gap above. This chart is just pure technicals. For a side note, their high level clientele will need to keep upgrading their security and OKTA is ready to
$OKTA Breakout and Triangle : Bullish Setup Toward $127Given a breakout and sustained consolidation above both the 50MA and 100MA, there is potential for a bullish continuation pattern, possibly forming a "horseshoe" structure targeting the $127 area.
This is a technical observation and does not constitute a recommendation to buy or sell.

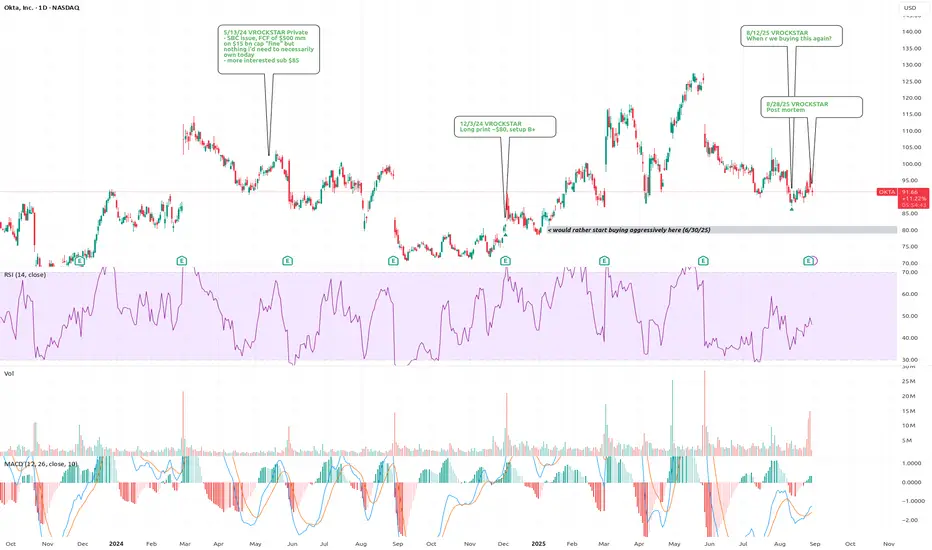
8/28/25 - $okta - Post mortem8/28/25 :: VROCKSTAR :: NASDAQ:OKTA
Post mortem
- solid 2q beat w enterprise traction and pipeline is a thumbs up
- their go to mkt and the panw m&a in the last q def don't help the market's ability to trade this cleanly
- AI not yet pushing the story and i suspect this takes a bit longer (genera
OKTA Earnings Setup | \$100C Aug 29 | 200–300% Potential
# 🚀 OKTA Earnings Setup | \$100C Aug 29 | 200–300% Potential 🔥
📊 **Bias**: Moderate Bullish (75% confidence)
✅ **Beat streak**: 8/8 last quarters, avg surprise +23%
✅ **Analyst upgrade**: Canaccord highlights AI/security tailwinds
✅ **Cash-rich**: \$2.7B balance, strong FCF buffer
✅ **Options flo

8/12/25 - $okta - When r we buying this again?8/12/25 :: VROCKSTAR :: NASDAQ:OKTA
When r we buying this again?
- mid singles EV/sales
- DD growth
- great opex flex
- super lucrative mkt and big lock in
- not competing against bignames NASDAQ:ZS , NASDAQ:PANW etc.
- fcf gen is healthy 2-3% if we ex SBC, closer to HSD if we incl. SBC (i.e.

OKTA: swinging on accumulation range, shakeout confirmationOKTA:
.
Swinging on accumulation range, shakeout confirmation.
Inversed HnS pattern is being formed and confirmed.
Wait for next swing movements on right shoulder, before a jump.
.
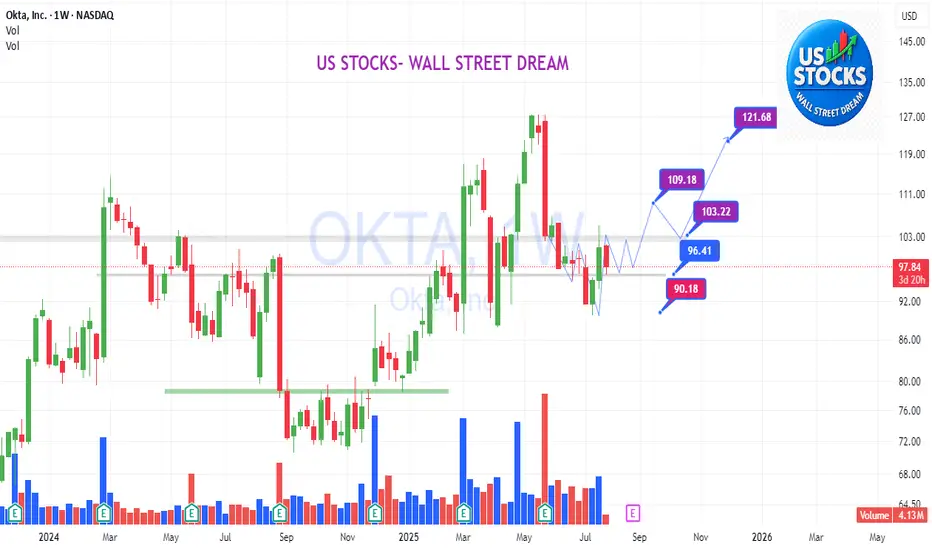
US STOCKS- WALL STREET DREAM- LET'S THE MARKET SPEAK!
$OKTA Gen AI tailwinds are not materializing as of now!- I'm a seller of NASDAQ:OKTA at $124 . Company was undervalued at 70s but has run so much without tangible materializing Gen AI tailwinds.
- Theoretically, Agentic AI should have been a great tailwind for SSO but it appears that industry is not yet focussed on security aspect of it when it come

Picked Up More OKTATraders,
We’re nailing it in the stock division. Our portfolio has gained nearly 30% since the inception of our new indicator in Sept. of last year. And we’ve done that with 50% of our cash on the sidelines nearly the entire time, further reducing risk. It is amazing how I stumbled upon this new tr
See all ideas
Summarizing what the indicators are suggesting.
Neutral
SellBuy
Strong sellStrong buy
Strong sellSellNeutralBuyStrong buy
Neutral
SellBuy
Strong sellStrong buy
Strong sellSellNeutralBuyStrong buy
Neutral
SellBuy
Strong sellStrong buy
Strong sellSellNeutralBuyStrong buy
An aggregate view of professional's ratings.
Neutral
SellBuy
Strong sellStrong buy
Strong sellSellNeutralBuyStrong buy
Neutral
SellBuy
Strong sellStrong buy
Strong sellSellNeutralBuyStrong buy
Neutral
SellBuy
Strong sellStrong buy
Strong sellSellNeutralBuyStrong buy
Displays a symbol's price movements over previous years to identify recurring trends.
Curated watchlists where 0OK is featured.

Software stocks: US companies at our finger tips
49 No. of Symbols
See all sparks
Frequently Asked Questions
The current price of 0OK is 75.041 CHF — it has decreased by −1.11% in the past 24 hours. Watch Okta, Inc. Class A stock price performance more closely on the chart.
Depending on the exchange, the stock ticker may vary. For instance, on BX exchange Okta, Inc. Class A stocks are traded under the ticker 0OK.
We've gathered analysts' opinions on Okta, Inc. Class A future price: according to them, 0OK price has a max estimate of 113.05 CHF and a min estimate of 59.71 CHF. Watch 0OK chart and read a more detailed Okta, Inc. Class A stock forecast: see what analysts think of Okta, Inc. Class A and suggest that you do with its stocks.
0OK stock is 1.13% volatile and has beta coefficient of 0.90. Track Okta, Inc. Class A stock price on the chart and check out the list of the most volatile stocks — is Okta, Inc. Class A there?
Today Okta, Inc. Class A has the market capitalization of 12.55 B, it has decreased by −0.82% over the last week.
Yes, you can track Okta, Inc. Class A financials in yearly and quarterly reports right on TradingView.
Okta, Inc. Class A is going to release the next earnings report on Dec 3, 2025. Keep track of upcoming events with our Earnings Calendar.
0OK earnings for the last quarter are 0.74 CHF per share, whereas the estimation was 0.69 CHF resulting in a 7.49% surprise. The estimated earnings for the next quarter are 0.60 CHF per share. See more details about Okta, Inc. Class A earnings.
Okta, Inc. Class A revenue for the last quarter amounts to 593.45 M CHF, despite the estimated figure of 580.62 M CHF. In the next quarter, revenue is expected to reach 581.41 M CHF.
0OK net income for the last quarter is 54.62 M CHF, while the quarter before that showed 51.32 M CHF of net income which accounts for 6.42% change. Track more Okta, Inc. Class A financial stats to get the full picture.
No, 0OK doesn't pay any dividends to its shareholders. But don't worry, we've prepared a list of high-dividend stocks for you.
As of Oct 23, 2025, the company has 5.91 K employees. See our rating of the largest employees — is Okta, Inc. Class A on this list?
EBITDA measures a company's operating performance, its growth signifies an improvement in the efficiency of a company. Okta, Inc. Class A EBITDA is 144.29 M CHF, and current EBITDA margin is 1.34%. See more stats in Okta, Inc. Class A financial statements.
Like other stocks, 0OK shares are traded on stock exchanges, e.g. Nasdaq, Nyse, Euronext, and the easiest way to buy them is through an online stock broker. To do this, you need to open an account and follow a broker's procedures, then start trading. You can trade Okta, Inc. Class A stock right from TradingView charts — choose your broker and connect to your account.
Investing in stocks requires a comprehensive research: you should carefully study all the available data, e.g. company's financials, related news, and its technical analysis. So Okta, Inc. Class A technincal analysis shows the strong sell today, and its 1 week rating is sell. Since market conditions are prone to changes, it's worth looking a bit further into the future — according to the 1 month rating Okta, Inc. Class A stock shows the strong sell signal. See more of Okta, Inc. Class A technicals for a more comprehensive analysis.
If you're still not sure, try looking for inspiration in our curated watchlists.
If you're still not sure, try looking for inspiration in our curated watchlists.