The King of $SNAP is back, with a price target of at least $13As a seasoned multimillionaire trader, I’ve navigated countless market cycles, and few trades have been as straightforward and profitable as Snapchat. Historically, NYSE:SNAP has offered clean technical setups and predictable momentum, making it one of the easiest gains in my portfolio.
Currently, I see a compelling opportunity unfolding:
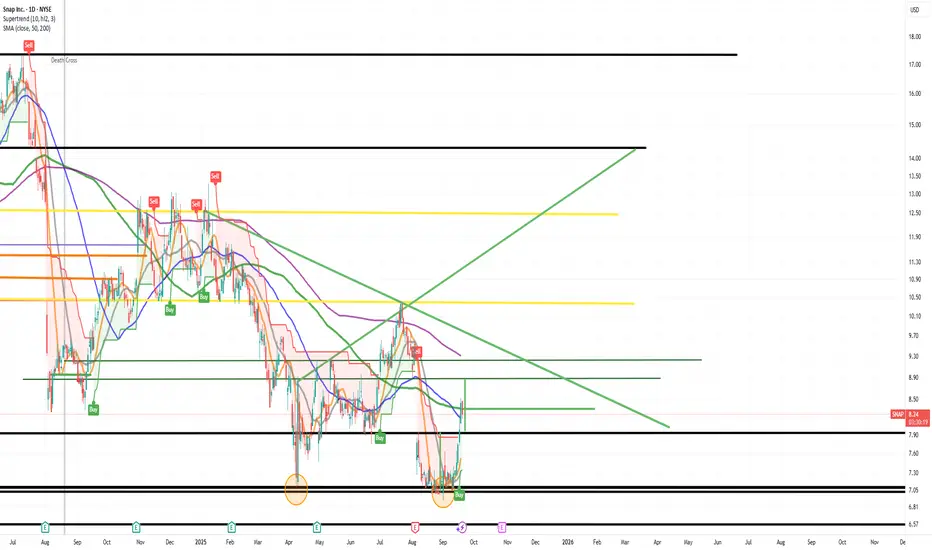
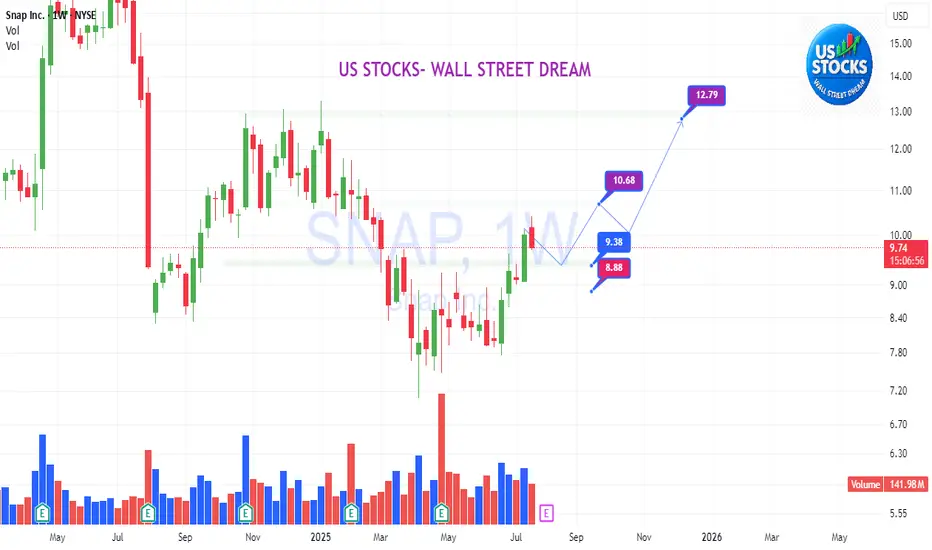
Initial Target: $9.25 – This represents a gap-fill level that I consider virtually guaranteed based on historical price action and volume profile.
Breakout Potential: $11.00 – Once NYSE:SNAP clears the $9.25 threshold, I expect a rapid move toward $11, driven by momentum and short-covering.
Major Resistance: $13.00 – This is where I anticipate the next significant pause or consolidation.
1) Cup and Handle
2) Doulbe Bottom
Given the current setup, this is an ideal time to initiate a long position. The risk/reward ratio is highly favorable, and the technical indicators support a bullish continuation.
And yes, I’m sharing this publicly — not because I expect anyone to listen (let’s be honest, most won’t), but because I like receipts. When NYSE:SNAP hits these levels, I want the record to show: I called it first.
Strong buy recommendation. But hey, ignore it if you want — I’ll be too busy counting gains.
1SI trade ideas
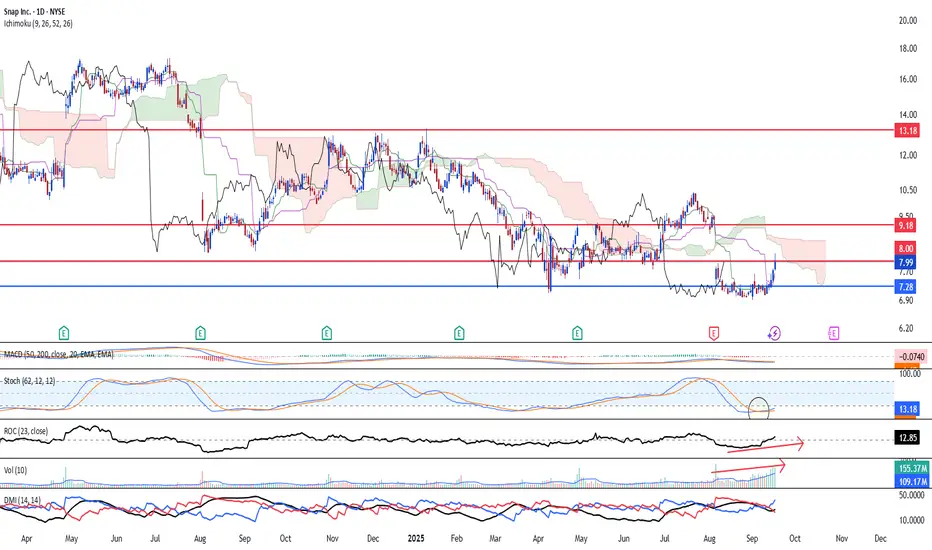
Short-term buy for SNAP due to oversold signalNYSE:SNAP has been way oversold for a period of time and is getting ready for a possible mean reversion to the upside. Volume has been climbing steadily and this indicate renewed bullish interest. SNAP is likely to continue higher should it breaks US$8.00 psychological level. Ichimoku shows two out of three bullish golden cross. Stochastic has confirmed its oversold signal. 23-period ROC is back into its positive levels. Near-term target is at 9.18 should 8.00 breaks. Cut if stocks falls below 7.13
Snapchat to 100? only 7 now.Snapchat is under 10 bucks again after weak earnings last quarter.
Analysts and I still see an attractive 10 year growth potential in SNAP.
50-100 dollars over the decade or sooner.
We got Palantir correct, and it took 2 years to reach the 10 year plus potential.
Can this happen to SNAP?
from my ai agent, summary:
"Snap Inc. (SNAP) shows strong 10-year growth potential, with analyst EPS estimates rising from $0.26 in 2025 to $2.23 by 2034, implying a ~27% CAGR (capped at 25% for conservatism). At a PEG2 valuation (P/E=50), the stock could hypothetically reach $111.50 by 2034, a ~1,400% increase from the current $7.34, driven by ad revenue growth and user expansion."

SNAP Back to Reality: Why This Stock's a BuyThe core of this bullish thesis is that SNAP has moved past its period of post-IPO turbulence and is at an inflection point. The company, which has been undervalued due to market skepticism about its path to profitability and competition from rivals like TikTok and Meta, is now poised for a major rally. This is based on a confluence of factors, including a successful business pivot, strong user engagement trends, and a growing, diversified revenue stream.
Growing and Engaged User Base (DAUs/MAUs): Despite intense competition, SNAP continues to grow its user base, especially in the Rest of World markets. This growth indicates that the platform's unique focus on visual communication and friend-to-friend messaging is resonating with a global audience. The sustained increase in Daily Active Users (DAUs) and Monthly Active Users (MAUs) provides a solid foundation for long-term revenue growth.
Diversified Revenue Streams: While advertising remains the primary revenue driver, SNAP has successfully diversified its business. The rapid growth of Snapchat+, the paid subscription service, is a critical component of this thesis.
High-Margin Revenue: Snapchat+ provides a high-margin, recurring revenue stream that is less susceptible to macroeconomic advertising cycles. The growing subscriber count indicates strong user loyalty and a willingness to pay for premium features. This proves that SNAP is more than just an ad platform and has other avenues for monetization.
Advertising Platform Improvements: SNAP has made significant improvements to its advertising platform, particularly in direct-response (DR) advertising.
Improved ROI for Advertisers: By enhancing tools for small and medium-sized businesses and improving its ability to measure ad effectiveness, SNAP is attracting more advertisers and increasing their spending. This shift from brand-focused advertising to performance-based (DR) advertising is crucial for sustainable revenue growth.
AR as a Unique Differentiator: SNAP's focus on Augmented Reality (AR) is a major competitive advantage. The company's AR Lenses and shopping features are a unique and engaging way for brands to connect with consumers, positioning SNAP as a leader in a high-growth sector.
Operational Efficiency and Path to Profitability: After significant restructuring and cost-cutting measures, SNAP is showing a clear path to profitability.
Improved Margins: The company's focus on cost control, coupled with the growth of high-margin revenue streams like Snapchat+, is leading to improved profitability metrics like adjusted EBITDA. The company's balance sheet is also solid, with a strong liquidity position and improving cash flow.
Potential for Multiple Expansion: The market has been undervaluing SNAP, reflected in its low Price-to-Sales ratio. As the company demonstrates consistent user and revenue growth, and especially as it moves towards consistent profitability, a "re-rating" of the stock is likely. Investors will begin to see it as a mature growth company rather than a speculative tech stock, which could lead to a significant expansion of its valuation multiples.
Trade Idea:
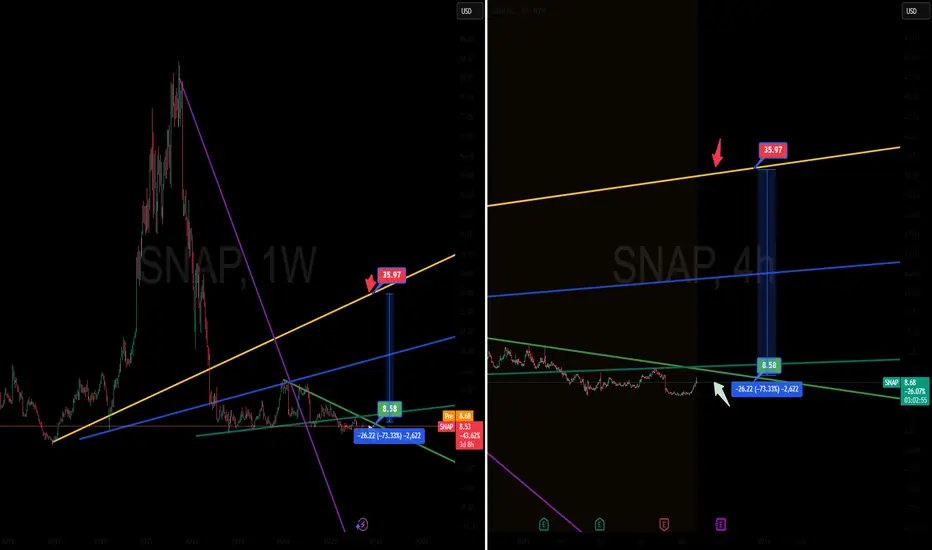
Entry at Green Arrow ($8.69): The green arrow marks a crucial technical support level. The price has likely hit a multi-year low or a major bottom, where sellers have exhausted their supply and strong buying interest has emerged.
Exit at Red Arrow ($35.97): The red arrow marks the price target for exiting the long position.
Disclaimer
This analysis is a hypothetical interpretation of a bullish trading strategy and is not financial advice. The rationale is constructed to justify the specified entry and exit points. All trading involves risk, and past performance is not indicative of future results.
SNAP is a buy nowhi traders
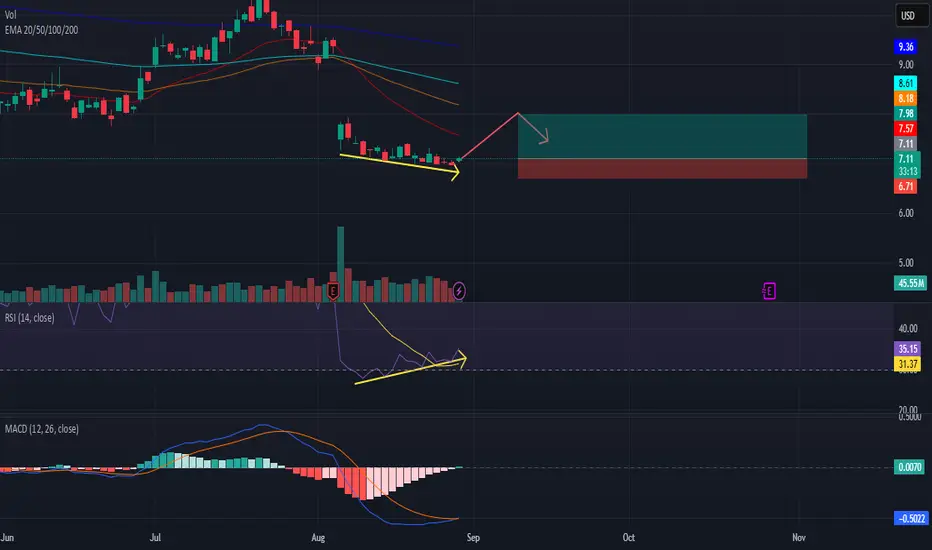
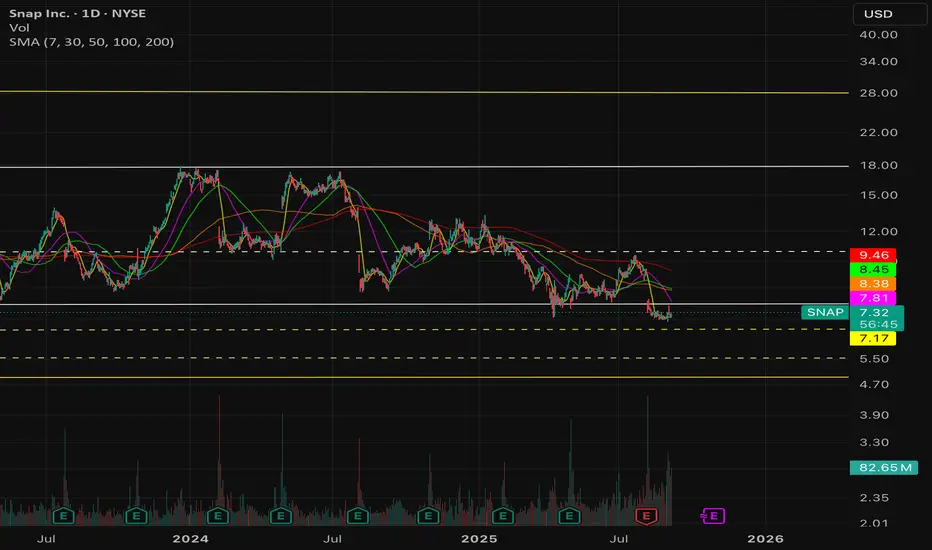
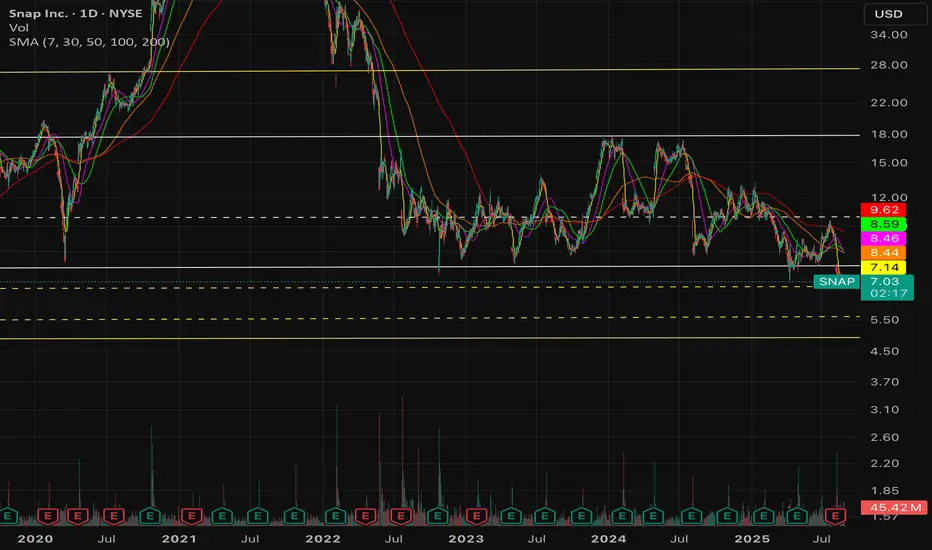
1. Snapchat (SNAP) has been in a downtrend recently, trading below its 20, 50, 100, and 200-day EMAs.
Price is currently around $7.11, below all major moving averages, which act as resistance.
The last earnings (red "E") saw a sharp gap down, which means sentiment is still cautious.
2. Volume
A big spike in volume occurred after earnings, followed by declining volume. This suggests the panic selling may have settled, and accumulation might be starting.
3. RSI (Relative Strength Index)
Current RSI is 35.15, slightly above oversold territory (30).
I spotted a bullish divergence: price made a lower low, while RSI held higher — this can hint at a possible reversal.
4. MACD (Moving Average Convergence Divergence)
MACD histogram is turning positive, and you’re right — the MACD line crossed above the signal line, which is a bullish sign.
However, it’s still below the zero line, meaning momentum is improving but not yet fully bullish.
5. Support & Resistance
Immediate support: around $6.70 – $7.00 (recent consolidation zone).
Resistance: $7.57 (20 EMA), then $8.18 (50 EMA), and major resistance around $9.36 (200 EMA).
🔎 Conclusion:
Short-term: There are indeed bullish reversal signals (RSI divergence + MACD crossover). This could lead to a bounce toward 8$
Medium-term: Trend is still bearish until SNAP can break above the 50-day EMA (~$8.18) with volume.
Risk: If it loses $6.70 support, it could revisit lower levels.
Anyway, I am buying now based on the bullish divergences on 1D and 4h time frames.
Good luck!
SNAP Looks promisingNYSE:SNAP building a base around $7.1 👀
If support holds, breakout targets → $8.9 / $9.2 / $10.3 📈
⚠️ Below $7.1 = invalid.

SNAP - time to buy1. Technicals
The stock price fell 92% from 2021 September to 2025 September. The trend is down.
But. The weekly candle is a promising hammer, and the weekly volume overtakes the earnings week volume, alltough this week nothing happened.
On the 4hr chart the 50MA started to work as support. In the last month the price failed to break the 7.0 level. Any attempt going lower were bought aggressively with volume. Accumulation happening?
2. Fundamentals
Earnings report were not so bad.
PEG is low.
The Bytedance sale of Tiktok rights in US is still on the table.

SNAP LONG IDEA - "CEO: STARTUP STYLE RETURN POTENTIAL" NYSE:SNAP SPARKS:REDDIT NASDAQ:META NYSE:PINS
I believe the upside is massive compared to the limited downside. Snap got an offer of 30 billion from Google back in 2017. Since then Snap has grewn from 187 million Daily Active Users to 470 million DAU. With todays cash burn snap should be well financed at least through 2026.
Letter from CEO 08.sept: Our current stock price reflects doubt. At this valuation, there’s startup-style return potential. But unlike a seed-stage company, we’re a team of 5,000, serving almost half a billion people every day. That means extreme accountability. Every line of code, every sales call, every minute, every day matters.
All thoughts are appreciated.
Oh Snap!🫰 Chat seems to be in great danger but where many see chaos, I see opportunities. Snap Chat is already within the buy Zone, so snap chat may snap at any moment.

SNAP (3D) – Potential Reversal Setup with Bullish Divergenceshi Traders
Let's have a look at SNAP stock.
It gets a lot of hate recently, but chart looks good for a bullish reversal.
📊 Chart Overview
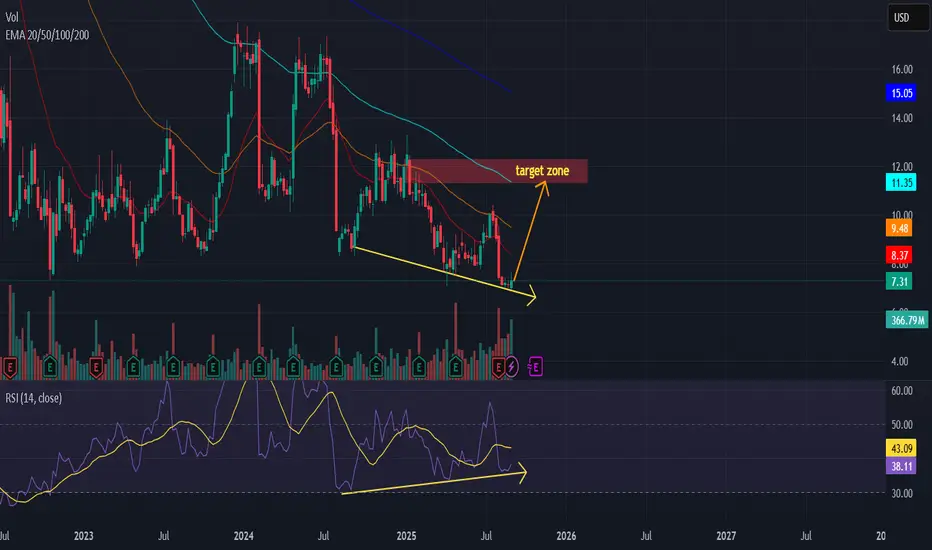
Current Price: $7.31
EMAs in play: 20 EMA ($8.37), 50 EMA ($9.48), 100 EMA ($11.35), 200 EMA ($15.05)
Volume: ~366.8M
🔎 Technical Analysis
Falling Wedge Structure
Price has been making lower lows but within a narrowing falling wedge pattern.
The wedge is approaching the support trendline, suggesting potential for a breakout.
Bullish Divergences (RSI)
RSI has formed higher lows, while price made lower lows.
This is a classic bullish divergence, hinting at weakening bearish momentum.
Volume Pickup
Recent green volume spikes suggest accumulation near the bottom support zone.
🎯 Target Zone
First target: $9.50 (50 EMA resistance).
Extended target: $11.35 – $12.00 (100 EMA + strong supply zone).
⚠️ Risk Management
Stop-loss: Below $6.80 (recent swing low, wedge support).
Risk/Reward Ratio: ~1:2.5 if aiming for $11–12 zone.
I personally won't sell below 11.
📈 Trading Idea
SNAP is showing signs of a potential bullish reversal on the 3-day timeframe. The combination of a falling wedge, bullish RSI divergence, and increasing volume supports a bounce toward higher resistance zones. A sustained break above the 20 & 50 EMAs could trigger momentum toward the $11–12 target zone.
Snapchat: A Value Play with Growth Upside About to SNAP?I like beaten-down stocks. They often trade at a discount when compared to their intrinsic value. Of course, this needs to be backed by prospects of growth and a path to profitability.
I think $NYSE: SNAP gives us this. The stock is donw 88% since its all-time high in 2021. At the same time, the number of users (DAU) is growing, and margins are improving and the business metrics are telling me that this stock has a good risk/reward profile.
Currently, SNAP reminds of NASDAQ:META in 2021/22 when the stock price dropped over 70%, to later recover by 600%.
The forward PE is at 10, and the PS ratio is at 2.1, which, when compared to competitors like META, represents a good discount.
Here's my fundamental analysis. 🥂
THE GOOD:
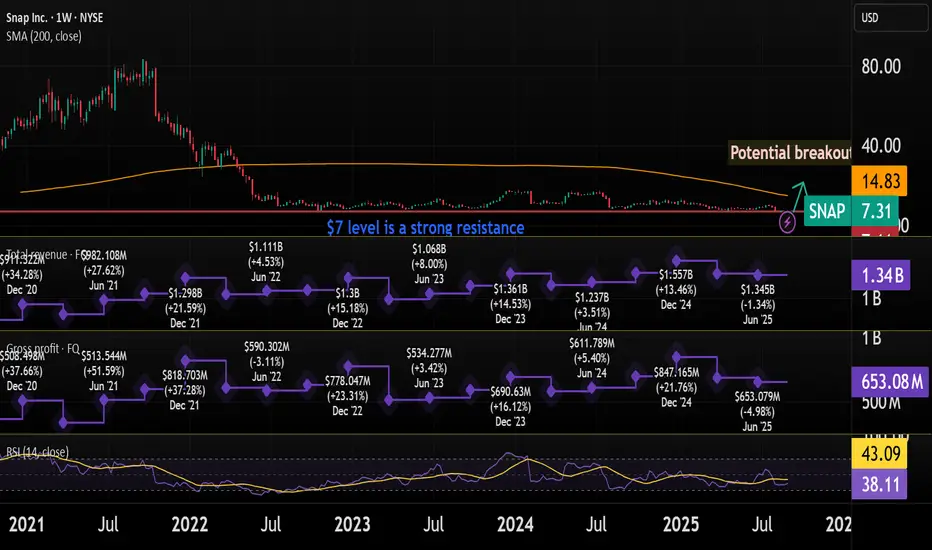
The number of users (DAU and MAU) continues to grow. Q2 2025 saw MAUs hit 932 million (up 7% YoY) and DAUs 469 million, with time spent up 23%.
Ads remain ~87% of revenue ($5.36 billion full-year 2024, up 16% YoY—the fastest since 2021), but AI tools like 7/0 Optimization (performance-based bidding) and Sponsored Snaps (20-30% higher conversions) doubled active advertisers in 2024. In addition, user subscriptions are also growing fast.
AR lenses (8 billion daily uses, up 20% YoY) boost e-commerce conversions 30%, positioning Snap for the $100 billion+ AR market by 2030.
Adjusted EBITDA flipped positive at $41 million, with free cash flow at $24 million quarterly ($392 million TTM).
Cash hoard: $2.89 billion, providing 2+ years' runway without dilution.
Trading at 2.11x TTM sales (vs. S&P 500's 3.1x and peers like Pinterest at 5x), SNAP embeds deep pessimism.
Analysts' median price target is at $9, providing some safety margin.
THE BAD
Despite user growth, monetization lags: Global ARPU stagnated at $2.87 in Q2 2025 (vs. Meta's $11.89).
Snap's growth slowed to 9% in Q2 (the slowest in a year), with Q3 guidance at 10-12% ($1.475-1.505 billion).
Debt-to-equity at 202.57% (2.03x) raises leverage risks.
Instagram/TikTok copy features (e.g., Stories, Reels), eroding Snapchat uniqueness.
MOVING FORWARD
Snapchat continues to make strong investments in R&D and its AI capabilities.
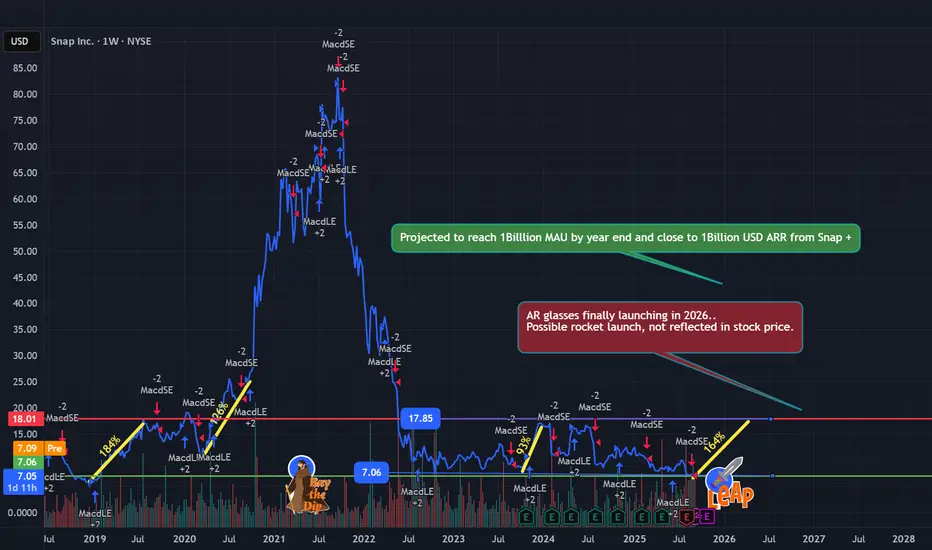
User premium subscriptions are growing very significantly, and they might cross $1 billion 2026 in recurring revenue.
TECHNICAL ANALYSIS
There's a strong resistance at the $7 level. This level has been acting as a resistance since 2022.
WHAT I'M DOING
I'm allocating around 0.5% of my portfolio to SNAP. Going to move with caution, considering this stock is quite volatile and there are still many uncertainties. I might DCA in case the price drops while the fundamentals are good.
Quick note: I'm just sharing my journey - not financial advice! 😊
Evan kindly step down for the sake of shareholders! - NYSE:SNAP has one of the highest concentration of Gen Z who use NYSE:SNAP on a daily basis.
- C-level leadership is clown at NYSE:SNAP who have gotten rich by cashing out big time on the expense of shareholders
- Leadership should be ejected for the sake of shareholders, The day Evan steps down, NYSE:SNAP will fly
- Bulls have defended $7 support one more time. Idk how long will it last but let's ride it
When $5?- NYSE:SNAP has consistently disappointed shareholders for last 3 years. It's been a defined trade but not an investment.
- It's sitting again at support $7 but is it enough to justify excessive stock based dilution and bad S level leadership?
- This company is run like a fraternity. CEO should step down before the company is buried to the ground.
Snap Safe Entry Zone.Hi again guys i wish you doing good.
Regard Snap Stock i deleted the stock from my Watchlist since USA made deal with China that China will give Tiktok with new engine for USA which will effect Snap Profitability.
After that stock free fall to current level! which is STRONGEST SUPPORT LEVEL !!! i dont believe Snapchat will go any low further than current price it only has one direction which is UP-movement.
Despite all negative news all whatever going on regarding Snapchat stock the company not that bad the risk to profit ratio is pretty much strongly high now.
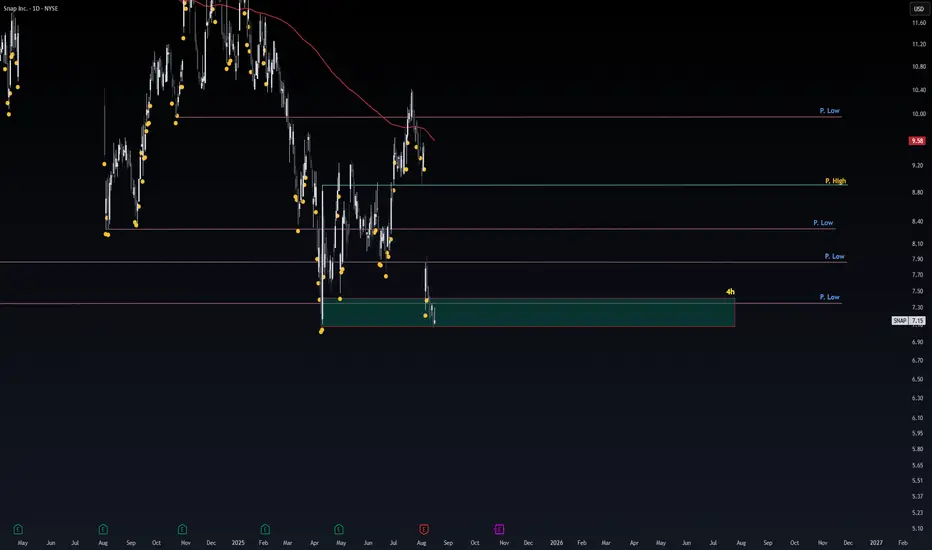
Each Pink Line. P.Low(Previous Low) is strong Resistance/Support that stock will respect.
and same for Each Blue Line. P.High(Previous High).
Note: 1- Potentional of Strong Buying Zone:
We have two scenarios must happen at The Mentioned Zone:
Scenarios One: strong buying volume with reversal Candle.
Scenarios Two: Fake Break-Out of The Buying Zone.
Both indicate buyers stepping in strongly. NEVER Join in unless one showed up.
2- How to Buy Stock (safe way):
On 1H TF when Marubozu/Doji Candle show up which indicate strong buyers stepping-in.
Buy on 0.5 Fibo Level of the Marubozu/Doji Candle, because price will always and always re-test the.
Take Care Wish you and me big profits no loses !
for me im long holding at current price levels.
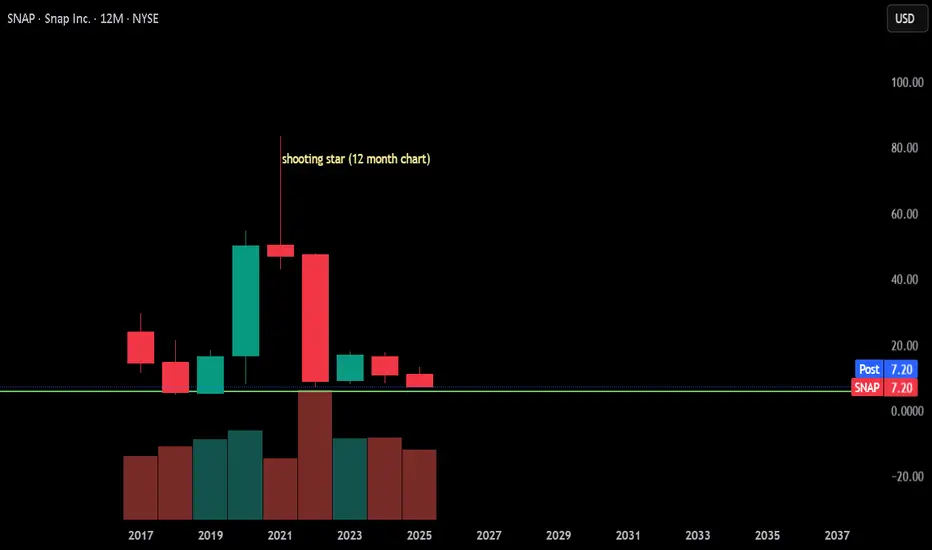
SNAP really snapped in 2021& let this be a lesson for us all. I remember this person who was buy the dip in that shooting star candle. I guess they had tons of money. Not sure if they are still bag holding or what, but I decided... let me learn a little bit more for myself.
These are 12 month candles. They tell stories too.
I am not on the platform and really don't understand why the hype. I know people get monetized so that was a thing. Maybe the story will turn around, but feel free to always look on all time frames.
Unless you just believe. It's easier for me to believe at the bottom than at the top (in wicks).
Maybe I'll read around to see what's going on with the snap... maybe.
Enjoy your weekend
8/22/25 - $snap - Um...8/22/25 :: VROCKSTAR :: NYSE:SNAP
Um...
- you have 1/7th of the global population using this each month.
- about 7% of the global population using this each day (453 mm)
- when you factor in affordability etc. etc. you're realistically addressing probably 30% of the global pocket of users, daily
- and for like <$30/user... (so 13+ B mcap divided by 453 mm users)
- seriously?
- forget cash burn
- that's a global platform growing users
- and you get this access to data/ attention DAILY for <$30/user (LTV??)
- someone's not doing the math here.
- i can't help but think this might become a deep area of research for me into next year as a potential top pick into '26
- am i missing anything
- starting w/ a 2% ST position to get toe in at this pt
V

SNAP oversold, preparing to reverse upAfter oversold, SNAP slightly sideways with above average volume. Price is too low, back to 01.2019 price. So, the possibility of bullish reversal is very high.
The price now (Closed on 08.19.2025): $7.18.
Price target: $8.93/ $11.38/ $12.94.
Stop loss: $6.69.
Risk/ Reward ratio: 3.57.
IMO, amateur trader.

Snap Inc. — key weekly support area for long positionsSnap Inc.
Regularly Pays Cash as Salaries
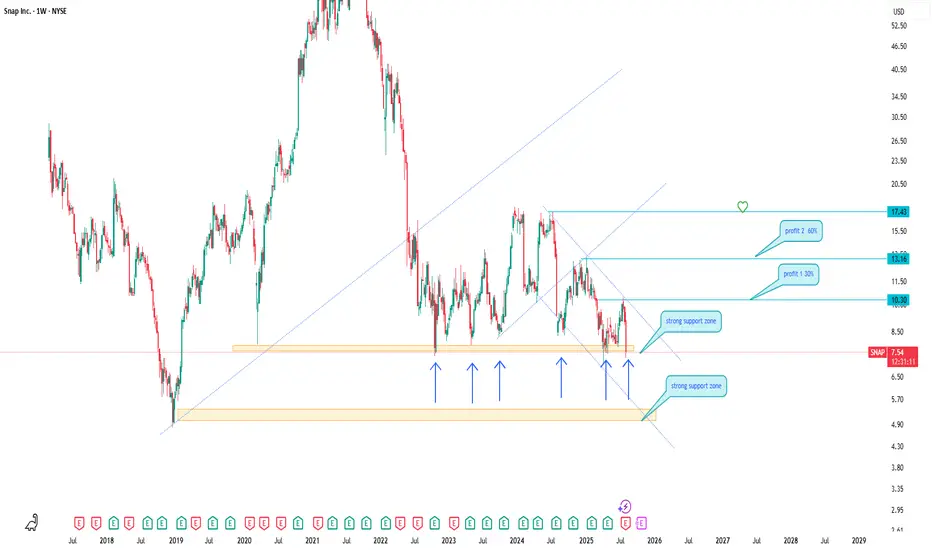
Price is testing a strong support zone near 6.00–7.00 USD, held since 2022.
Bullish reversal signals are forming. First target: 10.30, second target: 13.16 to 17.43.
Potential upside exceeds 60 percent.
The area is attractive for mid-term investors if the support holds. If price dips lower, I will average the position at 5.50 USD within the extended support zone.
"simple deal that makes money"
SNAP: Will you join plan with us?SNAP:
.
Will you join plan with us?
Do you want to ride a whole long-term wave that rises from the bottom?
.
US STOCKS- WALL STREET DREAM- LET'S THE MARKET SPEAK!
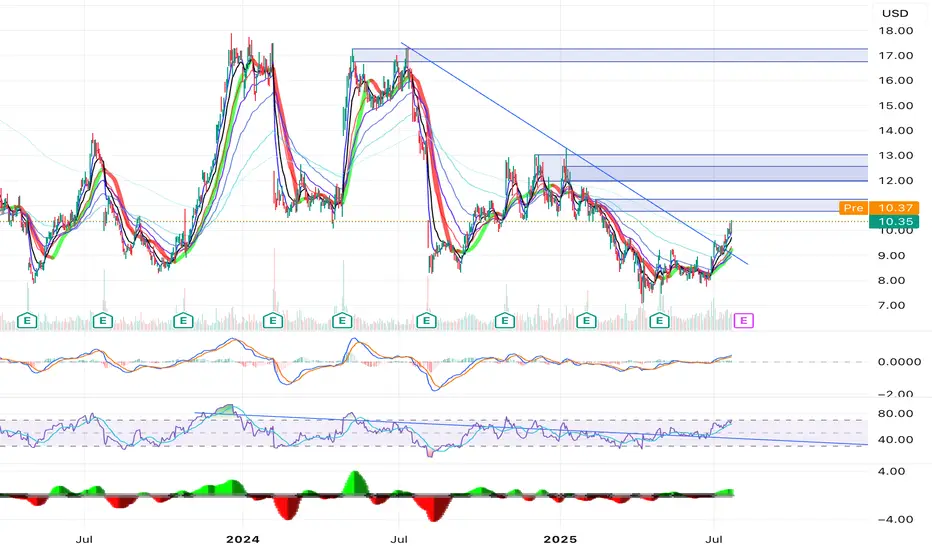
SNAP out in the open :-) SNAP is out of the 1 year long downtrend trendline.
Alot of bullish signals:
- Trendline breakout
- alot of EMA's crossed
- Squeeze indicator green
SNAP is in the Wyckoff Accumulation phaseThis Week (July 8 - 12):
Support: The 20-week moving average around $9.00 is now the immediate floor. Below that, the recent support shelf is at $8.00.
Resistance: The first hurdle is the recent high around $10.40. Above that, the path opens up towards $12.00.
Next Month (July/August):
Support: The absolute low of the Selling Climax at $7.10 is the line in the sand that must hold.
Resistance: A major zone of contention will be around $14.00, which was a significant support/resistance area in the past.

$SNAP -- accumulation $8 into $9. big move brewing into earningsHello, extensive chart here: Daily and Weekly. Looking at this name I like the setup here. The Daily and Weekly chart shows strength in this area, $8 to $9 with heavy accumulation and support. The Weekly chart shows about 13 weeks of this bottoming area with tons of buying from previous years as well. NYSE:SNAP has earnings July 25th and I will be looking to enter $10 calls with a date of 8/15. The premiums could spike just into earnings since it is a popular name to play around that time and it has plenty of daily volume. The SMA and EMA on the weekly honestly is my target -- it is a big sell zone. We are in the liquidity area and have been. Will be starting a position on these contracts this coming week. This name should see $10 with relative strength but my first target is mid $12 before earnings. I would like to shed some contracts into the earnings date and see if we can make an extra buck or two on profited contracts so when earnings comes it can be a risk free stress free play.
WSL.

SNAP - Bullish Reversal in Playhi traders,
* Reclaimed Support Zone
Price has successfully reclaimed a key historical support around the $8.06–$8.72 range, which previously acted as a base before major rallies. This suggests growing buyer interest at this level.
* RSI Breakout
On the RSI, we’ve seen a clean breakout from a long-term descending trendline, which has capped momentum since late 2023. This momentum shift increases the probability of a bullish continuation.
* Reward/Risk Outlook
This setup shows two potential targets:
🎯 Target 1: $12.80 (mid-range resistance)
🎯 Target 2: $17.34 (multi-year resistance level)
Stop-loss is strategically placed below the reclaimed support zone at around $7.76–$7.79, offering a favorable risk/reward profile.
The confluence of technical signals—price reclaiming support and momentum confirmation via RSI breakout—indicates a possible trend reversal. Bulls could be regaining control, making this an attractive swing opportunity.
