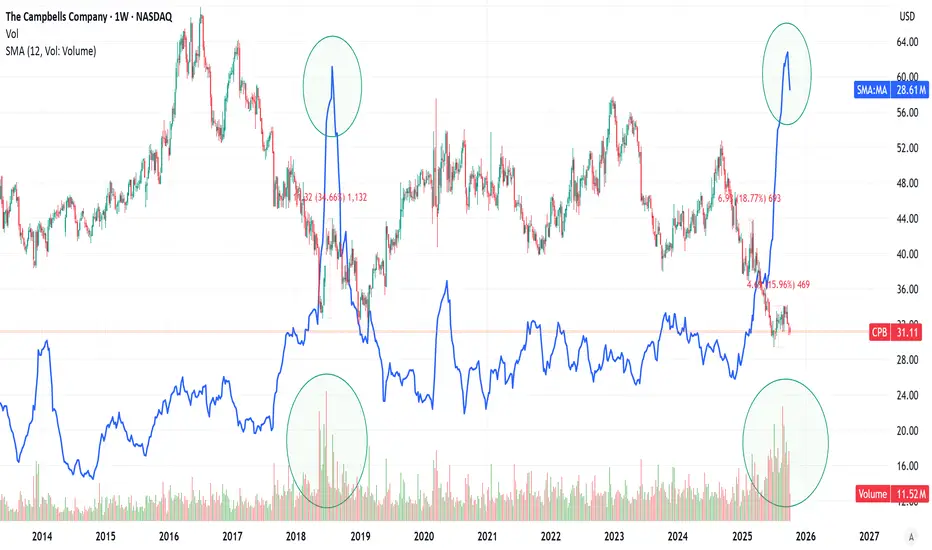
The Campbell's Company "Volume" guys out there, this is for YOU!" Volume of trade measures the total number of shares or contracts transacted for a specified security during a specified time period. It includes the total number of shares transacted between a buyer and seller during a transaction. When securities are more actively traded, their trade volume is high, and when securities are less actively traded, their trade volume is low."
Trade ideas
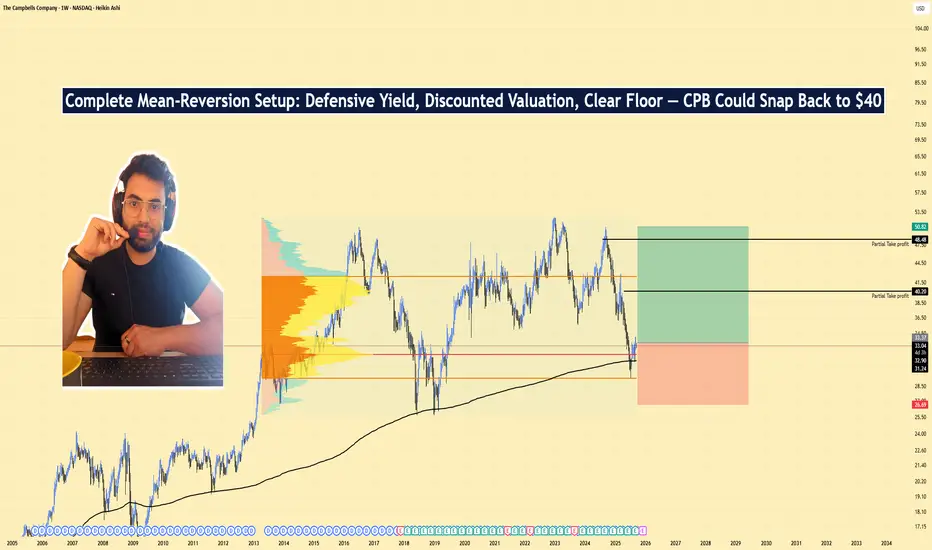
CPB | Long Setup | Defensive Staples Mean-Reversion | Sep 2025🚩CPB | Long Setup | Defensive Staples Mean-Reversion off 52-Week Support | Sep 15, 2025
🔹 Thesis Summary
Campbell’s (CPB) is basing just above its 52-week low with a 4.7% dividend and a discounted forward multiple. A modest earnings reset appears priced in; a staples rotation plus cost discipline can drive mean-reversion toward mid-30s/upper-30s.
🔹 Trade Setup
Bias: Long
Entry Zone: $31.20–$32.10 (staggered bids toward the 52-week floor at $30.41)
Stop Loss: $26 (clear break of the 52-week floor)
Take-Profits:
TP1: $40
TP2: $50
Max Target: $50.00 (mean-reversion band)
🔹 Narrative & Context
Structure: Price has carved a multi-month base around $30–33 after a persistent 1Y drawdown. Defensive bid plus dividend support favors accumulation near the lower third of the 52-week range ($30.41–$51.56). Beta = 0.26, fitting a low-vol rotation backdrop.
🔹 Catalysts: Upcoming Q1 FY26 report early Dec; watch gross-margin commentary (inputs/tariffs), elasticity in Snacks/Meals, and Sovos integration run-rate.
Ownership: ~35% insider and ~65% institutional ownership underpins stability and alignment.
Dividend: 4.69% indicated yield provides carry while the base resolves.
🔹 Valuation & Context (Pro Metrics, Framed Simply)
Forward P/E = 12.45× vs peer set ~13–16× (GIS 12.99×, HRL 15.9×, KHC 9.7×, MDLZ 18.6×) → Slight discount to staples ex-value outliers → Market pricing in weak near-term EPS → Supports a mean-reversion long.
P/FCF = 13.9× → FCF Yield ≈ 7.2% (mid-pack vs GIS ~8.7%, KHC ~11.4%, MDLZ ~3.6%) → Solid cash coverage of dividend and reinvestment → Helps defend the base.
Growth: EPS This Y −15.5% (reset) vs Next Y +5.2% → Near-term trough dynamics with modest rebound potential → A small beat/guide raise could unlock multiple expansion.
Risk: Beta 0.26 and ESG risk score ~27 (medium) → Low market-beta but operational execution still matters → Suits a defensive sleeve.
🔹 Contrarian Angle (Your Edge)
Street sits at “Hold/Reduce” with ~mid-$34 targets. The market priced in the FY26 reset; however, a low-teens forward P/E, a 7% FCF yield, and base-building above $30 set a floor. If gross margins surprise on mix/sourcing, CPB can re-rate toward 14–15×, implying $38–$40 without heroic growth assumptions.
🔹 Risks (Balanced)
Further input-cost/tariff pressure compressing gross margin.
Volume share loss to private label/“better-for-you” categories.
Integration slippage on Sovos or incremental promo spend to defend shelf space.
🔹 Macro Considerations
Staples leadership typically improves during risk-off or rising-volatility regimes; monitor XLP/SPY relative strength.
Rates/inflation path drives grocery pricing power and promo cadence.
Track category scans (soup/snacks/sauces) for elasticity and private-label encroachment into FY26.
🔹 Bottom Line
CPB screens slightly cheap on forward earnings with durable cash flow and dividend carry. The $30–33 base offers a defined-risk entry for a mean-reversion long into year-end and early 2026. Execution on costs and stable volumes are the swing factors.
🔹 Forward Path
If this post gains traction (10+ likes), I’ll publish:
A weekly-chart update with level-by-level triggers,
Post-earnings read-through on margins/mix, and
A peer-relative valuation refresh (GIS, KHC, HRL, MDLZ).
Like & Follow for structured ideas, not signals. I post high-conviction setups here before broader narratives play out.
⚠️ Disclaimer: This is not financial advice. Always do your own research. Charts and visuals may include AI enhancements.
🔹 Footnote
Forward P/E: Price divided by expected earnings over the next 12 months. Lower = cheaper relative to profits.
P/FCF (Price-to-Free-Cash-Flow): Price vs. the cash left after investments. A measure of efficiency.
FCF Yield: Free cash flow per share ÷ price per share. Higher = more cash returned for each dollar invested.
ROE (Return on Equity): Net income ÷ shareholder equity. Shows management efficiency with investor capital.
ROIC (Return on Invested Capital): Net income ÷ all invested capital (equity + debt). A purer profitability gauge.
Debt/Equity: Debt divided by equity. <1 usually means balance sheet is conservative.
R:R (Risk-to-Reward): Ratio of expected upside vs. downside. 3:1 = you risk $1 to make $3.
$CPB: Campbell Soup – Simmering or Boiling Over?(1/9)
Good afternoon, everyone! ☀️ NASDAQ:CPB : Campbell Soup – Simmering or Boiling Over?
With CPB at $38.21, is this iconic soup maker a tasty investment or a stale option? Let’s ladle out the details! 🔍
(2/9) – PRICE PERFORMANCE 📊
• Current Price: $ 38.21 as of Mar 24, 2025 💰
• Recent Move: Down from $43.00 (early 2025), an 11% dip, per data 📏
• Sector Trend: Consumer goods volatile, inflation pressures, per posts on X 🌟
It’s a mixed stew—let’s see what’s cookin’! ⚙️
(3/9) – MARKET POSITION 📈
• Market Cap: Approx $11.4B (298.5M shares) 🏆
• Operations: Soups, snacks, meals, strong brand presence ⏰
• Trend: Digital sales up, per historical data, but competition fierce 🎯
Firm in the pantry, but is it a staple or a luxury? 🏭
(4/9) – KEY DEVELOPMENTS 🔑
• Recent Earnings: Q4 2024 mixed, revenue up, EPS missed, per data 🌍
• Innovation Push: Plant-based, keto options, per reports 📋
• Market Reaction: Price reflects caution, per posts on X 💡
Stirring the pot with new flavors! 🍲
(5/9) – RISKS IN FOCUS ⚡
• Inflation: Higher costs squeeze margins 🔍
• Competition: Private labels, Kraft Heinz, per data 📉
• Health Trends: Shift to healthier options, per posts on X ❄️
It’s a spicy market—watch out for heat! 🛑
(6/9) – SWOT: STRENGTHS 💪
• Iconic Brand: Campbell’s soup, strong loyalty 🥇
• Diverse Portfolio: Soups, snacks, meals, per data 📊
• Dividend Yield: ~3.5%, attractive for income seekers 🔧
Got a robust recipe for success! 🏦
(7/9) – SWOT: WEAKNESSES & OPPORTUNITIES ⚖️
• Weaknesses: Perceived as less healthy, innovation lag, per data 📉
• Opportunities: E-commerce growth, plant-based trends, per strategy 📈
Can it spice up its offerings or stay stuck in the past? 🤔
(8/9) – POLL TIME! 📢
CPB at $38.21—your take? 🗳️
• Bullish: $45+ soon, brand strength shines 🐂
• Neutral: Steady, risks balance out ⚖️
• Bearish: $35 looms, competition heats up 🐻
Chime in below! 👇
(9/9) – FINAL TAKEAWAY 🎯
CPB’s $38.21 price tags a mix of nostalgia and uncertainty 📈. With a strong brand but competitive pressures, it’s a stock to watch. DCA-on-dips could be a savory strategy! Gem or bust?

CPB starts uptrend for long termWe have a strong support line.
Target $51.39 (02.2026).
Gain 35% from now (04.10.25, $37.78).
-----
Dividend 3.92%.
IMO (Amateur trader).

CPB 1 Month Chart Technical Analysis
Chart Patterns: Rising or Ascending wedge(bearish) broke beneath the support trendline(green).
Exponential Moving Average: EMA 9(green line) is below EMA 21(red line) bearish.
Bollinger Band (BB): CPB is in the lower band(green) it could be bullish, however, let's check the volume to make sure this isn't signifying a reversal upwards.
Moving Average Convergence Divergence: The MACD(green line) is below the signal(red line) bearish.
Volume: The volume for last month (Monday 3, Feb 2025) is lower than this month's volume (Monday 3, Mar 2025). This month volume has an increase in bearish volume.
Red Rectangular Box: CPB since it didn't break to the upside this box of choppiness doesn't matter.
Green Rectangular Box: This box represents support; where the most bullish activity is.
Opinion: Bearish on the 1-month chart. Everything pertaining to the chart looks promising. CPB closed below my trendline $40.33, I see it going to my next target $37.23.
Out of the money options (OTM): Puts for 38 Jun 25 100
1.40 x 100= $140
