$FTNT ready to break?I like the setup and think it's ready to break the resistance.
There is also a gap down to be filled. Maybe this week we can have that break. I'm in and long.
Fortinet, Inc.
No trades
Trade ideas

FTNT sell off is it over?Fortinet experienced a sell-off despite a double earnings beat. The company's fundamentals remain robust, characterized by solid financials and positive free cash flow (FCF). Fundamentally, nothing has changed.
From a technical analysis standpoint, the price reacted to the first algorithmic target level and subsequently retraced to the Last Point of Support (LPS), a key level within my proprietary theory. According to this framework, the price must now react with an explosive upward move, similar to what was observed in Duolingo. The theoretical price target is the second algorithmic target level, which coincides with all-time highs.
This is for educational purposes only. Not financial advice.

FTNT eyes on $70-72: Fib supports hope to hold earnings DUMPFTNT earnings report has apparently disappointed.
The crash finally stopped at support zone $70.69-72.09
Looking for accumulation here and climb back up soon.

FTNT: At Long-Term Support. 🔹 Fortinet (FTNT) Market Update 🔹
The chart shows FTNT currently testing a critical support zone (~$79–$80). If this level breaks, we may see deeper downside risk. However, strong earnings fundamentals and volume structure suggest the possibility of accumulation at current levels.
🔹 Key Levels to Watch
Support: $79.68 (critical), $74.42 (secondary)
Upside Fib Targets: $134 → $150 → $171 → $194
Resistance Zone: $111–$121 (supply / prior premium zone)
🔹 Market Outlook
Earnings remain solid — strengthening the bull case.
Technicals point to a potential bottoming/accumulation structure.
A confirmed hold above current support could trigger momentum toward triple-digit levels.
📊 Conclusion:
This is a pivotal moment for FTNT. Breakdown = caution. Hold & build = opportunity for significant upside.
#Fortinet #FTNT #WaverVanir #InstitutionalTrading #MarketIntelligence #Accumulation

The hidden information within a stock chart FTNTFTNT had an excellent report. The CEO guidance stated growth for this year. Yet, retail analysts suddenly reversed their upgrades to a minor downgrade. The stock collapsed 26% which is absurd. What is behind this sudden collapse? Is FTNT going to go down more?
No FTNT gapped down on a fear of an event, rather than an actual event.
Learn how to find fundamental price levels. Learn how to read a stock chart and identify who was and is in control of price. Buy Side Institutions foot prints and Buy Zones are entirely different than Sell Side Institutions who are short term trading the stock market and often acting as Market Makers. Learn what candle patterns indicate professional traders are in the mix. Learn how to identify a Buy on the Bounce and when to stop selling short a gapped down stock. When you can read a stock chart as easily as reading a book, your income from trading stocks will be more consistent, and your monthly income will increase.
Trading stocks is more than just finding a stock to trade. Being a semi-professional trader who makes a living at trading stocks or extra monthly income in retirement, requires a breadth of knowledge that is all in learning to read the stock charts correctly.
Who controls price is a critical analysis you should use all the time.

FTNT Bullish set upPotential bounce shown by the ascending triangle pattern. Strong earnings and company growth.
FTNT Long-Term Support & SetupWith Fortinet (FTNT) recently reporting strong Q2 earnings and beating expectations on both top and bottom lines, the stock is seeing a sharp sell-off. Driven by macro uncertainty, rising competition, and weaker Q3 guidance, this move was anticipated for months as FTNT has been trading at the top of a well-defined trend channel, and we've been waiting for a pullback to key long-term support levels.
Fortinet's Fundamentals:
With the semiconductor rally stealing the headlines, the demand for cybersecurity is only rising in tandem with the digital transformation and AI adoption. FTNT remains at the top when it comes to firewalls and network security with consistently high margins, strong FCF, and revenue. Long-term, FTNT is a strong player, and the fundamentals support higher valuations.
This quarter:
- Revenue $1.63B (+13.6% YoY)
- EPS $0.57 (+16.3% YoY)
- Cash From Operations 451.9M (+32% YoY)
- Gross Margin 80.7%
- ROIC 37.5%
This pullback was expected at some point this year and represents a strong opportunity to capitalize on increased demand for a top cybersecurity firm.
On the monthly chart, FTNT has now retracted to its major technical area near $70 - an area of strong historical support and key moving averages:
- The 50-month SMA sits around $69.4, an area where high volume-by-price is elevated, showing high interest starting around the $69.6 level.
- FTNT has respected the 50 SMA numerous times over the last several years, typically at the bottom of this trend channel.
The weekly & daily charts show a similar story:
- The 200-week SMA also aligns ~ $69.4, reinforcing the idea of a strong long-term support to be tested.
- The 1000-day SMA around the same zone has acted as another reliable bounce level - notably in November 2023 and July 2024, where the stock launched to all-time highs after the bounce.
Trade Setup:
- Entry: Initiate position ~ $69-70
- Add to position ~ $65 (a multi-year trendline support & final buy zone)
- Target 1: $96 to fully close the gap following recent earnings
- Target 2: $110+ (prior highs and back to the top of the trendline resistance)
Swing trade, holding for 4-12 months depending on momentum and shifting macro environment

Mean Reversion Trade: FTNT1. RSI in oversold region
2. Price likely to rebound back the the mean
Trade Rules:
Entry Trigger - RSI has cross below oversold region, enter limit buy at close price
Exit Trigger - Close at market when close price cross above exit trigger (Red step line)

FTNT - Precision Swing Trade Setup📈 Symbol: FTNT (Fortinet)
⌛ Timeframe: Daily Chart
⚡ Strategy: High-Conviction Swing Trade (5-10 days)
🎯 Pinpoint Trade Execution
Entry: $103.00 (Key psychological level + SMA 50 confluence)
Stop-Loss: $95.80 (7% risk, below July swing low)
Take-Profit: $118.16 (14.7% upside, pre-earnings resistance)
Risk-Reward: 1:2.1 (Optimized ratio)
📊 Technical Rationale
✅ Triple Confirmation Setup:
Connors RSI2 Signals: Back-to-back buy triggers (July 10-11)
Volume Surge: 30% above 20-day avg on reversal candle
MACD Flip: Bullish crossover at -2.5 (oversold rebound)
Key Levels:
Defense Line (SL): $95.80 (Protects against false breakout)
Profit Zones:
$110.50 (Partial take-profit at 50% Fib)
$118.16 (Full exit at 61.8% Fib + VWAP resistance)
⚡ Smart Trade Management
1️⃣ Entry: $103.00 limit order
2️⃣ Stop Strategy:
Initial SL: $95.80
Adjust to $101.00 if price hits $108.00
3️⃣ Profit Plan:
Sell 30% at $110.50
Trail remainder with 2-bar low exit
🌐 Fundamental Context
Earnings Date: July 25 (Plan exit before)
Short Interest: 8.5% float (squeeze potential)
Institutional Activity: 13F filings show $200M+ inflows
⚠️ Critical Risk Notes
Sector Risk: Tech volatility (monitor SOXX ETF)
Earnings Gap Risk: July 25 event may override technicals
Alternative Scenario: Invalidated below $95.80 → Wait for retest
#PrecisionTrading #Cybersecurity #RiskReward
👇 Like/Comment if you'd take this trade!
🔔 Follow for institutional-grade setups
(Chart: Daily timeframe with Fib levels + volume profile)

$FTNT In a Wedging PatternI bought a ½ size position on June 2nd after it had tremendous volume and institutions protected it from slipping below the 50 DMA the day before. It has been nothing but sideways since and I am slightly underwater. My stop is a decisive close under the 50 DMA. I did not feel the Wed June 18th qualified as decisive.
Mark Minervini may call this a VCP (Volatility Contraction Pattern). In any event it is clearly in consolidation mode and could break either way. I will either be selling if it does not recover the 50 DMA or will be adding if / when it closes above the downward sloping upper trendline.
I thought this would be a good one for your watchlist. If you like the idea, please make it your own and follow “your” trading rules. Remember, it is your money at risk.

FTNT to 150 this yearWith the market pumping I believe the greedy will suffer the next two quarters. Cybersecurity is generally a safe bet when the market spooks. This contraction is my main style of swing trading. I am in multiple wedge setups like this right now and just entered calls on FTNT.
BBWP and stochastic have room to run
Might need a few weeks for this to play out so I went further out
My plan:
9/19 120$ calls

Not a bright future for tech stocksAfter almost touching level 1.618 on FiB, confirming positive news regarding the latest financial results and positive market conditions, #FTNT took a hard hit on the current tariffs being in talks, as part of their portfolio consists in physical hardware.
Even though, considering their regional market exposure, quite well divided between US and EU, FTNT took a hard hit and it continues to go lower.
Next region to be visited will be 80$, which is 30% down from ATH. I foresee it in the near future, as we may see escalations on broader market.

$FTNT Fortinet looking strong in CybersecurityWith YoY growth turning positive and stock trend confirming being above both 50 and 200 SMA Fortinet is looking like a solid hold. It has stood resilient in this downturn as well. Some headwinds could be from tariffs though - yet to be seen.

FTNT - LONGThis name looking juicy , 6/6 vs my conviction rules has it all . I like the hold out power vs the recent market retracement moves FTNT held up nice .
In it at 109.68 vs first entry
trade updates in comments (for reference 5M was used for entry threw screenshot )

Time to add some Cybersecurity stocks to your Portfolio?In the video I take a look at FTNT, CRWD and FFIV and I bring the case for some cybersecurity investing.

Quick flip - long FTNT-FTNT is solidly in 12M, 6M and 3M uptrends.
-It bounced nicely today off of near term support and its regression channel bottom.
-It has been an excellent trade for me using my algo + FPC exit. Historically, (including backtesting) its W/L is 340-2* (the 2 are the last 2 days) though I didn't trade it yesterday. I'm already regretting not buying a double lot today to make up for that.
-Since April, no trade has taken more than 3 days to close profitably and that only happened once. 68% of them have closed profitably in one day (16 of 25 trades).
Over its history with this system, the average holding period with FTNT is 12 trading days and has an average gain of 2.12% (45% annualized and .17% per day held). That's 4x the average daily return of SPY. In this twitchy market, another selling point is that over its entire history, including major corrections, it required a max of 9 lots of capital committed using this system. Essentially that means relatively short drawdowns.
BTW, my initial lot entry price was 92.485
Per my usual strategy, I'll add to my position at the close on any day it still rates as a “buy” and I will use FPC (first profitable close) to exit any lot on the day it closes at any profit.
As always - this is intended as "edutainment" and my perspective on what I am or would be doing, not a recommendation for you to buy or sell. Act accordingly and invest at your own risk. DYOR and only make investments that make good financial sense for you in your current situation.

FTNT Consolidation with Earnings on the HorizonThis is another consolidating triangle although I dont really care for how abrasive the price action has been. I prefer the consolidations to be more swoopy and less spikey. That said, this still qualifies. Volume has been largely contained complete.
The last spike to the top line reads as a false breakout to me which does provide some concern. That said, I still like this as an entry provided there are 2 more days of sideways movement with lower than average volume.
The price target is estimated a jump of 25% based on the last 2 pumps of 31% and 28% (average of 3% drop on each push). IF there's an entry and you're a block target exit kinda person, aim for 20%. Stop is under the support line as always. I would choose to give this a bit of a wide birth on the stop to avoid hunters.
A word of caution (or excitement depending on your viewpoint), earnings is about a month away. There is too much uncertainty during the earnings releases for me so I choose to close positions and sit out. I have other strategies for handling earnings.

Trading Journal - LOSSPremature entry, Need to again wait till the end of the day.
Depending upon how the market is, even if market is good, waiting for end of the day buying is so much better than buying early.
This got rejected again at $100 level, this still looks good so putting back into watchlist.
WIll wait for a good close next time.

FTNT: A Captura Security Co to run for 3-6mo, then reverse.Monitor monthly to begin recycling of buy and sell for long-term.
However, is this company a morale company? Are they a b-Corp? No?

Is the Next Cybersecurity Giant Already Hiding in Plain Sight?At a time when most tech companies are navigating turbulent markets, Fortinet's remarkable Q3 performance tells a story that goes beyond mere numbers. With a 13% revenue surge to $1.51 billion and service revenue climbing 19.1% to $1.03 billion, the company isn't just growing – it's redefining what's possible in the cybersecurity landscape. But the real intrigue lies in the phoenix-like resurrection of its firewall business, which has returned to positive growth after several quarters of decline, suggesting a strategic mastery that few companies have achieved in this sector.
The convergence of three critical factors sets the stage for what could be a transformative period in Fortinet's journey. First, the imminent arrival of the largest firewall refresh cycle in the company's history, set to peak in 2026, creates a rare market opportunity. Second, the company's aggressive expansion into generative AI, now spanning seven different products, positions it at the forefront of technological innovation. Third, institutional investors are taking notice, with Los Angeles Capital Management LLC increasing its holdings by an astounding 3,155.6% – a vote of confidence that speaks volumes about the company's prospects.
What makes this narrative particularly compelling is Fortinet's ability to execute on multiple fronts simultaneously. While most companies struggle to maintain growth in their core business while innovating for the future, Fortinet has managed to do both. The company's CFO, Keith Jensen, notes that the upcoming refresh cycle will uniquely impact mid-range firewalls – a departure from historical patterns that typically focused on entry-level products. This strategic positioning, combined with the company's AI-driven innovation and strong financial fundamentals, suggests that Fortinet isn't just participating in the cybersecurity market's evolution – it's actively shaping it.
The question isn't whether Fortinet will continue to grow, but rather how far its influence in the cybersecurity landscape will extend. As cyber threats become increasingly sophisticated and digital transformation accelerates across industries, companies that can successfully blend networking and security while leveraging cutting-edge AI capabilities will likely emerge as the leaders of tomorrow. Fortinet's current trajectory suggests it's not just preparing for this future – it's already there, waiting for the rest of the market to catch up.

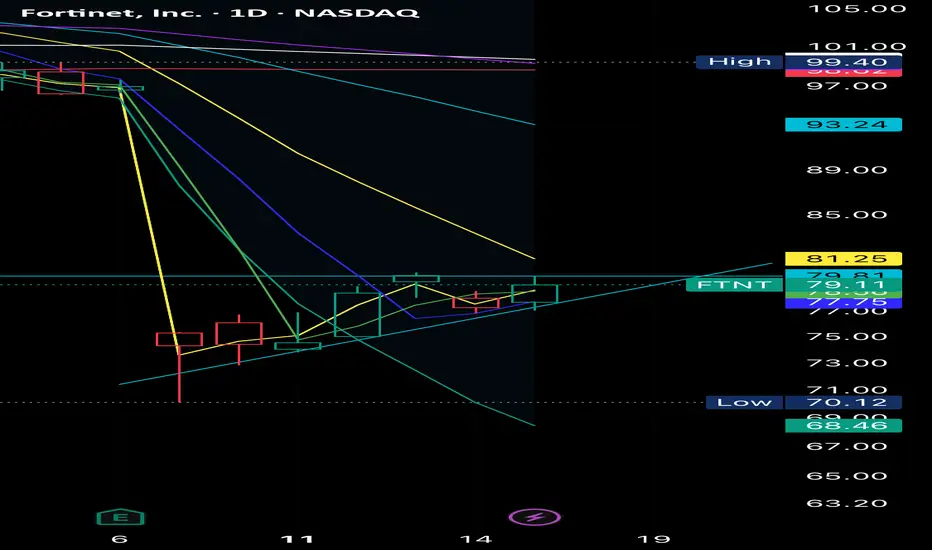
FTNT eyes on $ 77.55: Golden Genesis fib to DIP or to Break?FTNT popped it into a Golden Genesis fib.
This might start a pullback for long entries.
Or we may get a Break-n-Retest entry above.
========================================

FTNT - pullback coming aim to buy at USD60Short-term bearish for the next 2-3 mths as pullback is coming, but long term bullish on FTNT and aim to buy at USD60

FTNT Pulling back with a Nice SetupNASDAQ:FTNT pulling back to confluence of support on top of its previous breakout level and 50 moving average line.
Up down volume and OBV line held up well during this pullback.
Earnings in 2 days to add some spices to the setup.
