Pull Back Fishing Inverse Head and ShouldersThis is one I never thought would fall so far from the bearish rising wedge it traveled in from the bottom, but it fell the entire diameter. Like a symmetrical triangle, the break can be the entire length of the wide end of the wedge. I have found this much of a fall, to be unusual in a strong stock in this market in the past year or so. Possibly, market conditions have not helped NEE. NEE also had a long leg up and eventually, the price is paid as a rule.
Appears to be trading in a butterfly pattern and pulled back to the 1.272 of XA. Hopefully NEE is finished pulling back but I guess we never know. Shocked me for sure that this has pulled back as far as it did and is still struggling. Patterns are formed by market psychology, so folks have obviously been bearish on NEE )o: A rising wedge is caused by too much buying without healthy pull backs, so perhaps there was not enough folks left to pick NEE back up. Dunno. I know folks must tire of my talk about the rising wedge pattern, but they can be devastating.
Earnings 4-27 BMO
Not a recommendation
Inverse head and shoulders patterns do well in a Bull market. Long entry is a break of the neckline and an uptrend. NEE has broken the neckline and experienced a throwback. NEE is now under the neckline again and obviously struggling. Strong stock though.
Trade ideas

Bearish HNS?The Daily SSB /Weekly Kijun is the inflexion level....78 zone. We are clearly rejecting that zone and that adds confluence to the bearish head and shoulders formation i am seeing:
Entry:76.70
SL: 78.42
TP: 72.90
R: 2.21

Bearish HnS?The Daily SSB/Weekly Kijun is the inflexion level....78 zone. We are clearly rejecting that zone and that adds confluence to the bearish head and shoulders formation i am seeing:
Entry:76.70
SL: 78.42
TP: 72.90
R: 2.21


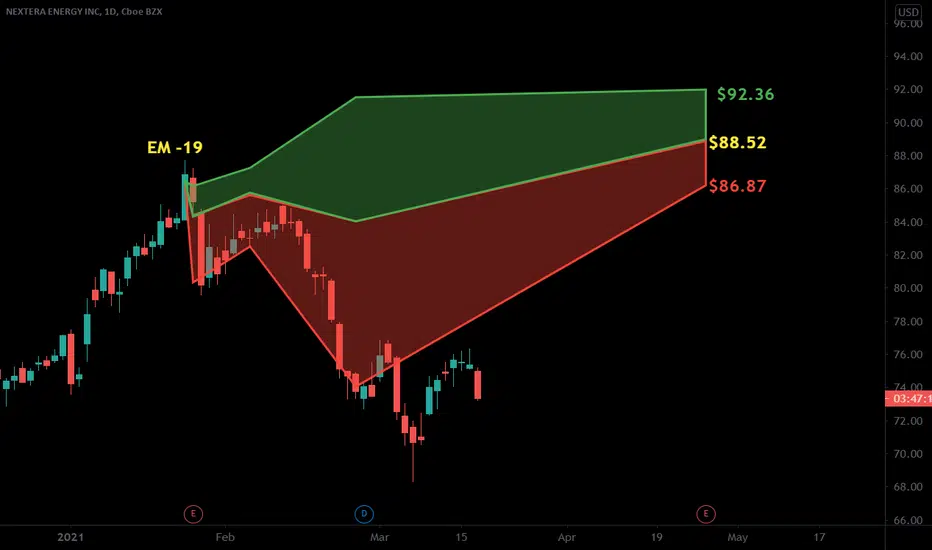
$NEE with a Bullish outlook following its earnings #Stocks The PEAD projected a Bullish outlook for $NEE after a Positive over reaction following its earnings release placing the stock in drift B
If you would like to see the Drift for another stock please message us. Also click on the Like Button if this was useful and follow us or join us.


NEE It looks like NEE is bouncing off a channel and may form a bullish ascending triangle. Time horizon next two months.

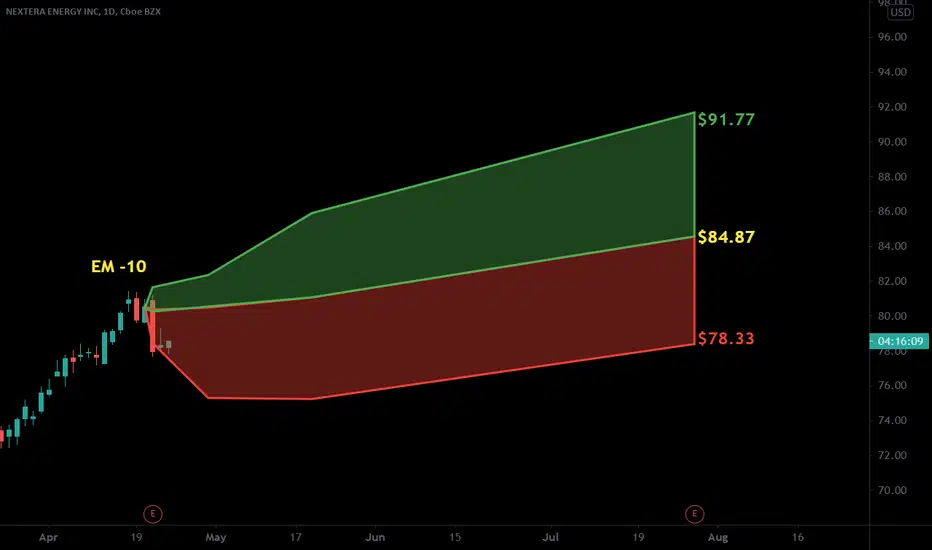
NEE: Breakout Confirmed, 16.65% Potential Profit!Description: NEE is trending higher and in an uptrend meaning that highs are getting higher and lows are getting higher. The uptrend line on the chart and the Trending Band Indicator (which measures trend) supports the Long Position.
Stats:
1. Ideal buy range: $78.3 - $80.6
2. Take profit: $91.92
3. Stop Loss: $176.37
4. Risk To Reward: 1 / 6
5. Accuracy Rating: 96%


$NEE with a Neutral outlook following its earnings #Stocks The PEAD projected a Neutral outlook for $NEE after a negative under reaction following its earnings release placing the stock in Drift D
If you would like to see the Drift for another stock please message us. Also click on the Like Button if this was useful and follow us or join us.
OUCH!The fall from Rising wedge has been excruciating! NEE has invalidated the cup and handle pattern in the process. The wedge won )o:
Rising wedges can fall all the way to a parallel trendline drawn horizontally from the inside wedge trendline (see orange line) I did not think NEE would fall that far or I would have sold all of it verses half of it..lol. But I am hanging in there and waiting to buy my half back (o: Most strong stocks average a 35% fall, but I guess market conditions have not helped NEE.
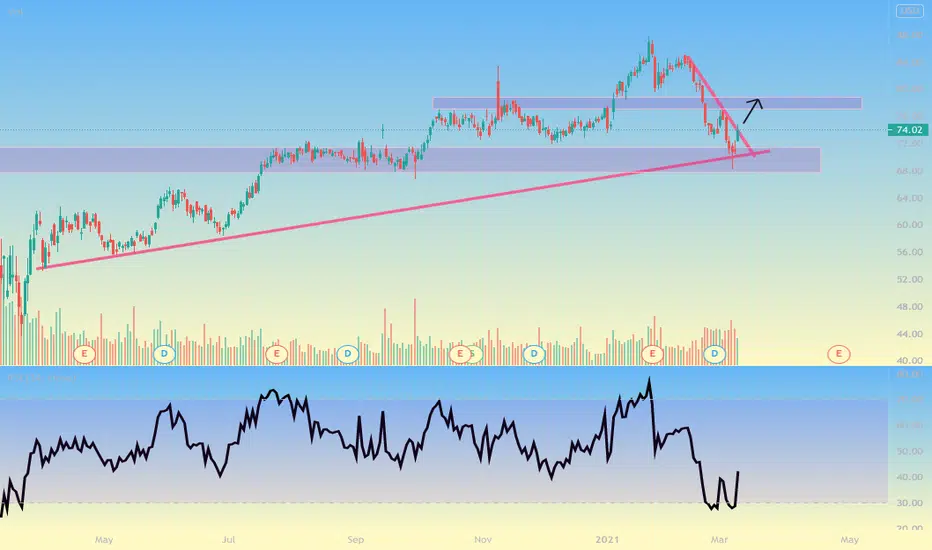
If this stays put and this is truly support...this could be a BAT pattern. If it falls to 2nd blue line, it would then become an alternate bat. And if Mr Market doesnt give NEE a break, it could fall even further. No guarantees, just a possible place to watch for retests and some volatility that usually exists when these land.
The standard Bat pattern is defined by the B point that is less than a 0.618 retracement of the XA leg. This one is 0.5. Typically, this structures employs a 50 percent retracement at the midpoint. There is an alternate bat pattern (wouldn't you know) that could take this to the 1.13 fib level. The bat pattern starts with an impulse wave labeled XA. B is at the 0.5 retracemnt ideally.
Just watching and not a recommendation

NEE 🌦I never use indictors. Why? Alot of them are lagging indicators. I prefer to identify fractals and use them as signals for bull and bear strategies.
***This does not constitute financial advice.***


Renewable Energy Stock NEE is looking juicy for April!!Is yum yum style bound to occur? think for yourself!
Not investment advice 😊

It’s time for NEE to rise!!I think it’s going up. Do your own research on the stock, peep the chart.
Not investment advice.

Yum yum, even perhaps a meow meow style is imminent? medium/longDo research, check out the chart, think for yourself

great chart request from KB24so much support coming into play this ones a no brainer, thank you to KB24 for bringing it to my attention and telling everyone when he entered :D looking for 78-80 this week and ill unload the rest of the calls. New chart added to watchlist!

$NEE safe long, slow and steady renewable utility NEE
Next Era
Recently did a split, so cheaper to get in. 4% yield, great mix of growth and dividend, and is a utility so even if we double dip into recession utilities should stay strong in the years to come.
First target @86

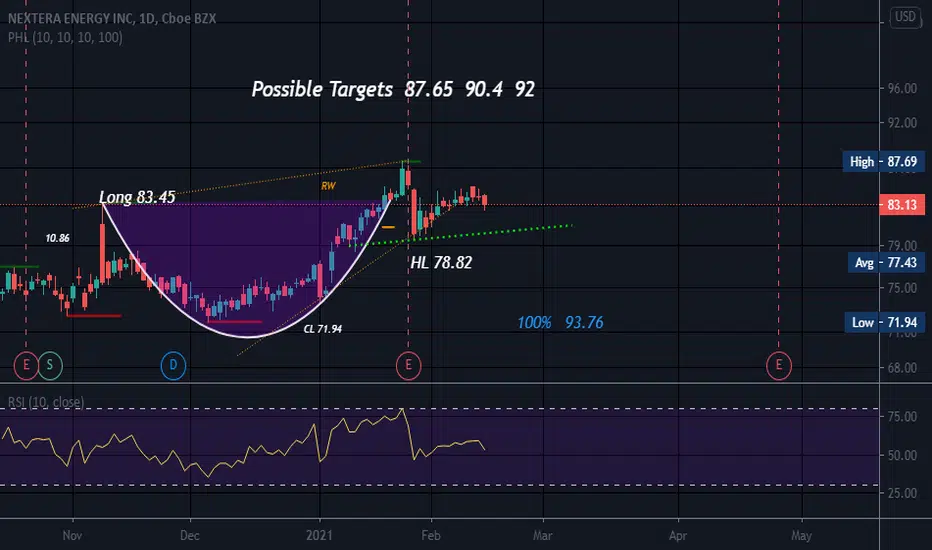
Cup and HandleLong after Fall from Rising wedge complete. This is not a huge rising wedge so fall will possibly be brief as it has dipped out of the bottom trendline. RWs are not valid unless the bottom trendline is broken. This pattern needs at least 3 weeks to form but can be a long term pattern. RWs interrupt supply and demand (there is too much supply) There will be a lack of touches to the bottom trendline. Both trendlines slope up and converge towards each other. Strong stocks do not fall down far as a rule and some stocks actually break up and out of a RW although price usually shows weakness a few weeks afterwards.
Possible stop below handle low or mid cup which is 77.65. Mid cup is close to handle low which also provides support at 78.82. If the handle low goes below mid cup, many consider the pattern invalidated.
The handle low is a horizontal congestion zone (HRZ) but sometimes it is not discernable as others.
Not a recommendation
$NEE - could breakits inside the pennant right now.
Set you alerts, be patient. Wait for the trade to come to you
