GS LongGS testing channel support and previous breakout . oversold conditions where a bounce was imminent. Good area to go long here
Trade ideas

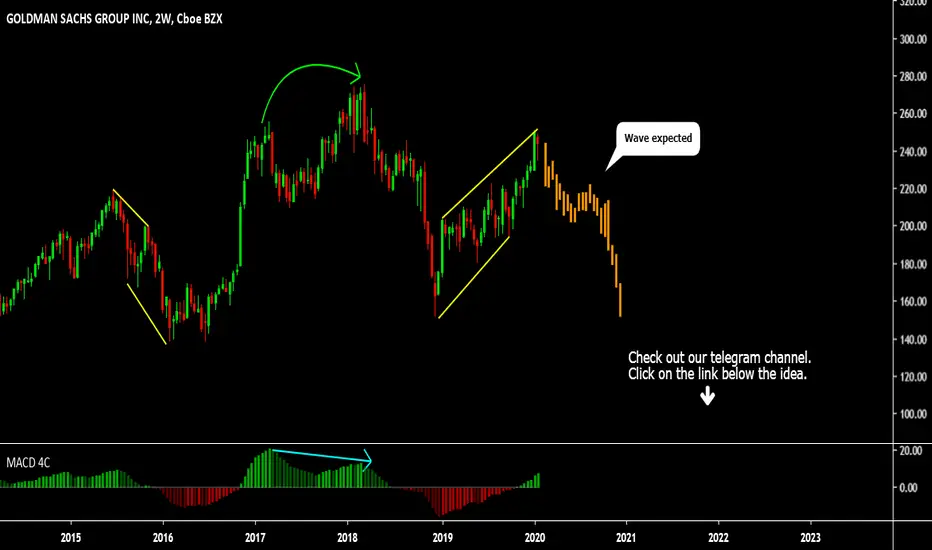
Smaller downswing for GS comingHi Traders
Looking at the daily chart of Goldman Sachs it shows you a possible short time down trend. As Moving Averages still form an upward trend, this analysis
is meant for a shorter time only. Over a longer timeframe it still looks like a long.


My GS prediction 30M TF Hello, this is my prediction for GOLDMAN SACHS. You are currently looking at your strong support, my prediction is your probability that you have a chance to expect price increases that are in line with the volume profile where we are in the second standard exception, so you expect a return to your name. Based on other indicators such as expected volatility, higher TF analysis, or fundamental, your own will enter into a long position.

GS Long PlayGS recently popped above its support / resistance at $235, rising to a high of $250 before beginning consolidation back down to $235-$240 forming a flag / pennant pattern. Furthermore, the RSI has been trending nicely and is indicated another bounce should occur shortly. The touch of the 50 day MA is further confirmation, although GS has dipped below it on a few occasions so it needs a bit of room to play.
I often use the ichimoku cloud on the daily to confirm these types of trends and it does so nicely, showing the price consolidating back to the cloud which is currently large enough to "prevent" a bearish move. While the leading line has crossed the base line, I typically view this as noise when the asset is consolidating above the cloud as it is more common than not. It is, however, something to be aware of, and represents a very small red flag on the play.
I will be looking at the shorter time frames (~15 minutes to time specific entry on this long play, and most likely March 20th 250 Calls

Goldman Sachs on shopping list
In consolidation after a strong 2019.
Moving averages catching up now to provide support.
Financials out of favor but their day will come.

GS Shifting to a Sideways Price PatternResistance thwarted GS price action, causing the stock to retrace. It is now shifting to a sideways price action with common gaps.


GS SELL (GOLDMAN SACHS GROUP INC)Hi there. Price is forming a continuation pattern to the downside. Watch strong price action at the current price for sell.
Goldman Back above trend-line
Despite earnings positive, commentary positive, positive analysts day the price has struggled to move higher.
Despite this the fact that the long-tern trend-line (blue) is now support is very bullish.
A long trade with trend line as support now becoming attractive.

GS movementGS will move down to the resistance level. If it breaks below it will fall to support. If it bounces off it can move to its all-time high. Thanks for supporting my ideas.


GS Goldman Sachs: $245 artificially undervalued towards $1,000new markets new customers when the rich becomes richer and the rise of middle class require more banking needs
Goldman shall dominate this space in the next decade.
That liquidity from the FED and make America great again shall benefit strong hands
Price action wise it's a Parabolic to fresh highs
--
LOADED for the long run
warren may just mark this up to $300 to make a statement
REMINDER: this listed most issues and as underwriter packager
it knows how to surprise the PUBLIC


Goldman running into earnings Having lagged its peers throughout 2019, recent upgrades and optimism coming into earnings on the 14th Jan have sent the stock on a fantastic bull run.
Strong historical price resistance on the horizon so less risk is to trade the break above or indeed wait for earnings to see the stock reaction, it could very well be a sell the news event.

GS to SOARAccording to goldman sachs, their stock is unfairly undervalued. They believe their stock should be trading at $400 per share, which tells me that they're gearing up for some changes. My year end price target is back to all time highs. If it hits, I will hold should accumulation present itself.
Thank you for your likes and your FOLLOW! Let me know if you have any questions or comments. Cheers!

Goldman Sachs running out of steamThey banks have been on a rally in 2019 and although GS still lags behind and has actually broken through some major resistance, they indicators are signalling that a retrace is on the cards.
Moving averages also need to catch up to provide some support.
Pullback could be as low as $209

Goldman Sachs Monthly Income--LongStock is trading in an uptrend on the Weekly chart. I have identified fresh Supply Zones and fresh Demand Zones on the Daily charts.

Goldman short play?looking at GS on the daily seems like we have a bearish div looking to play out pull back on the horizon.
short to 225 this coming week.

Goldman Day trade possibleStock breaking out from well defined channel (flag) with $235 first target

$GS Buy the break above Resistance in Goldman Sachs Entry level $232.61 = Target price $245.04 = Stop loss $228.82
Upgrades galore for Goldman this week.
The OBV and RSI in very strong uptrend.
The stock lags its peers so may attract some catch up money into the end of the year.
The compnay is changing its structure and its cooperation with AAPL is a major boost.


