GS fell 2.42% on Tuesday trades but held on above 196.90GS - Goldman Sachs share prices fell 2.42% on Tuesday trades but managed to hold above 196.90 support level. Share prices have been on a consolidation mode for about two weeks from 204.54 to 195.00 and could continue to retest its previous resistance at 204.54 if it breaks and holds above 200.00 price level. A critical support price level is estimated at around 195.45.
Trade ideas

GSI will take a closer look at MA200 price level and Fibonnachi 38.2.
On top of those RSI will give us a signal where the price can go.
On H4 time frame we can see some possible bullish development in front, and futures are green, at least for now


GS broadening tri, C&H, overextThis is for bullish thesis (in case of more cuts and market reacts positively). Yields ATL, TLT through the roof.
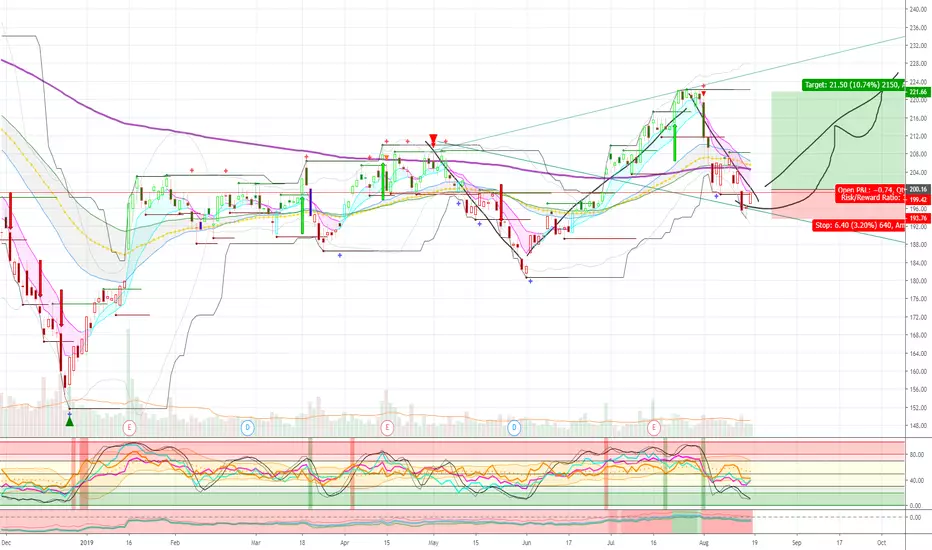


GS is getting ready for a shortNYSE:GS is getting close to a resistance cluster
it's hell of a short!
can you guess why the rectAngle is resistance???
let's see how it plays out :)


GS breakout and bullish structureGS breaks out of a flag, with a gap, and heavy amount of Doji's on the the Heikin Ashi signal that market consolidates on GS. Also, Snap and Micron breakout helped bolster bullish market sentiment for GS. MACD shows consolidation after GS most recent earnings. Heavy consolidation right below 61% fib line and more institutional investors consolidated at 50% shown by the gap to the upside. Not overbought or oversold even after Bollinger band constricted heavily in march. Possibly less volatile for GS ahead after flag breakout. (XLF-orange and KEY-Blue are used for comparison) Bullish structure formed after GS broke out of flag.


GS Long-Term Uptrend; End of 2019 Price Target: $200Goldman Sachs has been harried by the 1MDB scandal as of late. Look for the company's robust business to shake off the short-term concerns over 2019 and regain the old highs. The first green trend line gives us an idea of what the trend COULD have been for GS. The second green line delivers a more accurate picture of what the trading behavior will resemble in the long-run. Right now: be wary of this stock as it could reach 145-150 levels before the stock regains its momentum. After that, it should be clear skies ahead!

July 31,3 entry points. 1. Objective. Goldman Sachs
the interest rate decision will affect the banking sector downward, we expect strong falls and we will develop a bearish inverted priramide strategy.

Goldman Sachs smiling despite troublesThe first impression of the daily chart is quite impressing, looks bullish with gaps up even. But NYSE:GS is on the brink of a reversal. This current intraday turnaround is more or less a confirmation of the one we saw already on 1st of July. Which confirmed the resist in form of the highs we saw in April and May.
GS needs new highs very fast, or we see shorties like me smiling.


GS Stuck in Trading RangeGS continues to struggle to break out to the upside from its trading range, which started after a High Frequency Trader gap up last January. There is Buyback activity as well as Dark Pool Quiet Rotation™, and those Buybacks are holding the stock in this range.

Bullish structureI am waiting for a pullback to complete a very bullish pattern to buy long-term.
At this point R/R is 3x

