$HIMS Earnings MondayLooking at HIMS from a purely technical and chart pattern point of view.. $60-$70 is the next stop.. as this is being posted is already up in overnight hours. Earnings are gamble so this is a lotto play for me
Trade ideas

HIMS QuantSignals V3 Earnings 2025-11-03HIMS QuantSignals V3 Earnings 2025-11-03
HIMS Earnings Signal | 2025-11-03
• Direction: BUY CALLS | Confidence: 70%
• Entry Plan: Pre Earnings Close | Expiry 2025-11-07
• Strike Focus: $42.00
• Entry Range: $4.80
• Target 1: $9.20
• Stop Loss: $2.30
• Implied Move: $6.65 (14.8%)
• 24h Move: -0.56%
• Flow Intel: Neutral | PCR 0.85
• ⚠️ MODERATE RISK WARNING: Consider reducing position size due to moderate confidence level.
• Earnings Date: 2025-11-03 | Estimate: $0.11
⚖️ Compliance: Educational earnings analysis for QS Premium members only. Not financial advice.
🎯 TRADE RECOMMENDATION
Direction: BUY CALLS
Confidence: 70%
Conviction Level: HIGH
🧠 ANALYSIS SUMMARY
Katy AI Signal: NEUTRAL with 50% confidence - Katy shows no clear directional bias but indicates the stock is range-bound at current price levels. The AI prediction itself doesn't provide strong directional guidance, but the composite earnings framework shows BUY CALLS bias with +2.6 score.
Technical Analysis: Stock trading at $44.88 with bearish momentum indicators (RSI: 36.9 neutral, MACD: -1.4792 bearish, ROC: -12.79% strongly bearish). Recent range $44.06-$47.20 suggests immediate resistance near $47. Volume running 1.2x average indicates increased interest pre-earnings. EMA alignment remains bearish, but oversold conditions could support bounce.
News Sentiment: High earnings impact news with multiple publications highlighting HIMS earnings today. Stock is "in focus" according to market summaries. Positive attention from major financial outlets suggests heightened interest and potential for positive surprise reaction given strong beat history.
Options Flow: Neutral put/call ratio (0.85) indicates balanced positioning. Unusual activity at $38 put suggests some protective hedging, but overall flow doesn't show strong institutional bearish bias. Implied move of 14.8% ($6.65) reflects high volatility expectations.
Risk Level: MODERATE-HIGH due to Kat
Image
QS Analyst
APP
— 11:00 AM
y's neutral signal conflicting with bullish composite score. Earnings volatility and high IV (183%) require careful position sizing.
💰 TRADE SETUP
Expiry Date: 2025-11-07 (4 days)
Recommended Strike: $42.00
Entry Price: $4.60 - $5.00
Target 1: $9.20 (100% gain from entry)
Target 2: $12.00 (150% gain from entry)
Stop Loss: $2.30 (50% loss from entry)
Position Size: 3% of portfolio
⚡ COMPETITIVE EDGE
Why This Trade: Despite Katy's neutral signal, the strong fundamental case (592% revenue growth, 100% beat rate, 186% average surprise) combined with oversold technicals creates asymmetric opportunity. The $42 strike provides balanced risk-reward with 0.67 delta.
Timing Advantage: Earnings release today with implied 14.8% move. Current bearish momentum may have oversold the stock, setting up for potential reversal on positive earnings surprise.
Risk Mitigation: Using balanced delta strike (0.67) reduces gamma risk. Position size limited to 3% due to Katy's neutral confidence. Stop loss at 50% protects against earnings disappointment.
🚨 IMPORTANT NOTES
Katy AI shows 50% neutral confidence - this trade relies more on composite bullish factors than pure AI prediction
High IV (183%) means rapid time decay - exit quickly post-earnings
Monitor earnings release for immediate directional confirmation
MACD and ROC remain bearish - watch for technical confirmation of reversal
📊 TRADE DETAILS 📊
🎯 Instrument: HIMS
🔀 Direction: CALL (LONG)
🎯 Strike: 42.00
💵 Entry Price: 4.80
🎯 Profit Target: 9.20
🛑 Stop Loss: 2.30
📅 Expiry: 2025-11-07
📏 Size: 3.0
📈 Confidence: 70%
⏰ Entry Timing: N/A
🕒 Signal Time: 2025-11-03 14:00:37 EST
⚠️ MODERATE RISK WARNING: Consider reducing position size due to moderate confidence level.

HIMS to $76HIMS is incredibly profitable and also a highly shorted stock (33%). It might tap support here, but if not just below the trend line seems like a nice entry.
Good luck!

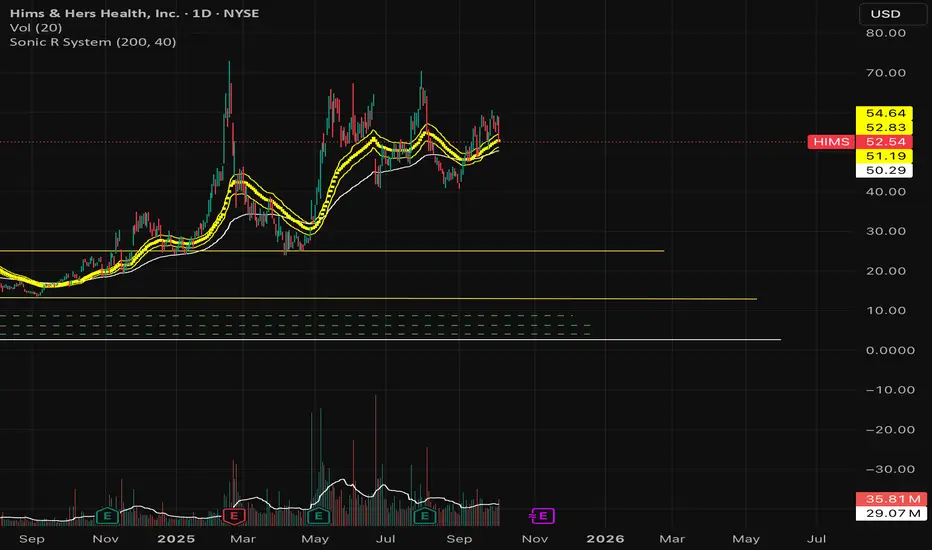
HIMS rebounding from 200-day SMA to $60 by end of Nov?HIMS is having a mean reversion back to the 200-day SMA (red line). Last 3 times it touched it, it rebounded at least 30% the month after.
It might take a week or two to form the short term bottom. The blue MACD line seems to be flattening out. Last few times it happens, stock rebounded.
When the blue MACD line flattens out and then crosses upward through the red Signal line, it signals that downward momentum is weakening and bullish momentum may be starting.
This is a Bullish Crossover → buy signal.

HIMS - make or break?HIMS is at a make or break point, but the company has enough cash to buy back shares at these levels. While earnings may be a dud....if they purchased back shares and raise their forecasts then we may have a player.
HIMS Long IdeaHIMS Long idea. Successfully backtesting the 200d SMA in the long-term, well-established uptrend here on the daily time frame. Let's see what happens. Kangs.

HIMS put saleTHIS HAS BEEN such a fun stock to trade. BIG DOWN DAY. This put sale is before earnings. AMAZING premiums. Puts the cost basis at $44.
GORGEOUS

Hims could suprise to the downsideThe Hims chart looks weak to me. I would be interested in buying if it got to the $35 level. I de-risked further on my position (it's basically free shares at this point). I hope i am wrong, as i don't like when people lose $.
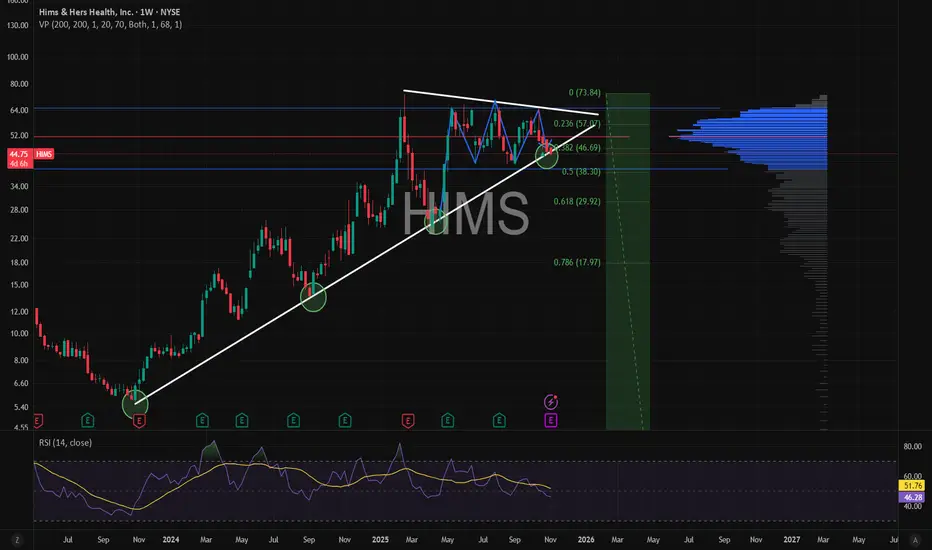
HIMS, confirmed reversalReversal confirmed by double bottom and trend. Also MACD almost positive. First target 59 at Fib 0,618 and after retracement to volume support , expecting ATH as a resistance at 72-75. * Not for a trading advice *
$HIMS - Heading to support! The positive reaction in after-hours trading was driven by HIMS's impressive earnings, with revenues nearing the $600 million mark. From a technical analysis perspective, all eyes are now on the 200-day Moving Average. The critical test will be whether the stock can successfully break through and reclaim this level from below. If it succeeds, the price would re-enter its former trading range, creating a promising setup for a future upward breakout.
On the downside, a failure to overcome the 200-day MA could lead to a pullback. The most likely target in that scenario would be the $37.45 level, which aligns with the 0.618 Fibonacci retracement and has proven to be a reliable support zone in the past.
My investment stance remains firmly long-term. The company's solid fundamentals, underscored by newly announced growth initiatives and a strategic global expansion into markets like Europe, Brazil, and Australia, provide strong conviction to hold through near-term price fluctuations. KalaGhazii
Support and Resistance -
Support - $37.50 - $40.00
Resistance - $60 - $65

Put sale on HIMS over earningsI like HIMS and OSCR A LOT in this market and environment right now.
:)
So, getting HIMS at $38 seems like a gift. JUST closed .80 gain on a put sale. So cost basis would be a tad lower than $37 if I get put shares...

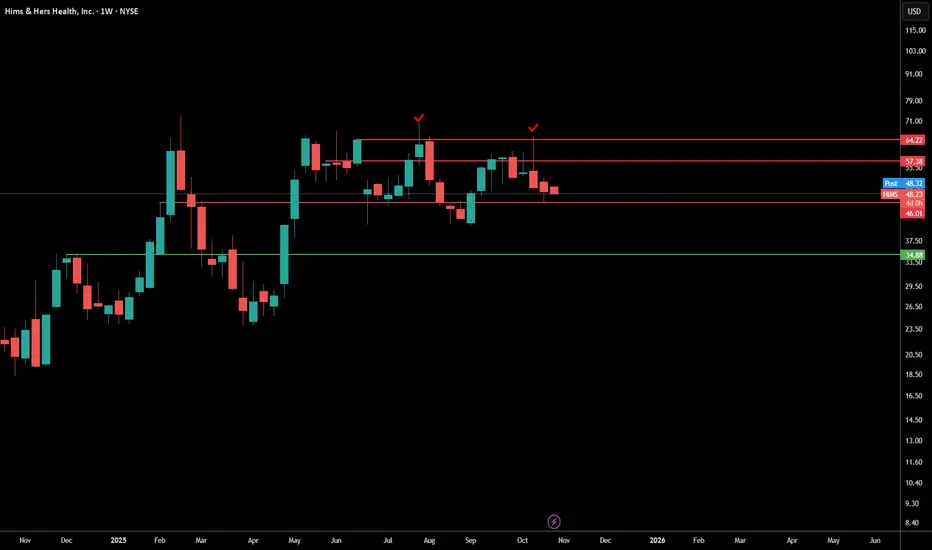
HIMS - Stay above $46?Uptrend line: The long-term weekly trendline from mid-2023 is intact, but the price is sitting right on it now. A weekly close below ~$46 would technically break that trend.
Volume profile: Most of the volume sits in the $44–$48 range — this zone is key support. If it holds, you can expect a bounce; if it fails, the next strong node is around $38–$40.
RSI: Neutral at ~48 — not oversold, not overbought. Momentum could swing either direction.
Resistance: Heavy around $52–$54 (the red line you drew). That’s where it’s been rejected multiple times.
In short:
Stay above $46 → trend continues, bounce potential.
Lose $46 → likely drop to mid-$40s or even $40 before finding footing.
Break $54 → confirmation of next leg higher toward $60+.

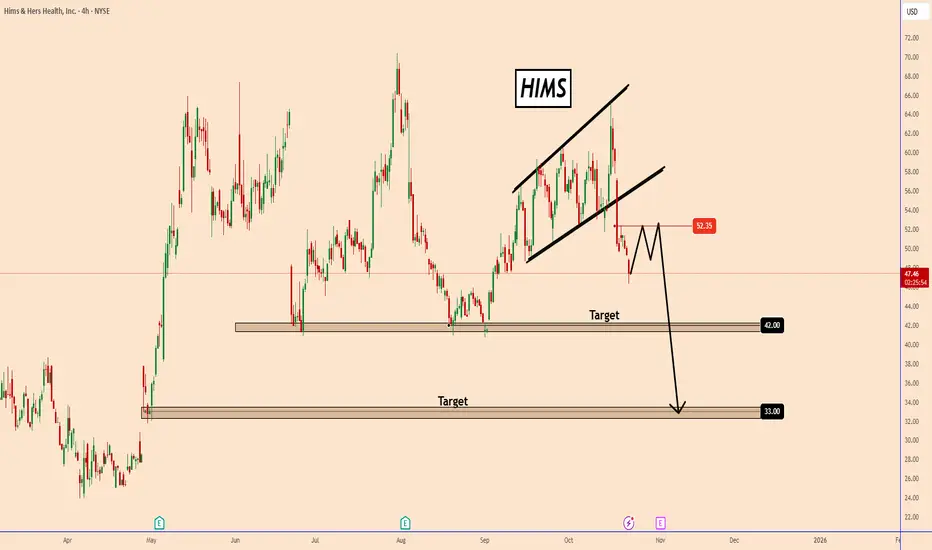
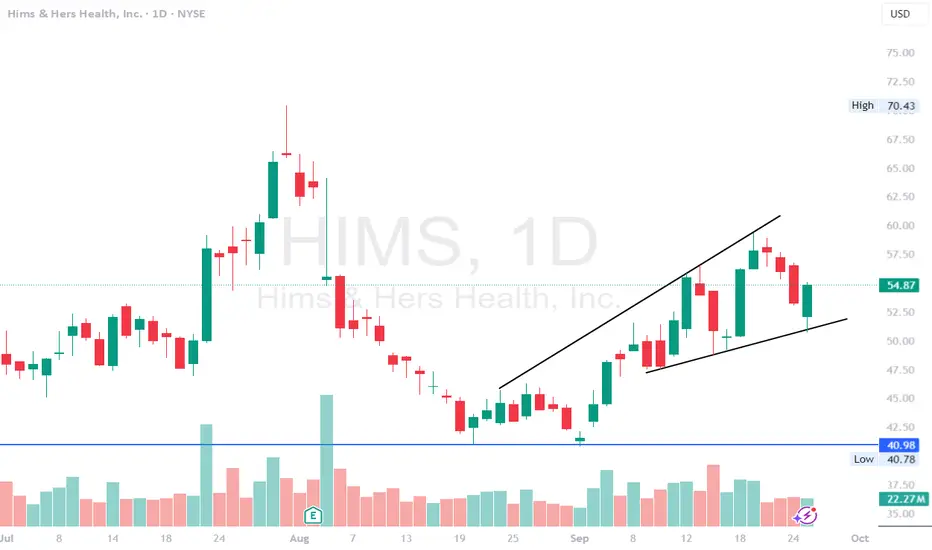
HIMS: Showing Signs of Exhaustion: Downside Targets at 42 and 33HIMS: Showing Signs of Exhaustion: Downside Targets at 42 and 33
HIMS appears to be forming a rising wedge pattern, a typically bearish formation that often signals exhaustion of upward momentum.
After several failed attempts to break higher, the price has now started to pull back, suggesting that sellers are regaining control.
A possible correction near to 52.30 can happen before it moves down further
HIMS could continue falling toward its first target at 42.00
A deeper correction could then extend toward the second target around 33.00, completing the bearish move.
You may find more details in the chart!
Thank you and Good Luck!
❤️PS: Please support with a like or comment if you find this analysis useful for your trading day❤️
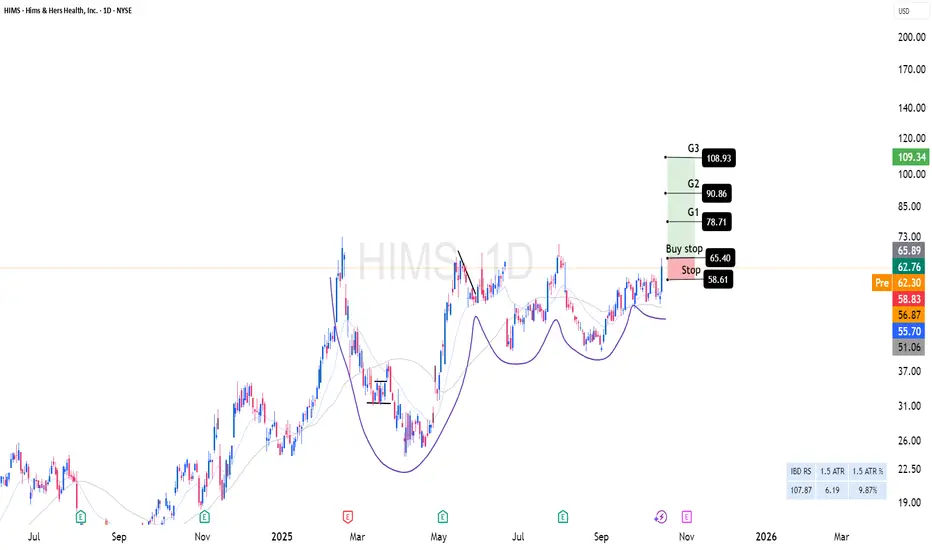
HIMS LongReasoning:
Virtual Contraction Pattern!
Remember: Every long-term investment alert can also be played as a swing trade.
Long-Term Investors (3-12 Month Holds)
Entry: Full position on breakout
Profit Taking: Sell 1/4 to 1/5 at Goal 1
Exit Signal: Close below 20-day EMA (your trend guide) or 50EMA
Why: Strong moves are hard to time at the top, but the 20EMA acts as a reliable trend filter
Swing Traders (2-6 Week Holds)
Entry: Full position on breakout
Profit Taking: Sell 1/3 at Goal 1
Final Exit: Remainder at Goal 2
HIMS OCT 2025HIMS — Price is holding above the 50–45 support and the rising trendline after repeated mid-range rejections. Supply/distribution remains inside the upper box (gap overhead). Bids show absorption in 50–45; 40 is the last institutional support before the weekly base at 25–20.
• Target up: 58–60 (gap fill), stretch 65–70 under major supply.
• Target down: 50 → 45 → 40; loss of 40 opens 25–20 weekly support.
#HIMS #globaltrade #investment #investing #stockmarket #wealth #realestate #markets #economy #finance #money #forex #trading #price #business #currency #blockchain #crypto #cryptocurrency #airdrop #btc #ethereum #ico #altcoin #cryptonews #Bitcoin #ipo

HIMS THROUGH LABOR DAYThis is my speculative technical analysis of what I believe could unravel with $HIMS.
$45.00 has been crossed twice, and I believe this is where the line on the sand is drawn. A Strong close above this mark and we could see $47.40, $48.94, and then a gap fill to $50.00 which is a big psychological level.
An area where I would expect some price consolidation before picking direction once again.

Will Hims & Hers Health Sustain Its Bullish Growth Trajectory?Current Price: $52.54
Direction: LONG
Targets:
- T1 = $55.20
- T2 = $58.50
Stop Levels:
- S1 = $50.50
- S2 = $49.00
**Wisdom of Professional Traders:**
This analysis synthesizes insights from thousands of professional traders and market experts, leveraging collective intelligence to identify high-probability trade setups. The wisdom of crowds principle suggests that aggregated market perspectives from seasoned professionals often outperform individual forecasts. Traders have identified Hims & Hers Health as a high-growth opportunity, emphasizing consistent quarterly performance and strong retail demand for healthcare solutions in a rapidly evolving industry.
**Key Insights:**
Hims & Hers Health has emerged as a leader in the telehealth market, benefiting from consumer-focused strategies and robust product offerings. Analysts widely credit the company’s success to its ability to address gaps in traditional healthcare with affordable, convenient solutions. Its subscription-based model is seen as sticky, driving recurring revenues that appeal to institutional investors.
The company has aggressively expanded its operations in 2025, tapping into new markets and broadening its product range while maintaining tight cost controls. Key metrics, such as its subscriber growth rate and gross margin improvements, indicate that Hims & Hers is not just growing its top-line revenue but also achieving greater operational efficiency. With the healthcare demands of Gen Z and millennials surging, the company is positioned to capitalize on strong secular trends.
**Recent Performance:**
Hims & Hers Health has shown resilience in recent quarters, beating Wall Street estimates in Q2 2025 with 28% year-over-year revenue growth and record-breaking net subscriber additions. The stock’s current price reflects a healthy consolidation after rallying from $45 earlier this year. Despite broader market volatility, HIMS has stayed firmly bullish due to its strong fundamentals and sector tailwinds.
**Expert Analysis:**
Experienced market professionals emphasize Hims & Hers Health’s innovative approach in an increasingly competitive telehealth space. Technical analysis highlights the stock’s bullish breakout above the $50 level, which has now turned into strong support. The RSI, currently at 61, indicates room for further upside without overextended momentum. Moving averages are trending upwards, reflecting bullish sentiment, while trading volumes remain elevated, confirming institutional interest in the equity.
Experts also point to management’s proactive initiatives, such as international expansion and partnerships with key retailers, as catalysts for sustained growth. Hims & Hers' ability to balance aggressive growth strategies without compromising profitability has made it a standout performer. Traders are closely watching its upcoming Q3 earnings report as the next potential inflection point for price momentum.
**News Impact:**
Recent news regarding Hims & Hers Health’s partnership with leading pharmacy chains has added additional credibility to its retail strategy, widening its consumer base and boosting investor confidence. Furthermore, analysts highlight its successful entry into remote mental health services, which is projected to drive incremental revenue for the upcoming quarters. Positive media coverage on its competitive edge in subscription programs has reinforced the stock’s image as a high-growth play.
**Trading Recommendation:**
With strong fundamentals, sector leadership, and bullish technical indicators, traders should consider going long on HIMS. The stock’s recent movements suggest a clear upward trajectory, supported by robust demand for its products and services. Buy positions should be initiated with a stop-loss at $50.50 (S1) to manage risks effectively, while targeting $55.20 (T1) and $58.50 (T2) for potential upside gains. Upcoming earnings and operational updates may further fuel investor sentiment and drive momentum into 2025.
Do you want to save hours every week? Register for the free weekly update in your language!

$HIMS growth slowdown ahead- NYSE:HIMS is quite overvalued. There's no moat to a business model.
- They got a good branding that's all. There are 10-15 other startups selling the same things under different umbrella.
- They even stole NYSE:NVO flagship weight loss drugs. These cheap alternatives will risk lives of people and will open plethora of lawsuits.
- Growth is slowing down to low 20s which calls for correction in the multiple.
- Anyone paying more than 20x will likely suffer from massive losses within an year timeframe.
- Fundamentally,
Year | 2025 | 2026 | 2027 | 2028
EPS | 0.57 | 0.79 | 1.05 | 1.40
EPS% | 5.76% | 38.31% | 32.59% | 33.25%
Giving benefit of doubt and being generous, 30x multiple as a base case. Fair stock value:
Year | 2025 | 2026 | 2027 | 2028
Price | $17 | $23 | $31 | $42
- We should visit the $23-26 range somewhere in 2026
HIMS - distribution at play?Controversial idea, I know. But this really looks like a distribution at play here, and its nearing its end. HIMS is showing very ugly PA anyway, so this stock to me is kind of a toss of the coin anyway.
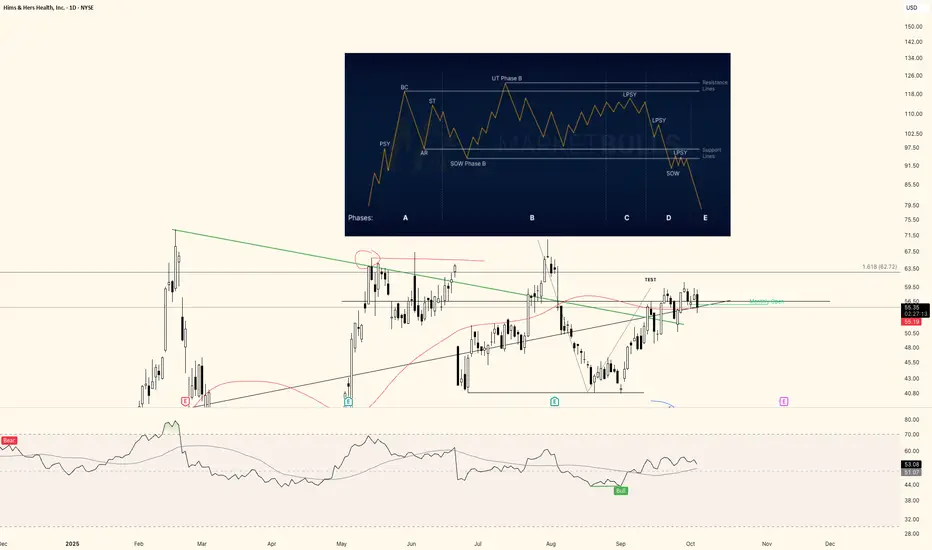
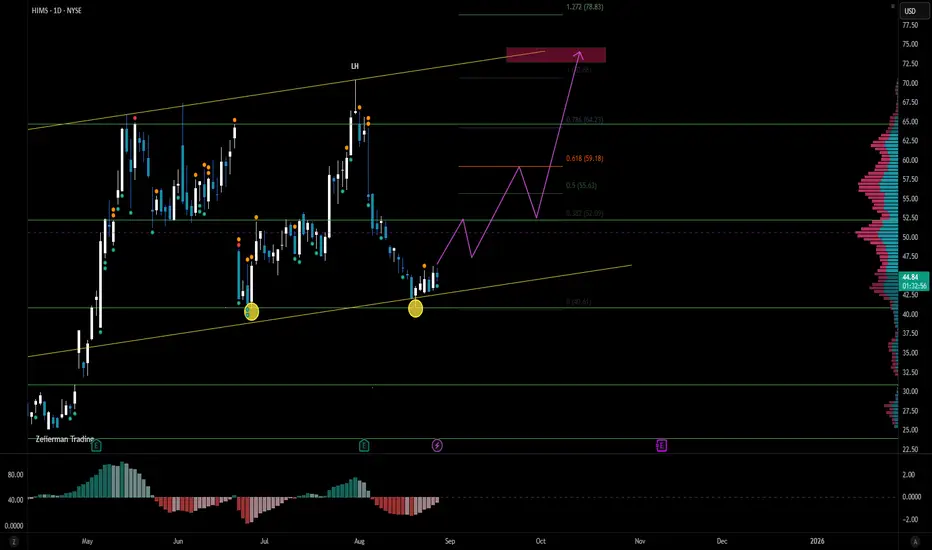
HIMS 1D: time to heal the trend?On the daily chart, Hims & Hers Health is testing a descending trendline, while MA50 and MA200 provide strong support from below. Buyers are clearly in control. The highlighted buy zone sits around $54.40, but the real signal comes only after a confirmed breakout and retest of the trendline.
Technically , the targets are set: first stop at $73.23, then $86.64, and if momentum holds, the extension points to $103.69. That would mark a strong continuation of the bullish move.
From the fundamental side, the company keeps expanding its product portfolio and growing its presence in telehealth — a sector known for resilience even during market turbulence.
The tactical play: wait for the breakout and retest, then ride the bullish wave.
Just don’t confuse HIMS with a real doctor - if you ask for a prescription for profits, all you’ll get is a smile.

HIMS - channel support bounce hereHIMS - Stock back up after hitting channel support. Possibly breaking move towards top of the channel at $65. calls above $55 looking good here. on high watch
HIMS higher RR Hello,
Technical prespective only:
Equal Low of the Bullish Breaker, as long it holds the channel is valid and we could see higher prices towards the algotargets (red), if the price dips then i'll be adding more to the bag.
NFA

$HIMS weekend analysis - 21st September, 2025Last week’s news-driven dip to the 48–49 range turned into a solid buying opportunity - the quick recovery shows it was more noise than substance. With the strong bounce, price looks set to retest the key 62.3 - 64.9 resistance zone, which could be the target for this week.
If we get a daily close above that zone and it flips into support, there’s a real shot at new 52-week highs in the short term. On the downside, a close below 50.4 (volume shelf) would break this setup and call for a re-check.
