IBM | HTFIf the price cannot break above the upper boundary of the uptrend channel, it could retrace to lower levels. Any area below the PMO / Quarterly Open (QO) can be a buying opportunity for this stock.
International Business Machines Corporation
No trades
Trade ideas

IBM Accelerates the Quantum RaceIBM Accelerates the Quantum Race: Technological Revolution or Premature Promise?
By Ion Jauregui – Analyst at ActivTrades
IBM is once again at the center of the technology debate after unveiling two breakthroughs that could redefine the future of quantum computing. Its new experimental chip “Loon” and the “Nighthawk” processor reveal an ambitious roadmap: achieving useful quantum computers by 2026 and fault-tolerant systems before 2029. If successful, this endeavor could transform fields ranging from artificial intelligence to cybersecurity.
The Loon processor integrates error-correction algorithms inspired by mobile technology, an unusual approach aimed at addressing one of the main challenges in quantum computing: the fragility of qubits. However, building it is far from trivial. It requires more qubits and an increasing number of quantum connections, significantly raising manufacturing complexity.
At the same time, IBM introduced Nighthawk, a chip designed to run more complex quantum circuits, which, according to the company, could outperform classical computers in specific tasks by 2026. This technological duo positions IBM in a race alongside giants like Google and specialized startups that are already attracting billions in funding.
Fundamental: A Business Reinventing Itself, But Not Without Challenges
Beyond the media impact, IBM continues to consolidate its transition toward a software-, AI-, and hybrid-cloud-focused model, areas that provide higher margins. Its more traditional divisions—such as infrastructure—continue to pressure growth, forcing the company to rely on emerging segments and disruptive technology to support its narrative.
Quantum progress today is a driver of expectations, but it does not yet generate direct profits. Mass commercialization will take time, and competition does not stand still. Nevertheless, IBM maintains solid cash flow and an investment strategy aimed at capturing technological advantage in the coming years.
Technical: Key Levels and Mixed Signals
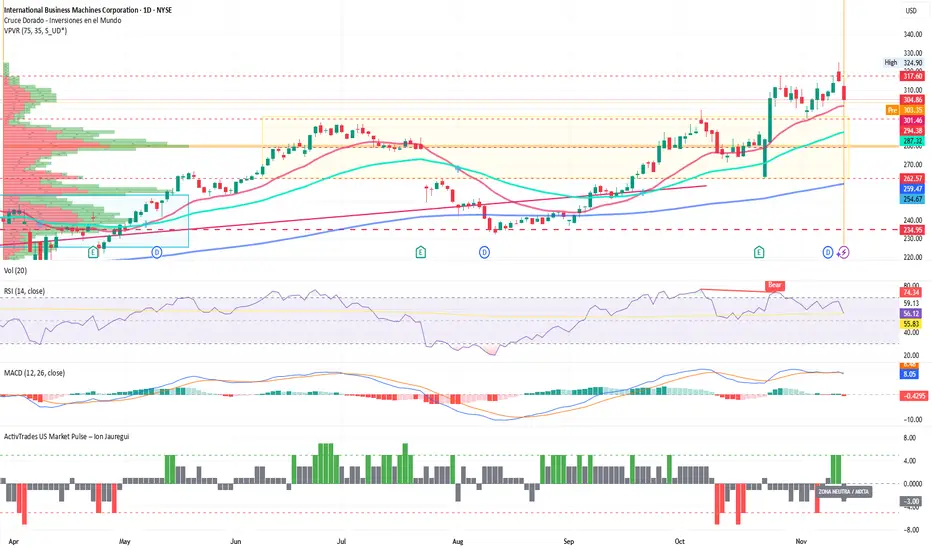
From a technical perspective, IBM shares display a constructive structure. The price is holding above the support that acted as an impulse zone during the last clear bullish movement. The range $262.57–$301.46 was breached, and its upper boundary now serves as a new floor for the current accumulation zone after reaching historical highs of $324.90 on Wednesday, November 12.
Currently, the RSI sits at 56.12%, and the MACD entering a negative histogram seems to indicate a consolidation phase. This construction zone needs to be solidified before moving toward $330. The previous impulse marks a Point of Control (POC) at $281.84 within the prior range, while the bell-shaped formation appears to be creating a third formation centered around yesterday’s price of approximately $305, serving as the current midpoint, relatively close to yesterday’s close.
A bearish scenario could push the price back toward the mid-range of the prior trading range. Finally, the ActivTrades US Market Pulse indicates neutrality leaning toward RISK OFF, suggesting that this general market correction could trigger increased pre-holiday institutional liquidation flows.
Raising the Bar on Expectations
IBM combines tradition and innovation at a critical moment: its quantum announcements reinforce a narrative of technological leadership while raising the bar of expectations. If Nighthawk and Loon meet the announced timelines, IBM could position itself at the forefront of the next computing revolution. Until then, the market will continue observing a stock with potential, albeit still dependent on execution and the internal transition of its core business.
*******************************************************************************************
The information provided does not constitute investment research. The material has not been prepared in accordance with the legal requirements designed to promote the independence of investment research and such should be considered a marketing communication.
All information has been prepared by ActivTrades ("AT"). The information does not contain a record of AT's prices, or an offer of or solicitation for a transaction in any financial instrument. No representation or warranty is given as to the accuracy or completeness of this information.
Any material provided does not have regard to the specific investment objective and financial situation of any person who may receive it. Past performance and forecasting are not a synonym of a reliable indicator of future performance. AT provides an execution-only service. Consequently, any person acting on the information provided does so at their own risk. Political risk is unpredictable. Central bank actions can vary. Platform tools do not guarantee success.
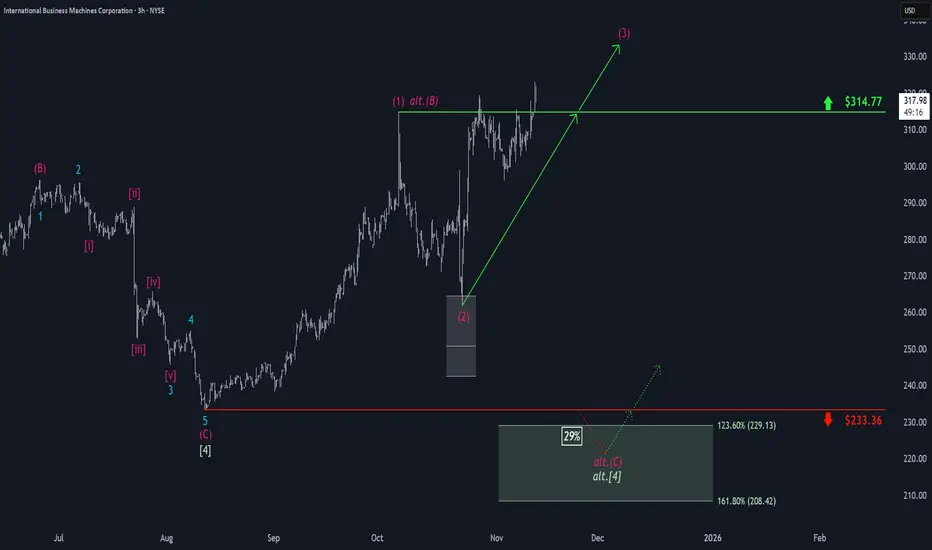
IBM: Breaking Out Above Key ResistanceIBM shares have been contending with stubborn resistance at $314.77 for the past two weeks. After an initial breakout attempt was firmly rejected, the stock has made three more efforts to decisively clear this level—and today, it once again surged purposefully above that mark. In the near term, we expect the high of magenta wave (3) to be established. If the alternative scenario plays out, however, a pullback into our green alternative Target Zone between $229.13 and $208.42 will be likely (probability: 29%).
IBM facing divergence entering the highs of channel IBM is reaching a crucial point in it's channel. I am on the side of the buying pressure is becoming weak and we will be retesting the 300s

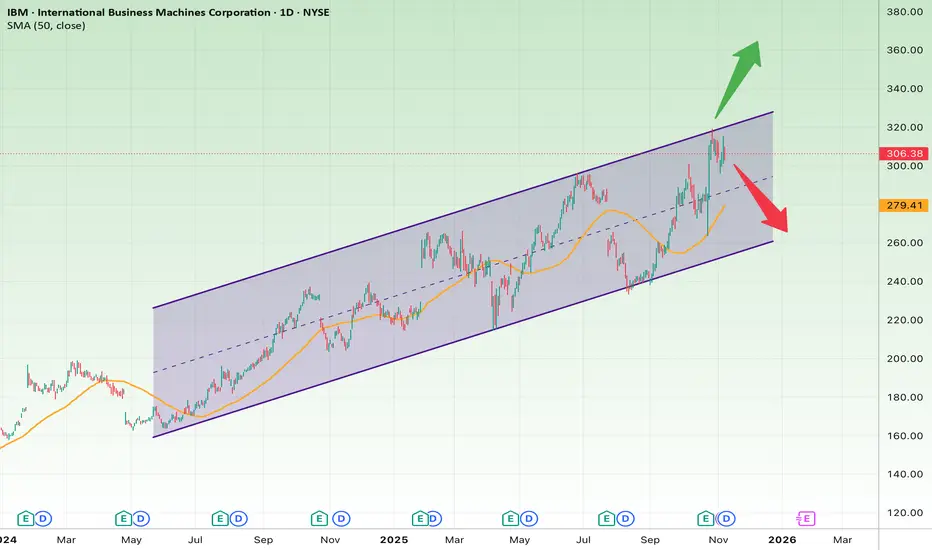
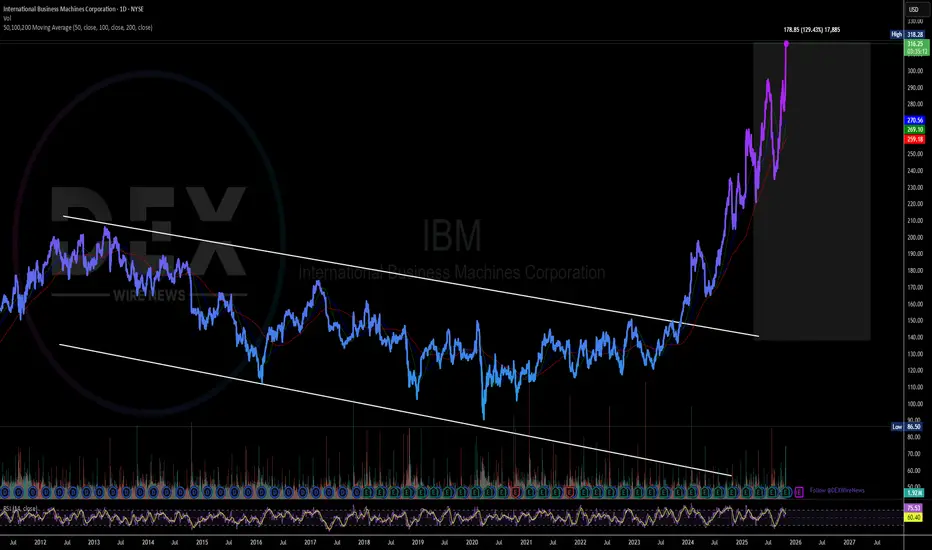
IBM On the Edge of a Major MoveThe daily chart of IBM shows a well-defined ascending channel that has been intact since around April 2024. The price is now testing the upper boundary of the channel, a crucial decision point that could lead either to a breakout continuation or a pullback toward support.
Short-Term Outlook (2–6 Weeks)
IBM is currently hovering around the 305–310 USD resistance zone, right near the top of its rising channel.
The 50-day SMA (~259 USD) is acting as dynamic support.
If price breaks above 310 USD with strong volume, a momentum rally could push toward 330–340 USD.
Bullish Scenario (short-term):
Entry: After a confirmed breakout above 310 USD
Target: 330 → 340 USD
Stop Loss: Below 295 USD
Bearish Scenario (short-term):
If IBM fails to break 310 and drops below 295, a correction toward the midline or the 50-day SMA is likely.
Target: 270 USD
Stop Loss: Above 310 USD
Long-Term Outlook (3–9 Months)
The broader trend remains bullish as long as the price stays within the ascending channel.
The channel floor around 250 USD is a key long-term support level.
If IBM successfully breaks and holds above the channel resistance (~310 USD), the next wave could extend toward 350–370 USD.
However, a breakdown below 250 USD would invalidate the bullish structure and may trigger a deeper retracement toward 220 USD.
Bullish Scenario (long-term):
Target: 350 → 370 USD
Stop Loss: 250 USD
Bearish Scenario (long-term):
Target: 220 USD
Stop Loss: 290 USD
Summary
IBM is at a critical turning point near the top of its long-term uptrend channel.
A breakout above 310 USD could ignite a strong rally toward 340–370 USD,
while failure to break resistance could lead to a short-term pullback to 270–250 USD.
Is IBM Building an Unbreakable Cryptographic Empire?IBM has positioned itself at the strategic intersection of quantum computing and national security, leveraging its dominance in post-quantum cryptography to create a compelling investment thesis. The company led the development of two of the three NIST-standardized post-quantum cryptographic algorithms (ML-KEM and ML-DSA), effectively becoming the architect of global quantum-resistant security. With government mandates like NSM-10 requiring federal systems to migrate by the early 2030s, and the looming threat of "harvest now, decrypt later" attacks, IBM has transformed geopolitical urgency into a guaranteed, high-margin revenue stream. The company's quantum division has already generated nearly $1 billion in cumulative revenue since 2017—more than tenfold that of specialized quantum startups—demonstrating that quantum is a profitable business segment today, not merely an R&D cost center.
IBM's intellectual property moat further reinforces its competitive advantage. The company holds over 2,500 quantum-related patents globally, substantially outpacing Google's approximately 1,500, and secured 191 quantum patents in 2024 alone. This IP dominance ensures future licensing revenue as competitors inevitably require access to foundational quantum technologies. On the hardware front, IBM maintains an aggressive roadmap with clear milestones: the 1,121-qubit Condor processor demonstrated manufacturing scale in 2023, while researchers recently achieved a breakthrough by entangling 120 qubits in a stable "cat state." The company targets deployment of Starling, a fault-tolerant system capable of running 100 million quantum gates on 200 logical qubits, by 2029.
Financial performance validates IBM's strategic pivot. Q3 2025 results showed revenue of $16.33 billion (up 7% year-over-year) with EPS of $2.65, beating forecasts, while adjusted EBITDA margins expanded by 290 basis points. The company generated a record $7.2 billion in year-to-date free cash flow, confirming its successful transition toward high-margin software and consulting services. The strategic partnership with AMD to develop quantum-centric supercomputing architectures further positions IBM to deliver integrated solutions at exascale for government and defense clients. Analysts project IBM's forward P/E ratio may converge with peers like Nvidia and Microsoft by 2026, implying potential share price appreciation to $338-$362, representing a unique dual thesis of proven profitability today combined with validated high-growth quantum optionality tomorrow.
IBM Bullish: Flag Breakout Toward 335–345IBM on the 1D chart has reversed higher since mid-August, sprinted to a new high at $319.35, and is now digesting in a classic bull-flag. Price is hovering near $312.57, with the flag’s upper boundary around $315 and a well-defined demand zone turned support at $299.50. Trend structure remains constructive (price above key MAs), but momentum has cooled during consolidation—exactly what you want to see if a continuation is coming.
Primary path: a daily close above $319.50 with expanding volume would confirm the flag and open room toward $335 first, with a stretch objective near $345. For traders preferring pullbacks, an orderly dip into $299.50–$305 that holds bid would keep the pattern intact and can set the stage for another test of $319.35.
Alternative: failure to hold $299.50 on a sustained daily close invalidates the immediate bullish read and shifts risk toward $305 initially, then $295 and even $285 if sellers press the breakdown. Invalidation for the upside thesis sits cleanly below $299.50; the setup improves materially only on a break-and-hold back above $315–$319.35.
This is a study, not financial advice. Manage risk and invalidations.

International Business Machines (IBM) Gearing for Breakout Ever since breaking out of a falling wedge on November 2023, International Business Machines (IBM) spike 130% breaking highs after highs.
In recent news, IBM plans to launch a platform that will enable financial institutions, governments and corporations to manage digital assets across various blockchains while meeting their compliance obligations.
The IBM Digital Asset Haven is being developed in collaboration with Dfns, a digital wallet infrastructure provider that has created 15 million wallets for 250 clients, the companies said in a Monday (Oct. 27) press release.
About IBM
International Business Machines Corporation, together with its subsidiaries, provides integrated solutions and services in the Americas, Europe, the Middle East, Africa, and the Asia Pacific. It operates through Software, Consulting, Infrastructure, and Financing segments. The Software segment offers hybrid cloud and AI platforms that allows clients to realize their digital and AI transformations across the applications, data, and environments in which they operate.
IBM Analysis – 28 October 2025
- IBM broke resistance zone
- Likely to rise to resistance level 320.00
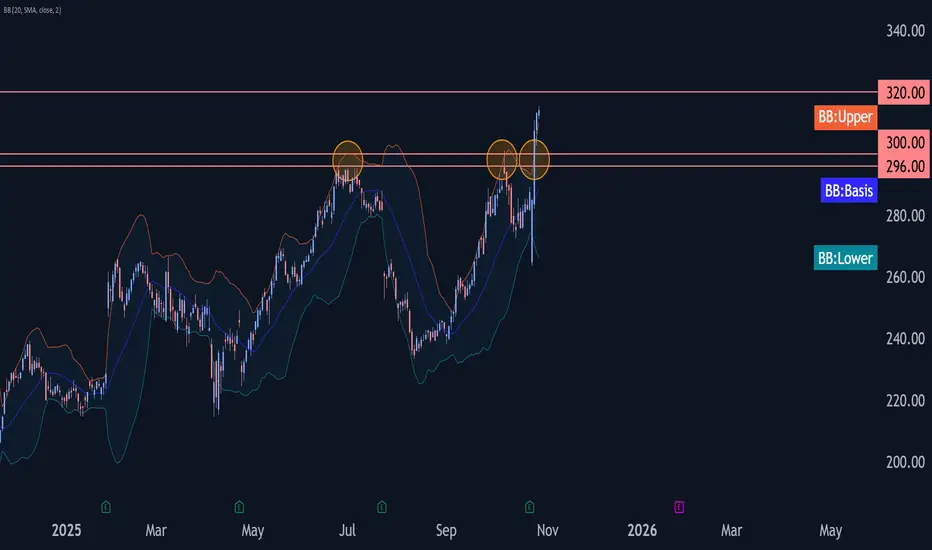
IBM recently broke the resistance zone between the round resistance level 300.00 and the 296.00 (which stopped the previous impulse wave (3) in the middle of June).
The breakout of this resistance zone accelerated the active impulse wave 3 of the intermediate impulse wave (5) from the start of August.
Given the clear daily uptrend, IBM can be expected to rise to the next resistance level 320.00, which is the target price for the completion of the active impulse wave 3.
What is Run Gain Potential and how do you use itToday's tutorial is about Run Gain Potential and how to calculate it for daily candles and intraday minute candles. It is a very important part of determining how far a stock can run, whether the run gain has sufficient points for good profits, and whether or not the run gain potential is shrinking over time, a common warning that instead of a minor retracement a correction either sideways or down is over due. Retracements and corrections are normal and necessary to maintain the integrity of the upward trend.
Also Run Gain Potential tells you where to place your stop losses. Using percentage stop losses instead of support appropriate for your trading style is the most common reason why retail traders stop losses are taken too soon.

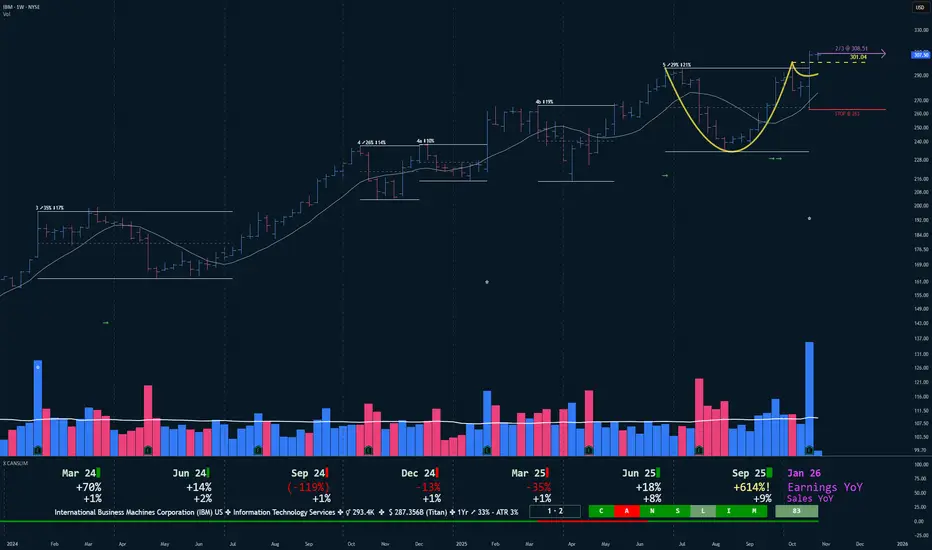
IBM just cleared a daily Cup with Handle on strong earningsKey points at the time of writing.
✣ New bull market cycle running since June 2025
✣ Market Direction is Up 90%
✣ Stock Fundamentals have just turned good.
✣ Institutional support with a buy/sell ratio of 1.3 and a ownership of 59%
✣ TTM Performance is 33%
I expect a more important upside move if we get some follow-through in the comming weeks.
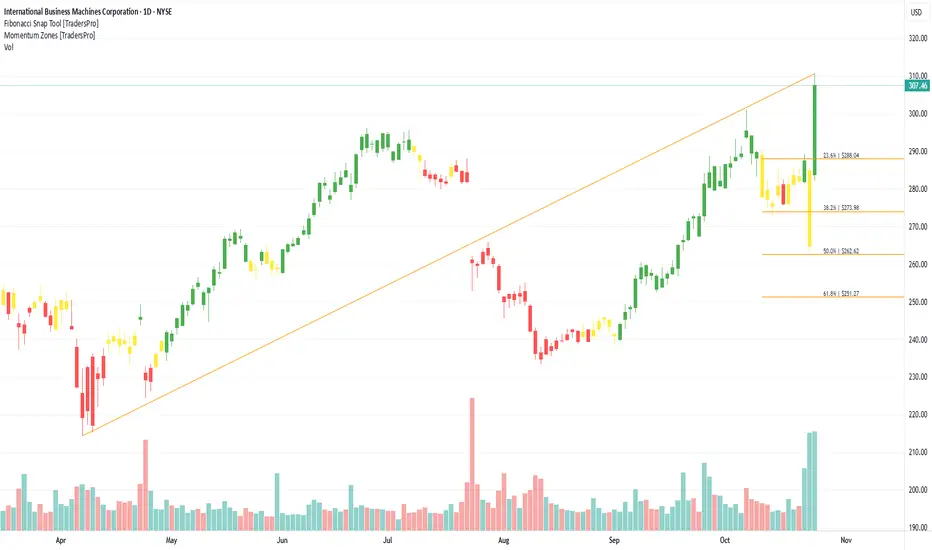
IBM (IBM) Expands AI and Cloud Technology ReachInternational Business Machines Corporation (IBM) is a global technology and consulting leader specializing in hybrid cloud, AI, and enterprise IT solutions. The company’s platform helps organizations modernize infrastructure, enhance cybersecurity, and drive digital transformation. IBM’s growth is fueled by the expansion of its AI-powered Watsonx platform, steady demand for cloud services, and its leadership in helping enterprises integrate AI and automation across global industries.
On the chart, a confirmation bar with rising volume highlights bullish momentum. The price has entered the momentum zone after moving above the .236 Fibonacci level. A trailing stop can be set just below this Fibonacci line using the Fibonacci snap tool, helping traders protect profits while leaving room for continued upside potential.
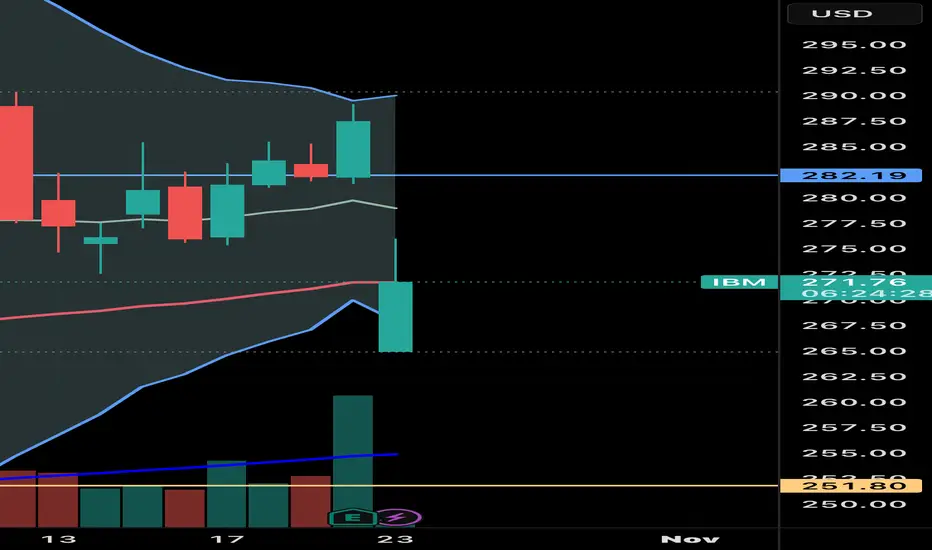
Premarket activity is a sign of manipulation So, I have done my research to pick the right moment to enter a trade, studies the market and earnings. Everything went well. The stock gone up for @IBM after the announcement. I am waiting to get some return on my money spent on this stock as a trader.
But then comes the premarket activity.
The stock has gone down premarket, from $287 to $262.
Made me lose trust in this US stock market as a whole.
What a stupid example of manipulation and corruption. Favouring some people or organisations (legally with rules, but still favouring) over the rest of individuals.
What is the difference between USA and China ?
All manipulating and corruption but in different methods. Each one seeing the other corrupt.
To me, both as rotten and corrupt as each other.
Levels to trade IBM's Wyckoff Distribution phaseWhile IBM beat EPS and revenue estimates, the stock is selling off hard. News indicates investors are focused on decelerating growth in the key Red Hat (software) segment. This "sell the news" reaction is a classic confirmation of a distribution top.

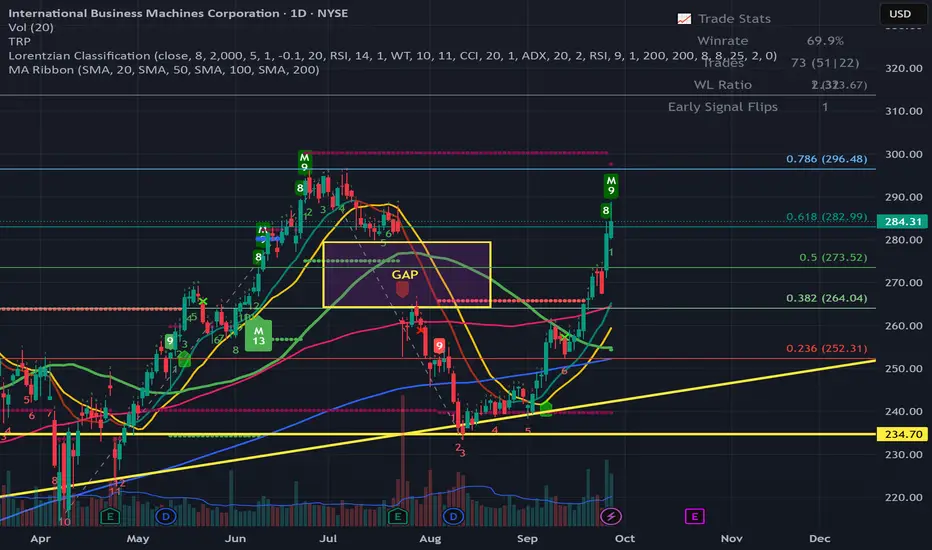
IBM - Closed the GAP, What is next?Hello Everyone, Followers,
In September 7th I shared below analysis and talked about possible GAP closure for IBM. Here is the link:
Approx %15 in 20 days , not bad :))
Now what is next for IBM:
Related to the Quantum Computing news support this move, as IBM is also working on the Quantum area and i am expecting to to reach 296 - 300 in short term. This level is our next Resistance level and if it breaks this level then i would expect to reach 315- 317 first.
Other possibility is : Pull-back to 274-275 then get support from this level and try to break 296 - 300. If it decide to do this then these levels are good level to buy.
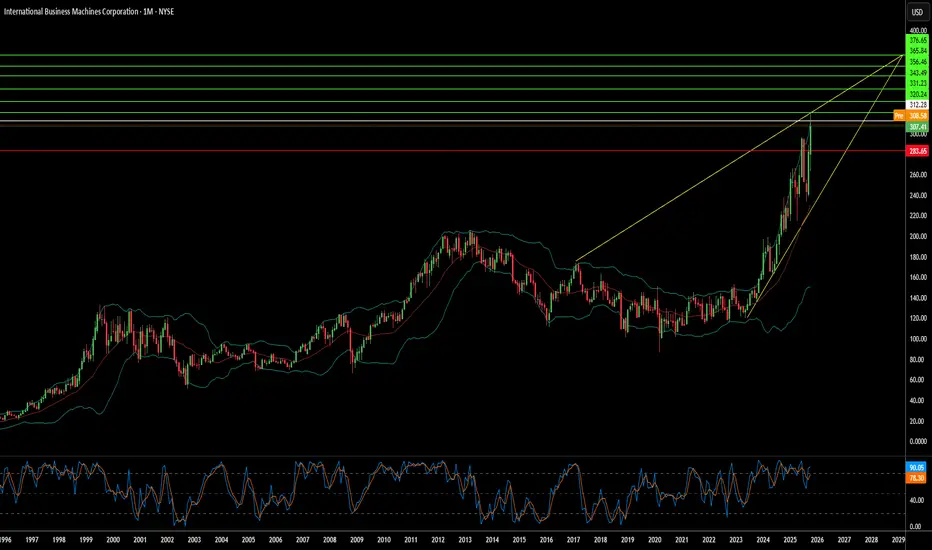
Depends on the news and other political statuses, there is a possible to reach 360 - 365 level end of the this year . This is a note to myself.
This is just my thinking and it is not invesment suggestion , please do not make any decision with my anaylsis.
Happy Weekend to All
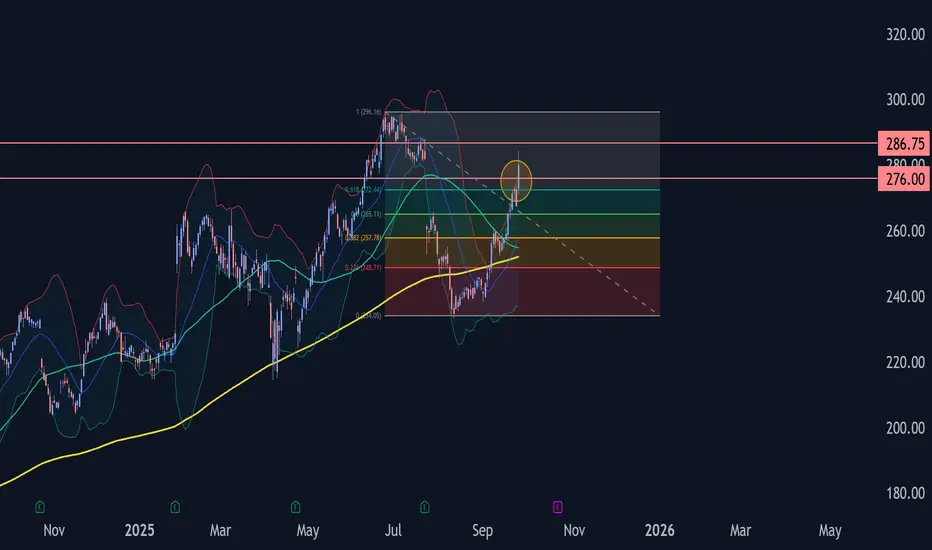
IBM Wave Analysis – 25 September 2025- IBM broke resistance area
- Likely to rise to resistance level 286.75
IBM recently broke the resistance area between the resistance level 276.00 and the 61.8% Fibonacci correction of the ABC correction (4) from June.
The breakout of this resistance area accelerated the active short-term impulse wave 3 of the intermediate impulse wave (5) from August.
IBM can be expected to rise further to the next resistance level 286.75 (former top of wave B from July and the target for the completion of the active impulse wave 3).
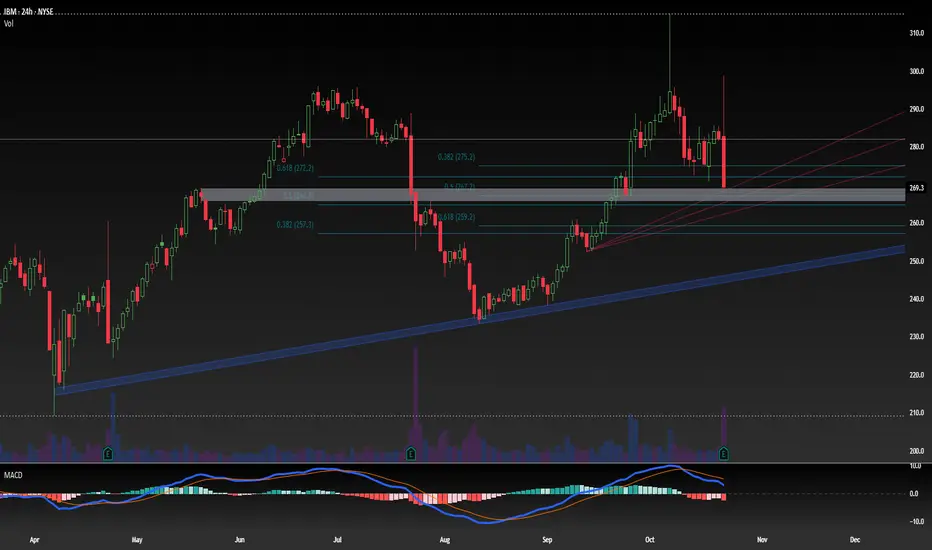
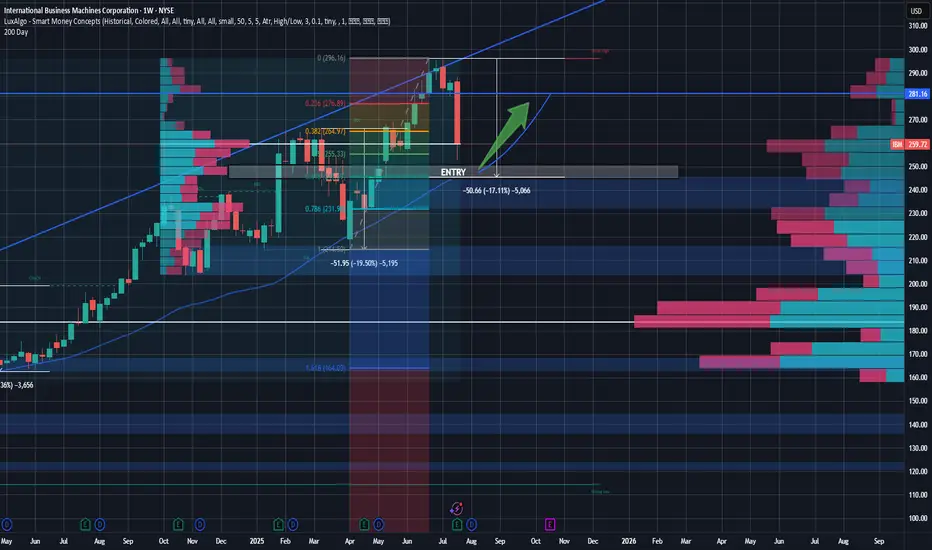
IBM Rebound Trade - Buying the Pullback at Key ConfluenceSetup:
IBM is setting up for a potential high-conviction long entry around the $245 level, a price zone marked by multiple layers of technical confluence and volume-based support. Over the last 18 months, IBM has seen two notable pullbacks—both in the 17–20% range, often around earnings events. The current drawdown is consistent with this historical behavior and may represent an opportunity rather than a breakdown.
Technicals & Indicators
Volume Profile Support:
Using a volume profile anchored from January 2024, a clear volume shelf exists between $245 and $265.
A second profile anchored 10 months ago confirms heavy volume at $260 and $245, indicating high institutional activity and potential support zones.
200-Day Moving Average:
IBM has consistently respected its 200-day MA over the past two years. The MA is now converging at $245, adding dynamic trendline support.
Fibonacci Retracement:
Applying retracements from the April 2025 lows to the recent ~ $300 highs, the $245 level aligns with the 61.8% Fibonacci level, a key zone for potential reversals.
GAP Fill:
Looking for the recent earnings gap to close within the next 2 months, as we see new opportunities for tech companies and rising demand. This overreaction created a gap that should be filled as investors digest the macro strength and re-enter long positions in IBM. Gap close ~ $280 level.
Candles & Buying Pressure:
Recent daily volume after earnings suggests strong buying pressure with a hammer/doji candle forming on the day after earnings. Investors are already buying back into this name.
Fundamentals & Business Operations:
Despite the post-earnings dip, IBM continues to display strong business fundamentals:
Free Cash Flow (TTM): ~$12.3B, supporting dividends and future investment.
FCF Margin: 19.1%
Gross Margin: ~58% | Operating Margin: ~ 17%
Forward P/E: ~22.45x | EV/EBITDA: ~19.85x
Dividend Yield: 2.6%
These metrics reflect operational efficiency, cash generation, and relative undervaluation compared to peers—especially given IBM’s AI and hybrid cloud positioning that remains strong. With margins that continue to be at the top of the industry, IBM also has the resources to execute on the tremendous opportunities arising in the tech world.
Macro & Industry Context:
We’re in the early stages of a long-term AI and data center growth cycle, and IBM, while not the most popular AI name, is deeply embedded in enterprise infrastructure, consulting, and mainframe compute. Their recent earnings beat didn’t change that narrative. Investor sentiment overreacted, giving patient traders a potential entry on weakness. Analysts still hold a buy on this name with price targets well above $270. This isn't a one-day trade, but in a few weeks, let's see where the market is at.
Price Targets & Risk/Reward:
Entry Zone: $245 (watch for confirmation & strength)
Target 1: $280 (resistance level with high volume in the range)
Optional Long-Term Hold: If the broader AI trend continues, IBM could break all-time highs and trend above $300 over time.
Strategy & Patience:
This is not a chase setup. I will wait for $245 to be reached and confirmed—a level backed by technical support, volume profile, and long-term valuation logic. If IBM holds and reverses with strength, this could be a strong swing trade or even a long-term position for investors who want value with AI exposure. I will be looking for a confirmation(maybe a candle pattern) before entering the trade, but if it gets there, I see good potential for a bounce.
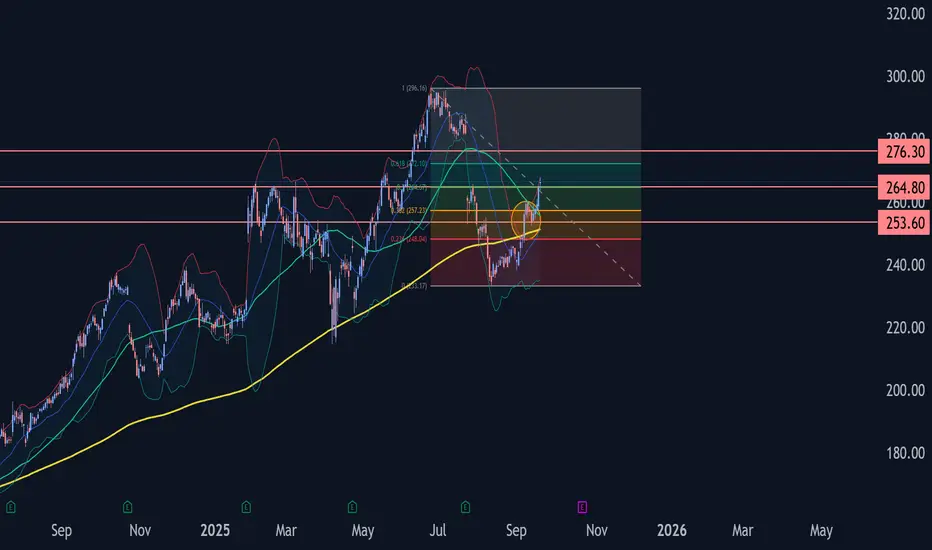
IBM Wave Analysis – 19 September 2025
- IBM broke resistance level 264.80
- Likely to rise to resistance level 276.30
IBM recently broke the resistance zone between the resistance level 264.80 (which stopped the previous wave (ii) in July) and the 50% Fibonacci correction of the ABC correction (4) from June.
The breakout of this resistance zone continues the active short-term impulse wave 3 from the start of September.
Given the clear daily uptrend, IBM can be expected to rise to the next resistance level 276.30 (former support from June).
$IBM - gap fill to $280IBM - nice move today. Stock is strong here and entering the earnings gap to $280. swing calls added in the group. looking for gap fill.
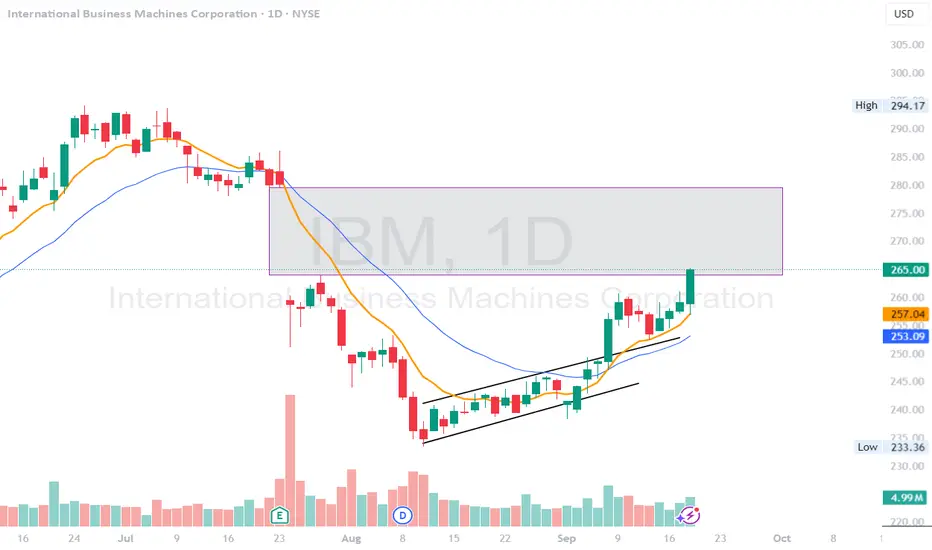
$IBM gap fill incoming Simplicity is best when trading options... triangle breakout, crossing moving averages and a clear target.
I'm playing up to $265 with 10/17 contracts & leaving 12/3 contracts looking to fill gap by mid November.
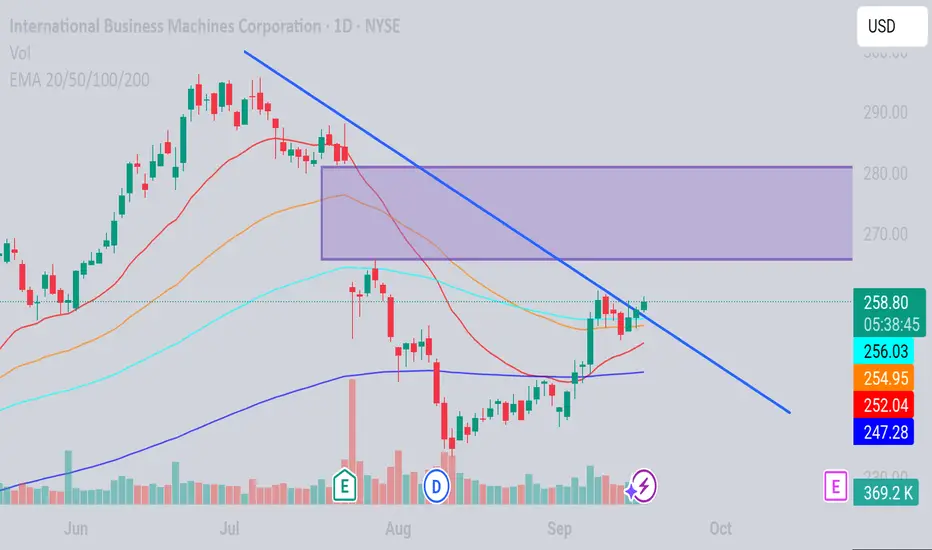
Bullish Alert: confirmed Head & Shoulders Breakout Price action has been building tension for weeks. After forming a classic head & shoulders pattern , the market seemed uncertain — bulls testing, bears pushing back. But price has broken the neckline decisively, signaling that buyers have taken control. This breakout is the confirmation that the previous hesitation is over, and the trend is ready to move higher. 📈
-> Momentum Confirms the Move
The MACD indicator has turned bullish. The MACD line crossed above the signal line, and the histogram is now positive. This shows that the momentum isn’t just short-term noise — it’s aligned with the breakout and supports continuation toward the target. Momentum and price action are both in sync, making this setup stronger than a pattern alone. ⚡
-> Trade Plan & Target
The measured move from this breakout points to 258 as the immediate upside target. Traders have two main options:
Enter on the breakout itself to ride the initial surge.
Wait for a pullback to the neckline for a potentially safer entry with better risk-reward.
Place a stop just below the neckline — this defines risk clearly while keeping the trade aligned with the bullish trend. As long as price remains above the breakout zone and momentum stays positive, the target of 258 remains realistic. 🚀

IBM | The Trend Is Your Friend | LONGInternational Business Machines Corp. is an information technology company, which engages in the provision of integrated solutions that leverage information technology and knowledge of business processes. It operates through the following segments: Software, Consulting, Infrastructure, Financing, and Other. The Software segment combines hybrid cloud platform and software solutions to help clients become more data-driven, and to automate, secure, and modernize their environments. The Consulting segment focuses on integrating skills on strategy, experience, technology and operations by domain and industry. The Infrastructure segment offers solutions for hybrid cloud and is the foundation of the hybrid cloud stack. Infrastructure is optimized for infusing AI into mission-critical transactions and tightly integrated with IBM Software including Red Hat for accelerated hybrid cloud benefits. The Financing segment refers to the client and commercial financing, facilitating IBM clients' acquisition of IT systems, software, and services. The company was founded by Charles Ranlett Flint and Thomas J. Watson Sr. on June 16, 1911 and is headquartered in Armonk, NY.
