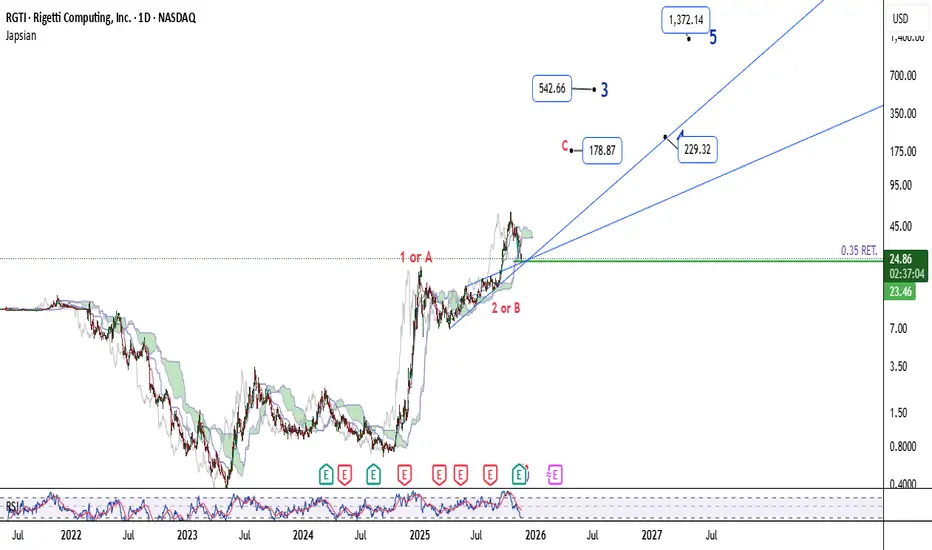
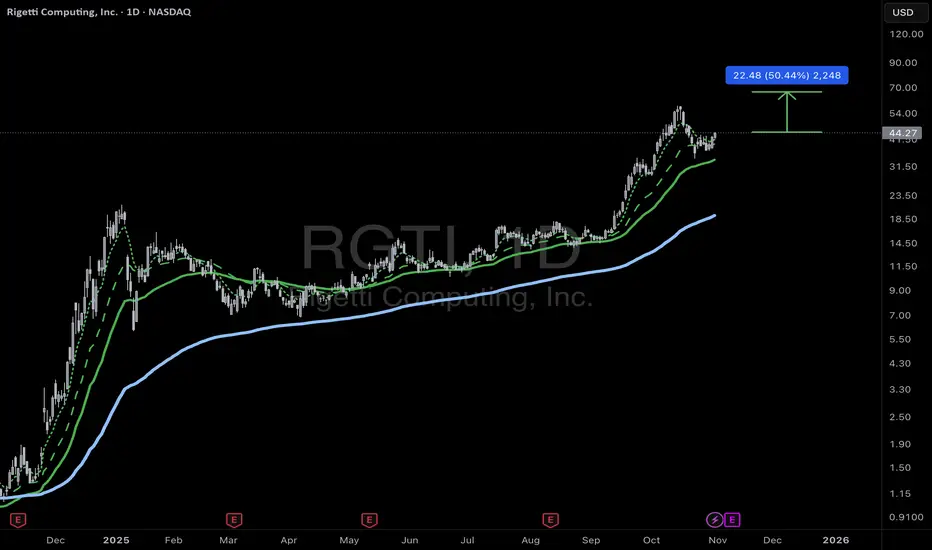
RGTIIn my view, RGTI has reached a major and very strong support zone. From this level, it may start forming either wave C or a larger wave 3, with the potential targets already marked on the chart.
Trade ideas
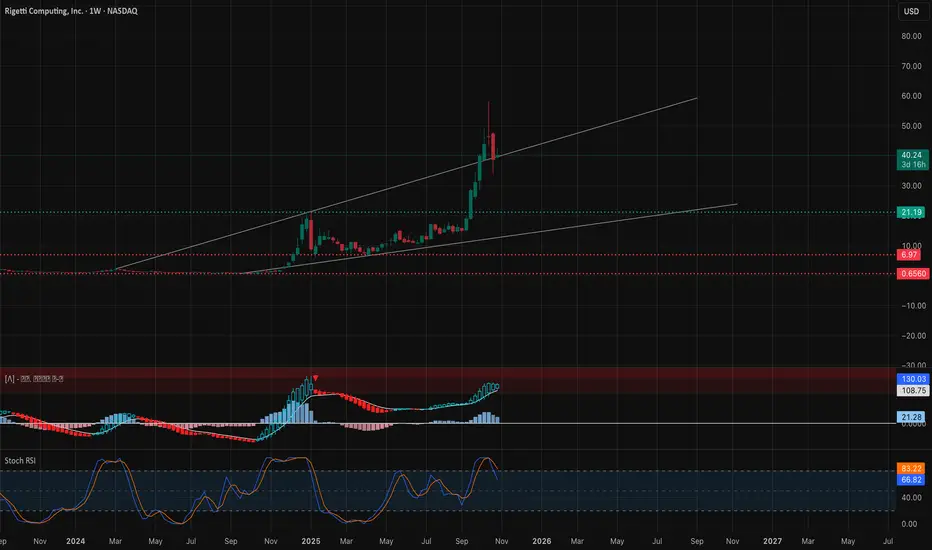
$RGTI: Reaction from Macro Resistance and Structural OutlookPrice reacted as expected from the key resistance outlined in the October update.
The main hypothesis remains that price has likely topped and is now completing its first wave of decline.
Any upcoming recovery attempt will be considered a bounce and potential lower high formation before further downside later this year.
Chart:
In the broader context, the critical zone to monitor is the 35–25 support area.
If price manages to stage an impulsive 5-wave recovery from this zone, the probability for another upside leg toward the next macro resistance at 85–115 will remain valid.
However, if the recovery from this area unfolds as a corrective 3-wave structure, then a breakdown below the Dec’24 top and continuation into the macro support zone will become the higher-probability scenario.
Chart (weekly):
Previous Updates
• On macro resistance and potential topping (Oct 13)
Chart:
View Idea
• On support and pullback potential (Sep 24)
Chart:
View Idea
• On macro structure (Sep 18)
Chart:
View Idea
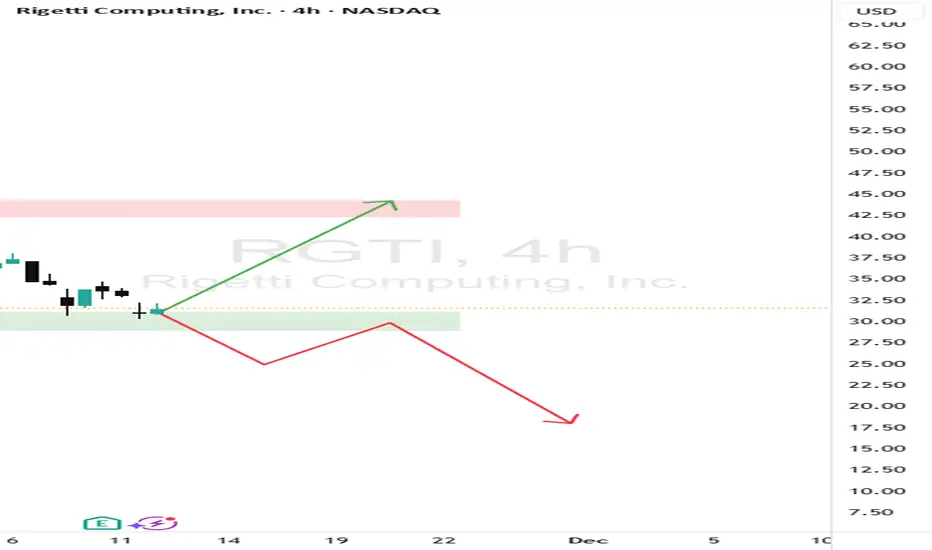
RGTI at Key Support Zone — Potential Rebound or BreakdownNASDAQ:RGTI is currently testing a key demand zone around $30, where previous accumulation occurred before the last rally. A clear reaction from this area could decide the next major move:
Bullish scenario: A rebound from this zone could drive the price toward the $42–45 resistance area (previous supply zone).
Bearish scenario: Failure to hold above $30 may trigger a continuation of the downtrend toward $20.
RSI is approaching the oversold region, hinting at a possible short-term bounce, but confirmation requires a strong bullish candle or a break above the recent lower high.
Given the high volatility of RGTI, traders should watch for volume confirmation before entering.
Fundamentally, Rigetti remains a speculative quantum computing stock—strong balance sheet but unprofitable, with long-term potential yet short-term valuation risks.
RGTI - Dip Buy Opportunity In Winning Quantum Stock Earnings coming up at market close today for this high volatility quantum stock that has printed a very bullish HTF trend so far.
HTF chart:
Notice on LTF chart that it has dipped into the higher liquidity zone below support.
Then notice the lower wicked candle (arrow) that has printed a bullish whipsaw - signalling potential bullish interest.
That low is within a 1:0.618 Golden Window and if the LTF pivot holds then that is a bullish signal since the ratio with shorter wave 3 signals downside weakness.
This also has more bullish potential with Nasdaq looking bullish to start the week:
I bought some here and I may buy more through earnings 🙂.
This analysis is shared for educational purposes only and does not constitute financial advice. Please conduct your own research before making any trading decisions.

RGTI: Buy the dip zoneRGTI:
.
Quantum collapsed! Risk or opportunity? That depend on you!
Buy the dip zone!
.
US STOCKS- WALL STREET DREAM- LET'S THE MARKET SPEAK!

Rigetti Computing Stock Analysis before earningsRGTI Stock Analysis before earnings
About Rigetti Computing Stock (Ticker: RGTI), I see decent buying moment, altough having a P/S ratio of 1500 aproximately, which looks absurd in a value investing perspective, the stock is considered cheap and with great potential of having an uptrend in the long term. Great innovative perspective.
- In a technical outlook, this week has shifted above 42.25 usd level, which means a market structure shift, and breakout of the tanking effect last days. Today in the last trading day, has closed in expansion relating to the profile.
Relating investment advice: Not financial advice, and never risk more money that you can lose, trade at your own diligence!,
Stay safe,
Sebastian.

Rgti bull flag Drew this on my phone and I hate that this likely plays out. How is this garbage stock still pumping on zero fundamentals? Anyhow my bet is it pumps very hard into end of year.

RGTI - quantum computing on the move?Rigetti RGTI beginning a 50% move? New technology requires more and more computing power. Quantum computing is the next frontier. Is the risk work the return?
RGTI Weekly Outlook (Oct 28–31)RGTI Weekly Outlook (Oct 28–31): “Quantum Pullback or Continuation? Watching $40 for the Next Big Move”
1. Weekly (1W) — Long-Term Structure
Rigetti Computing (RGTI) recently completed a massive breakout structure, with a BOS (Break of Structure) that sent price soaring from single digits into the $40 zone — a gain exceeding 500%. The stock is now undergoing its first healthy correction phase within a broad ascending channel.
* Trend Bias: Still bullish on higher timeframe.
* Support Levels: $22 → $18 → $10
* Resistance Levels: $40 → $55 → $75
* Momentum: Weekly MACD remains firmly bullish but histogram momentum is cooling — a normal retracement after parabolic expansion.
* Stoch RSI: Rotating down from overbought, showing consolidation rather than full reversal.
💡 Macro takeaway: The structure suggests continuation potential toward $55 once the pullback stabilizes. Maintaining above $18–$22 would confirm the higher low formation and keep long-term bulls in control.
2. Daily (1D) — Corrective Phase in Play
On the daily timeframe, RGTI is retracing after forming a high near $55. The latest daily candles show early stabilization as buyers defend near-term support at $38–$40, coinciding with the trendline and prior BOS zone.
* Market Structure: Still in a correction phase after a vertical breakout.
* Support Zones: $40 → $34 → $28
* Resistance Zones: $43 → $50 → $55
* Indicators:
* MACD remains bearish short-term, but histogram contraction suggests momentum loss on the downside.
* Stoch RSI showing a potential bullish cross from oversold territory.
📈 Daily insight: The base-building around $38–$40 is crucial. If bulls can reclaim $43–$45 with volume, the next leg toward $50–$55 could trigger, supported by short-covering momentum.
3. 1-Hour (1H) — Intraday Playbook
On the 1-hour chart, the price has reclaimed its short-term uptrend after a CHoCH → BOS sequence. The stock is attempting to hold above the local trendline and defend $40 as its key pivot level.
* Bias: Intraday bullish while holding above $38.
* Support: $38 → $36 → $34
* Resistance: $43 → $45 → $48
* Playbook Scenarios:
* Bullish scalp: Break above $43.50, target $45–$48 with stop under $40.
* Dip buy: Enter near $38–$39 if defended; risk below $36 for bounce back to $43.
* Bearish invalidation: Below $36 = structure break, opens $34 retest.
💬 Intraday read: Momentum on MACD is neutral but improving. A decisive push over $43 could trigger momentum ignition, aligning with the hourly ascending structure.
4. GEX & Options Sentiment
From the GEX (Gamma Exposure) data and volume structure:
* Highest Positive NETGEX / Gamma Wall: $45 → $50 zone.
* Call Walls: $43 → $50 → $55.
* Put Support: $38 → $34.
* IVR: Elevated at ~50+ (speculative sentiment strong).
* Call Sentiment: Heavily call-weighted, aligning with bullish bias post-consolidation.
🔍 Interpretation: As long as RGTI maintains above $38–$39, the gamma setup favors upside continuation. A break above $43 could ignite a push toward the $50 call wall region.
5. Suggested Option Setups
Bullish Play (Primary Bias):
* Play: 40C–45C (0–2DTE) breakout setup.
* Entry: Above $43 breakout confirmation.
* Targets: $45 → $48 → $50.
* Stop: Below $39.
Dip Buy Setup:
* Play: 40C (1DTE) near $38–$39 support bounce.
* Target: $43–$45.
* Stop: Below $36.
Bearish Hedge (only if breakdown):
* Play: 35P (1DTE) if price loses $36 structure.
* Target: $34 → $30.
* Stop: Above $39.
Directional Bias
RGTI remains a high-beta quantum computing momentum stock with strong institutional attention. While short-term cooling is evident, the structure still supports continuation once the $43–$45 zone breaks.
🎯 Primary Bias: Bullish continuation after correction.
⚠️ Invalidation: Breakdown below $36 → deeper retracement toward $30–$34 range.
This analysis is for educational purposes only and does not constitute financial advice. Always do your own research and manage risk before trading.
RGTi Going long here at support just because the rsi is well oversold on the 1 hr time frame . option premium someone bought olmost 3 million in value for call for 2027 I don’t know if this is a hedge but I will long here

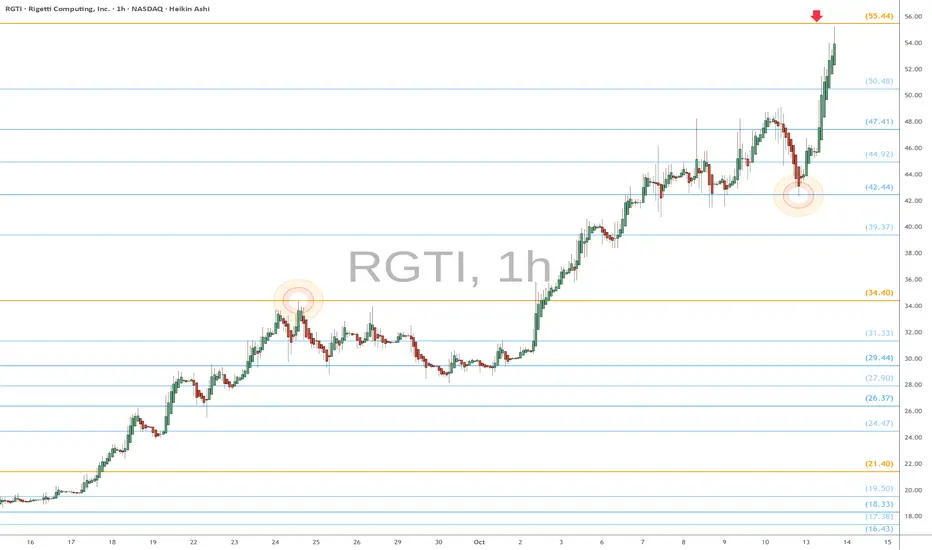
RGTI heads up at $55.44: Golden Genesis fib should give a DIPRGTI has been flying high for quite a while so far.
Now approaching a Golden Genesis fib at $55.44
Look for a Dip-to-Fib or Break-n-Retest incoming.
.
Previous Analysis that caught the BREAKOUT from $10
Hit BOOST and FOLLOW for more such PRECISE and TIMELY charts.
=========================================================
.
RGTI : First Long Position AreaNASDAQ listed Rigetti Computing Inc. stock is currently trading above the 50 and 200 period moving averages.
Once it gained momentum, it later lost it but its outlook is not weak at the moment.
Right now, if the Iran-Israel war uncertainty is overcome and if there is no bad news affecting the index, the gap may close.
Risk/Reward ratio of 3.00 is a very valuable ratio to try with small position amounts.
Risk/Reward Ratio : 3.00
Stop-Loss : 9.91
Take-Profit : 18.2
Regards.

Turns out my tweet topped Quantum stocksAfter seeing overbought conditions in quantum stocks, including a bearish divergence on the RSI, I jokingly tweeted about selling my positions. This happened to mark the top.

RGTI: Bearish TrendNASDAQ:RGTI — Weak hands being tested 🧠💡
Price keeps bleeding along the descending trendline — bears still have momentum.
Watching the $32.40 zone for potential reaction — that’s the make-or-break demand. A breakout above $46 would invalidate the short bias.
hashtag#RGTI hashtag#QuantumComputing hashtag#TechStocks hashtag#VolanX hashtag#WaverVanir

$RGTI - Rigetti Corp - $36 Short PTNASDAQ:RGTI is showing loss of momentum and we're currently leveraging RGTZ to hold into this consolidation back to the $34-$36 Price Levels if it continues to consolidate and retest the $42.30. It's rejected $48.06 consistently and is continue to follow these downward targets.

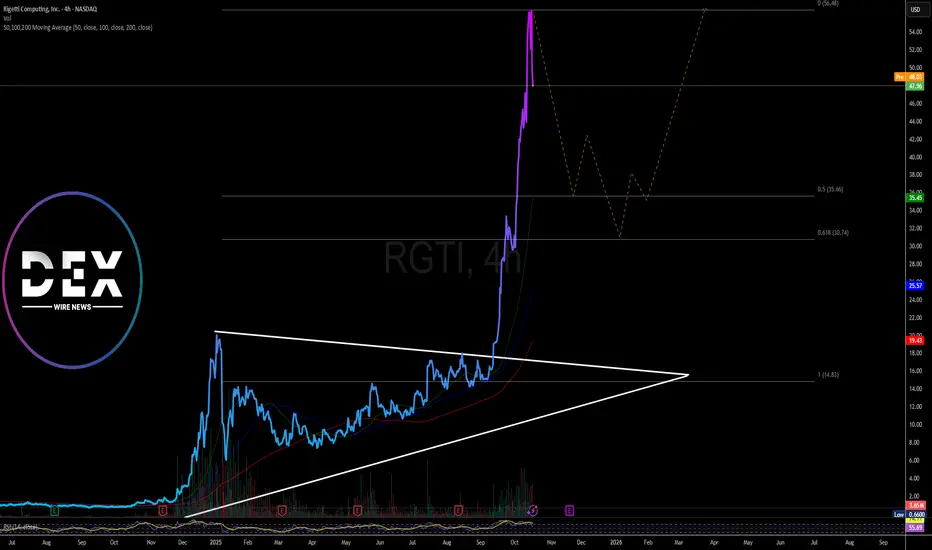
Rigetti Stock (RGTI) May Retraced After Breaking Out of A Wedge The share price of Rigetti Computing, Inc. (NASDAQ: NASDAQ:RGTI ) is poised to retraced to the 61.8% fib. retracement level after a wonderful stint- The computing giant spike 218% in the past 1 month to break out of a bullish symmetrical triangle to reclaim the $50 zone.
With the last recorded SI at 55, NASDAQ:RGTI might consolidate more pushing the RSI to 35 amidst bearish sentiment.
The stock was down 14% in yesterday's trading session further pushing the loss to premarket trading currently down 1.48%.
Further adding to the bearish sentiment is the fact that the founder- Subodh Kulkarni, has no stake whatsoever in the quantum technology company.
In May, Kulkarni exercised options to acquire 1,000,000 shares, only to sell them immediately – leaving him with zero ownership in RGTI.
About RGTI
Rigetti Computing, Inc., through its subsidiaries, builds quantum computers and the superconducting quantum processors the United States, the United Kingdom, rest of Europe, Asia, and internationally. The company offers quantum processing units (QPUs) and quantum computing systems through the cloud in the form of quantum computing as a service (QCaaS) products. It also provides 9- ubit quantum processing unit under the Novera QPU trade name; 84-qubit Ankaa-3 system under the name Novera QPU; and sells access to its quantum computers
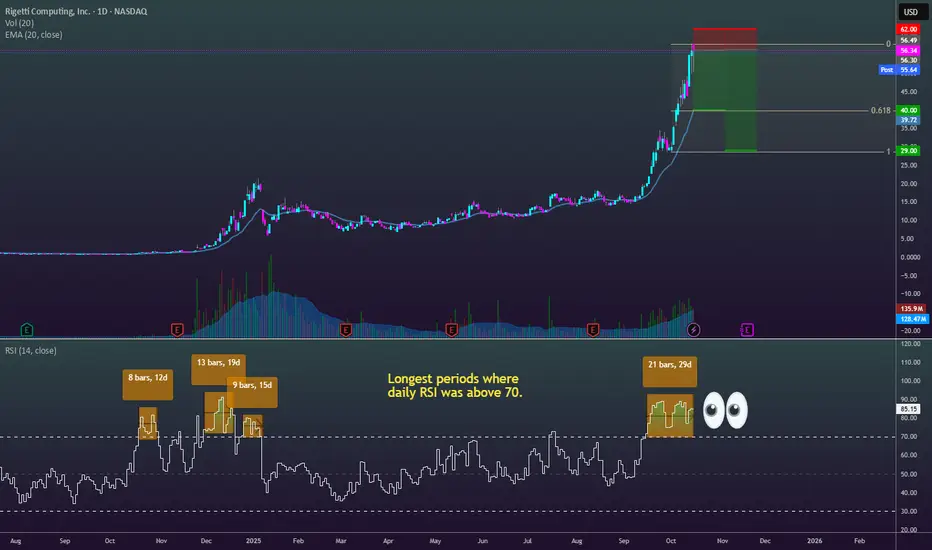
Fade this Quantum Stock into/after EarningsI'm seeing Q3 earnings as a bubble pop opportunity (early November). Daily RSI needs to be reset going on its longest streak right now above 70. PT of ~$40 would be a near term target to hit before earnings; ~$29 post earnings is possible on a big miss and guidance disappointment or general lack of excitement to maintain the currently lofty valuation.
I suggest DCA into a 2x short ETF: NASDAQ:RGTZ
RGTI: Quantum Momentum Unleashed — Is This Just the Beginning? While most of the market has been shaking off volatility, Rigetti Computing (RGTI) has quietly exploded into one of the most powerful breakouts in the quantum tech sector.
The weekly and daily charts both tell the same story — a confirmed institutional breakout backed by strength, volume, and perfect momentum alignment.
📆 Weekly Structure
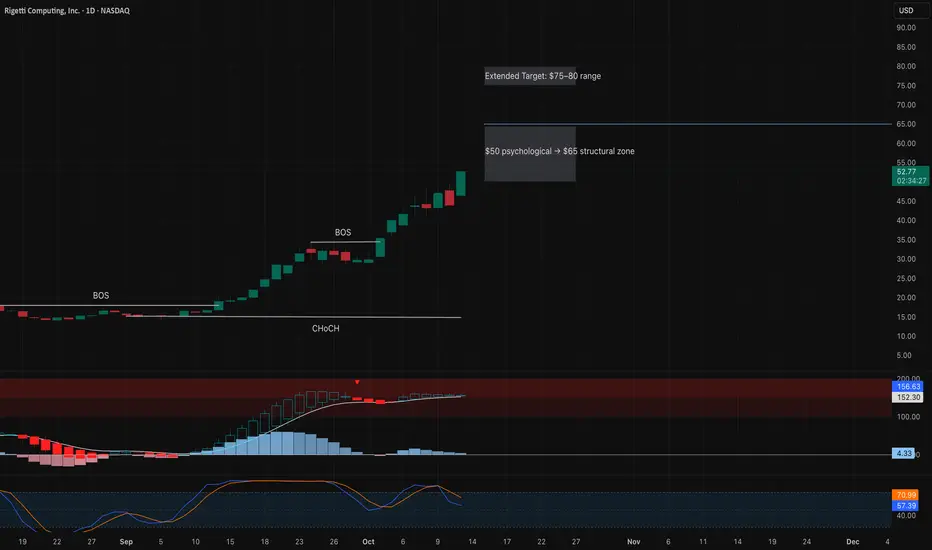
The weekly chart reveals a massive Break of Structure (BOS), with clean bullish continuation candles stacking higher each week.
Volume surged to new highs — a sign that institutional accumulation is still in play.
The MACD continues to expand upward, showing strong buying momentum, and the Stoch RSI has pinned at 100, signaling a fully charged uptrend, not exhaustion.
As long as RGTI holds above the $24–26 breakout zone, this move remains technically unstoppable.
Key Weekly Levels:
* 🟢 Support: $24–26 (confirmed breakout base)
* 🟡 Resistance: $50 psychological → $65 next structural zone
* 🔮 Extended Target: $75–80 range (long-term Fibonacci projection)
📊 Daily Structure
The daily chart confirms the momentum story.
After multiple BOS confirmations, price continues to trend in a tight rising channel — every dip has been bought with conviction.
MACD remains firmly bullish, and the histogram shows steady strength, suggesting momentum is building for another push higher.
Stoch RSI has cooled slightly, indicating there’s still room for continuation before the next consolidation.
If RGTI clears $53–55 with volume, it could easily stretch toward $65–70 in the coming sessions.
🎯 Outlook
RGTI is currently one of the strongest momentum structures in the market — a textbook example of bullish continuation after accumulation.
Momentum across all timeframes remains aligned, and as long as $26 holds, the trend bias remains upward.
A minor consolidation around $50–55 would be natural, but the bigger picture still points toward new highs in the $70–80 zone.
💭 Final Thoughts:
RGTI is following a classic “smart money trend” pattern — strong BOS, confirmed retests, and no visible weakness in volume or structure.
The bulls remain fully in control until proven otherwise.
This analysis is for educational purposes only and does not constitute financial advice. Always manage risk before trading.
Long trade
📘 Trade Journal Entry
Pair / Ticker: RGTI (Rigetti Computing Inc.)
Date: Thu 9th Oct 25
Time: 10:20 am
Session: LND to NY Session AM
Direction: Buyside Trade
Timeframe: 5-Minute
🔹 Trade Details
Entry: 44.87
Profit Target: 48.41 (+11.29%)
Stop Loss: 44.25 (–1.42%)
Risk-Reward Ratio (RR): 7.89
🔹 Technical Context
Model Type: Entry/Sweep/FVG Model 009
1min TF
Setup Sequence:
Asian Low Sweep → Choch → Demand Zone Reclaim
Order Block Confirmation at 44.25 zone with displacement candle.
EMA Confluence: Price reclaimed 50EMA, aligned above 200WMA as confirmation of structural shift. Fair Value Gap (FVG) provided liquidity refinement during continuation phase.
Volume spike aligned with breakout candle, validating institutional engagement.
RSI Divergence Reversal on lower timeframe leading to upside expansion.
VWAP Reclaim served as dynamic support confirming trend shift.
5min TF entry
🔹 Narrative Context
Rigetti displayed a classic liquidity-grab reversal setup after sweeping Asian lows and reclaiming structural demand during the London-to-NY transition. Momentum followed through with displacement above key moving averages and FVG retests. Volume and RSI confirmed buyer dominance, driving price efficiently toward the 48.00-48.50 zone.

10/9/25 - $rgti - Still here... gateway to bagelville10/9/25 :: VROCKSTAR :: NASDAQ:RGTI
Still here... gateway to bagelville
- still here. writing from the world of reality.
- i love trading this stock even tho i'm squarely in the red at this pt
- shorting the open and covering... and then playing longer duration ITM puts has kept me in the game, but still red nevertheless
- i'm old enough to remember when "management" told us they'd do nearly $300mm in revenue this year (2025) about 5-6 yrs ago. super exciting stuff.
- i think the number is going to come in around $10
- so they're chipping away nicely at this target
- i think what i enjoy most about shorting it against a healthy cash book... and some high conviction (albeit small LEAP positions in real companies) is that I know it's going to zero.
- i am well prepared to see it at $65 (some mystical target that the moonbois want to write about) or even $100. i'll still be here. it might become my largest position at that point (it's not today)
- but realistically, the north here is dramatically lower. and it will happen all of a sudden in a market-related risk off event.
- so enjoy the tendies while they last
- i'm still taking the under on these soiled pants and wishing "management" the best for whatever they'll communicate to keep $15B of valuation from going full on spooky action at a distance.
V

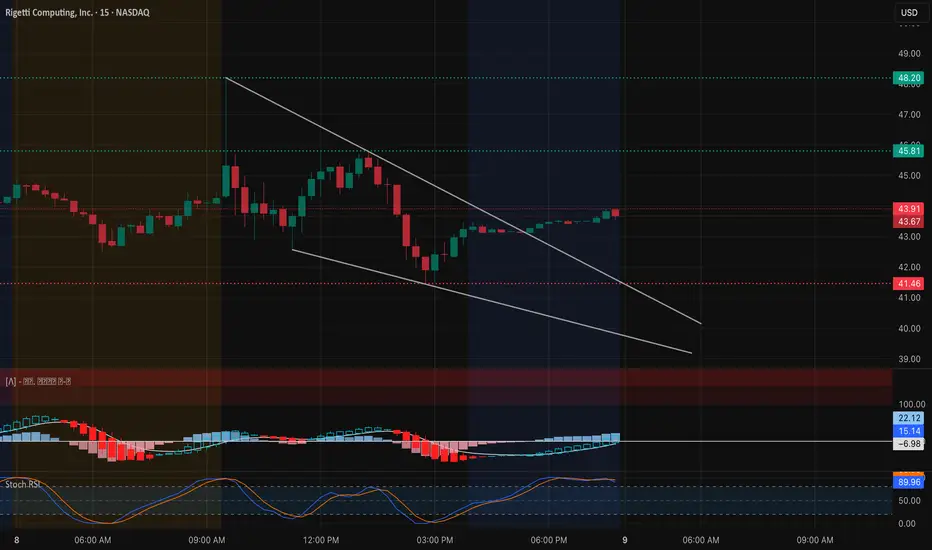
RGTI Oct. 9 — Descending Channel Near Breakout! Descending Channel Near Breakout! Bulls Watching $45.8 Zone 🔥
Rigetti Computing (RGTI) has been moving inside a descending channel, forming a clear base near $43 while showing multiple CHoCH signals that suggest potential reversal behavior. The 15-minute chart reveals that buyers have stepped in around $41.4 — a critical support zone — and price is now pressing against the upper channel trendline.
The recent CHoCH at $43.9 confirms short-term accumulation, and MACD is now trending upward from negative territory with momentum gradually improving. The Stoch RSI remains high, suggesting that while momentum is bullish, short-term cooling may occur before another leg higher.
A breakout above the descending channel around $44.5–$45 could trigger a technical rally toward $46–$48, while failure to hold $43 support may reopen the path toward $41.4 or lower.
Support and Resistance Levels:
* Immediate Resistance: $44.5 → $45.8
* Major Resistance (Target Zone): $48.2 → $49.0
* Immediate Support: $43.0 → $42.2
* Key Support Zone: $41.4 → $40.5
Technical Insights:
* Descending Channel: Price is nearing the upper trendline — a breakout could mark the start of a short-term bullish reversal.
* MACD: Histogram bars are turning positive, signaling recovering momentum after a deep pullback.
* Stoch RSI: Overbought but holding firm, showing that buyers are still active while momentum consolidates.
* Volume: Uptick in green bars during CHoCH levels shows gradual accumulation by buyers.
Trade Scenarios:
Bullish Setup:
* Entry: Above $44.5 breakout confirmation
* Target 1: $45.8
* Target 2: $48.2
* Stop-Loss: Below $42.8
* Rationale: Clear structure shift, bullish MACD crossover, and breakout from descending channel support a reversal toward upper resistance.
Bearish Setup:
* Entry: Below $42.8 breakdown
* Target 1: $41.4
* Target 2: $40.5
* Stop-Loss: Above $44.0
* Rationale: A rejection from the upper channel or false breakout could lead to renewed selling back to the lower boundary.
RGTI is at a pivotal technical point — a confirmed breakout from the descending channel could send it back toward the $46–$48 zone, while a failure here might see a retest of the $41.4 support base. Watch momentum closely around $44.5 for direction confirmation.
Disclaimer:
This analysis is for educational purposes only and does not constitute financial advice. Always do your own research and manage your risk before trading.
If anyone needs me to TA any stock, PM me.
Rigetti Computing: The Quantum Hype Doesn't Add Up to ProfitAs of October 6, 2025, the stock trades around $40, giving it a market cap of ~$13 billion. This is totally absurd for a firm with declining revenue and massive losses.
This analysis substantiates a bearish outlook, highlighting why shorting RGTI makes sense (FOR ME) amid hype-driven volatility.
I'm not picking only on Rigetti. I believe other quantum companies are also ripe for shorts. This exact same analysis can be applied to NYSE:IONQ , NYSE:QBTS , NASDAQ:QUBT and $NASDAQ:ARQQ. These companies trade between 500x and 3000x their sales.
Back to NASDAQ:RGTI , the company is in a profitability abyss, with revenue of $1.8 million in Q2 2025, while operating expenses were $20.4 million.
At this speed, their cash will burn real fast and the company will be forced to issue more shares, diluting/suppressing its price.
Are are some more important points:
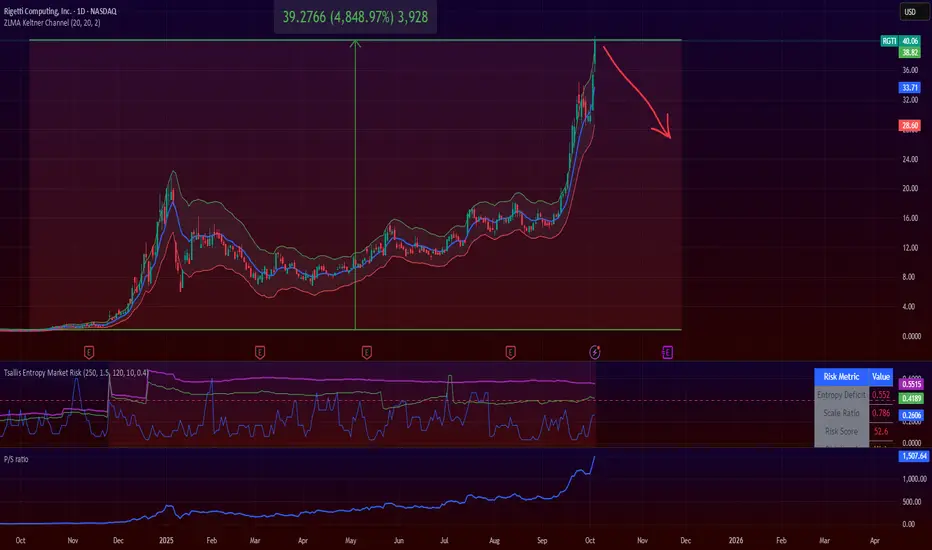
Rigetti's P/S ratio is at 1500x (WTF!)
The stock went up 4,800% in one single year (LOL)
They mostly sell vaporware
The current price is just nonsense hype and there are no fundamentals to sustain it
The intrinsic value of this stock is a very small percentage of the current price. Consequently, the stock is due for a strong correction.
I'm just sharing my personal opinion and journey. Do your own due diligence.
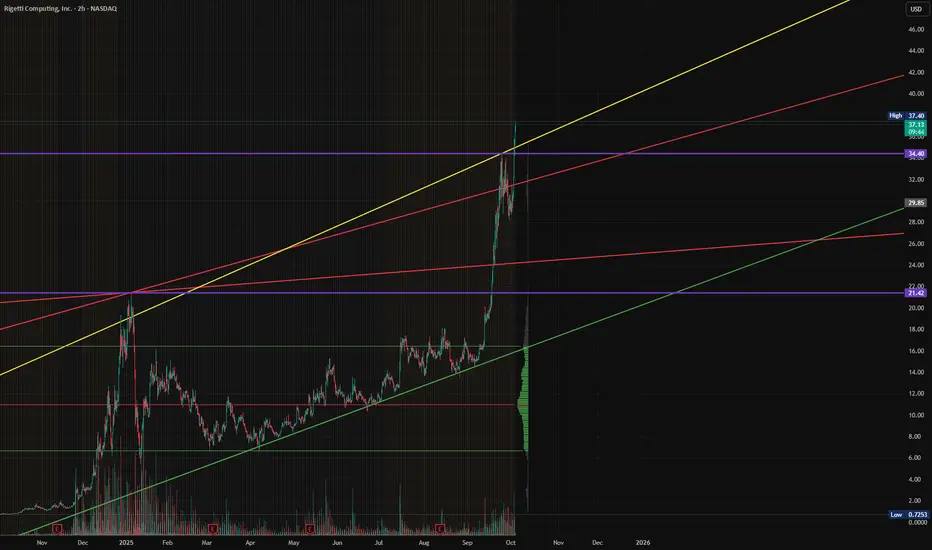
$RGTI - Rigetti Computing - $43 PT?NASDAQ:RGTI has been on a run, pushing from $0.72 to $21.42 going into 2025, consolidating and pushing into this continuation over the course of the remaining, breaking above that $21.42 Level of Resistance, now identifying resistance $34.40, where we will be looking for new strong support above those levels before pushing on to the $43 PT.