THIS TESLA / BTC FRACTAL - IS A MAPThis is an expanded view of today's chart (posted earlier). I wanted to offer a broader context. On this "channel", I'm trying to focus on Tesla & related charts. Since I'm not posting anymore Tesla (single asset) charts, until a new all time high has been reached, I thought I would continue to pose questions in the meantime. Like "what is a fractal, mathematically?"...to encourage you to pull the curtain to the side and see the wizzard behind the curtain.
This isn't OZ, this is a digital casino, that has a casino agenda. If you don't know WHAT that is, and HOW that works, then should you really be investing your money. Until newbies figure that out & learn what is truly governing price action...I will try and provide some maps and share some of my *basic trading ideas with you. Most of all encourage you to educate yourselves and LEARN TA!
For those of you that have & will private message me with requests for shortcut secrets to success, I will ONLY say this.
1-Pick 1 asset
2-Start learning TA now, and apply it ONLY to your 1 asset
3-Study it's price action for 10,000 hrs (about 5 yrs full time)
4-Realize that the same patterns are repeating across all assets.
For those of you that are too busy or unmotivated to study:
If you dont want to work for your money, then how can you expect your money to work for you?
May the Trades be with you.
Tesla, Inc.
No trades
Trade ideas

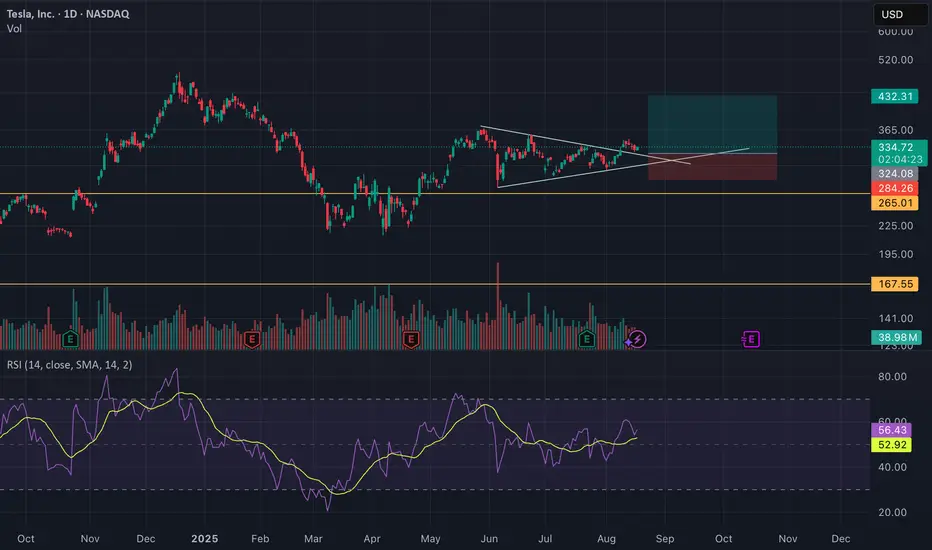
ascending triangle / ascending channelon the higher timeframe tesla has been trading in an ascending triangle, wich has broke out and retested. price target of the ascending triangle would be around $1600
but also trading in an ascending channel wich would face resistance at around $700 by februari 2026.

Tesla bullish momentum building above key support zonesCurrent Price: $455.00
Direction: LONG
Confidence Level: 68% (Based on multiple traders highlighting bullish setups near current support and social sentiment leaning slightly positive)
Targets:
- T1 = $470.00
- T2 = $485.00
Stop Levels:
- S1 = $445.00
- S2 = $440.00
**Wisdom of Professional Traders:**
Drawing on the collective analysis of many professional traders, the consensus points to Tesla maintaining upward momentum as long as it holds above the mid-$440s support zone. Several traders repeatedly noted bullish gamma exposures at $500 and ongoing cup-and-handle or inverse head and shoulders formations that could trigger rallies. The wisdom of the trading community suggests that even cautious voices are mostly treating pullbacks as opportunities to reload for a move higher.
**Key Insights:**
Here’s what stands out — Tesla is sitting just above strong technical supports at $440–$445, with many traders pointing to resistance in the $470–$480 area. The MACD is positive, the price is above both the 50‑day and 200‑day SMAs, and multiple professional traders discussed setups that historically have led to sharp breakouts when Tesla pushes past nearby resistance. The bullish tone is reinforced by the options market, where call interest at higher strikes is growing.
What’s interesting is that despite some mixed headlines, the social media buzz is leaning positive. Among the most recent X posts, bullish commentary about new battery tech and an upcoming vehicle class is outweighing the bearish concerns over guidance and European sales drops. This hints that sentiment might help break the current consolidation if technical levels give way.
**Recent Performance:**
Tesla closed the recent week with a modest gain, consolidating just above $450 after an earnings beat that lifted it to the $458 area. Price action has respected the $440 support twice in the past week, and intraday tests of $460 have been sold into. Overall, the stock is up strongly from its early November range near $420, signaling buyers remain active on dips.
**Expert Analysis:**
Multiple traders highlighted that a clean break above $470 could trigger momentum toward $500, with upside acceleration possible if market indices also rally. They flagged $440 and $432 as layered support zones where buyers have stepped in before. The strong weekly close and proximity to all‑time highs have been described as fuel for continuation. Some noted the risk of supply chain issues, but even cautious voices saw upside setups holding as long as those support levels remain intact.
**News Impact:**
The recent earnings beat, despite slightly lower guidance, has been a key driver for bullish momentum. Musk’s hint at a new vehicle class and the 4680 battery ramp-up planned for Q1 2026 have kept optimism high. On the flip side, European sales declines are a negative catalyst to watch, but U.S. and Asia demand plus energy storage contracts continue to support the bullish case.
**Trading Recommendation:**
Putting it all together, I like a long position on Tesla this week while it holds above $440. An entry in the $445–$450 range offers a favorable risk-reward toward T1 at $470 and T2 at $485. Stops should be considered just below $440 to manage downside if support fails. This setup benefits from both technical momentum and slightly bullish sentiment in social chatter. If resistance breaks, momentum could accelerate quickly, making it a worthwhile watch for active traders.
Tesla Reversal Signal Triggered at the 200 SMA!TSLA 🚗 Bullish Pullback Playbook — Smart Layered Entry Setup!
📈 Asset:
TSLA — Tesla Inc. (NASDAQ)
Swing Trade Playbook | Trend-Continuation Setup
🧠 Market Thesis
TSLA shows a bullish pullback into the 200-Day Simple Moving Average, a level historically respected by trend-followers. The latest Heikin-Ashi Doji Reversal signals buyers regaining momentum ⚡ — suggesting the pullback is stabilizing and demand is stepping back in.
This combination of trend support + reversal confirmation forms the core of this structured swing setup.
🎯 Plan Overview
A clean bullish continuation strategy using a refined layered entry method (professionally framed as “scaled limit entries”). This maintains your signature thief-style energy, but aligned with TradingView rules and presentation standards. 😎
🟢 Entry Plan (Layered / Scaled Limit Orders)
Using a scaling approach allows better average pricing during volatility.
Proposed buy-limit layers:
Buy Limit 1 → $420.00
Buy Limit 2 → $410.00
Buy Limit 3 → $400.00
👉 Traders may increase or reduce the number of layers based on risk tolerance and personal strategy.
🔻 Stop-Loss (Risk Control)
A defensive stop-loss is placed near $380.00, below recent liquidity pockets and under the 200 SMA structure.
⚠️ This level is optional — traders should select their own SL based on personal risk management.
🎯 Take-Profit Zone
Target area sits around $470.00, where:
Major historical resistance awaits
Overbought conditions often develop
High-volume sellers tend to re-enter
This zone is treated as a profit-taking escape point, but traders can exit based on their own judgment.
📡 Related Markets to Watch (Correlation Insight)
Keeping the global view helps improve trade confidence:
NASDAQ:QQQ — High correlation with mega-cap tech, TSLA often follows Nasdaq momentum.
NASDAQ:NDX — Strong tech index correlation; strength supports TSLA continuation.
SP:SPX — Broad-market risk sentiment gauge.
NASDAQ:NVDA / NASDAQ:AMD — Momentum flow in growth-tech impacts liquidity rotation into TSLA.
AMEX:XLY — Consumer Discretionary ETF (TSLA is a major component).
Key takeaway:
Strong tech-sector momentum + risk-on environment = enhanced TSLA bullish continuation probability 📊⚡
🧰 Notes for the Community
Dear Traders (Thief OG-style Family 😄) —
SL/TP levels shared here are only examples for educational purposes. You’re always free to manage your own positions using your own risk preferences. Trade smart, trade safe, trade stylish. 💼✨
✨ “If you find value in my analysis, a 👍 and 🚀 boost is much appreciated — it helps me share more setups with the community!”
This is a thief-style trading strategy presentation strictly for fun and educational purposes. Not financial advice.
#TSLA #Tesla #SwingTrade #BullishSetup #LayeredEntries #HeikinAshi #200SMA #NASDAQ #MomentumTrading #TechnicalAnalysis #TradingView #RiskManagement #TraderLifestyle #StockMarket

TESLA: Weak Market & Bearish Forecast
Remember that we can not, and should not impose our will on the market but rather listen to its whims and make profit by following it. And thus shall be done today on the TESLA pair which is likely to be pushed down by the bears so we will sell!
Disclosure: I am part of Trade Nation's Influencer program and receive a monthly fee for using their TradingView charts in my analysis.
❤️ Please, support our work with like & comment! ❤️

TSLA Weekly Alert: Katy AI Signals Puts Amid Bearish MomentumTSLA Weekly Trade Info – 2025-12-04
Instrument: TSLA
Trade Type: BUY PUTS (Katy AI Predicted)
Strike Focus: $395.00
Entry Range: $0.85
Target 1: $1.27 (≈50% gain)
Stop Loss: $0.63 (≈26% loss)
Expiry: 2025-12-12 (8 days)
Confidence: 58% (Speculative)
Weekly Momentum: NEUTRAL (-0.74% 1W)
Options Flow: Bearish, PCR 1.69 (strong institutional put positioning)
Analysis Summary:
Katy AI Signal: Bearish, predicts $447.54 → $435.96 (-2.59%) over 8 days
Technical: Resistance $454.26, support $422.12; multi-week bearish trend confirmed
News Sentiment: Mixed – EV leadership praised, but sector risks (AI correction, rate uncertainty)
Conflict Note: LLM suggests buy calls, but Katy AI predicts puts; follow Katy AI for direction
Risk: HIGH – low conviction, mixed signals, high PCR, speculative weekly trade.
Recommendation: Small position only due to high uncertainty.
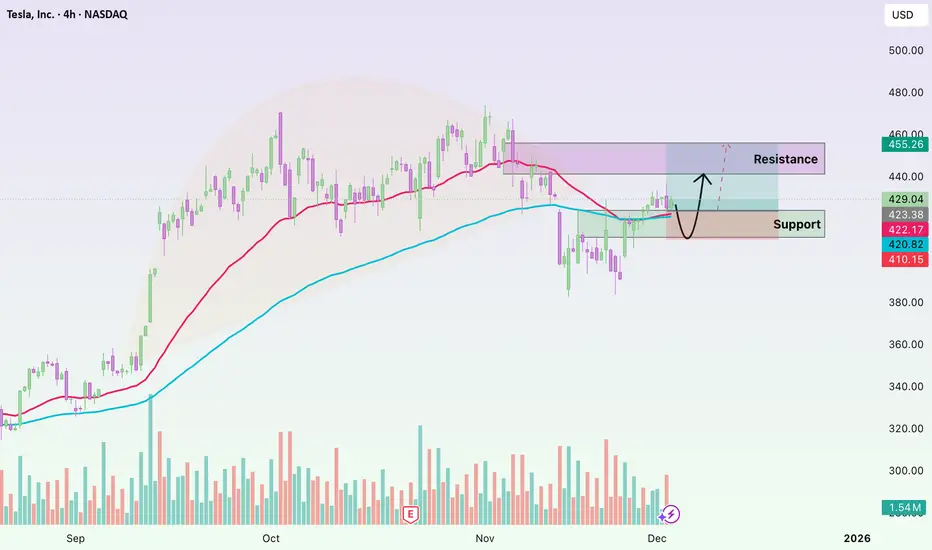
Tesla: Do Converging EMAs Signal a Decisive Moment?Hello everyone, looking at Tesla’s current rebound, my first impression is that the market is entering a rather sensitive “trend-defining zone.” After a strong decline since mid-November, TSLA has finally bounced and climbed above the EMA 34, moving straight into a test of the EMA 89 — where the two moving averages are creating a technically noteworthy confluence area.
In the past few weeks, Tesla consistently stayed below both the EMA 34 and EMA 89 , reflecting a clear and somewhat heavy downtrend. But the current recovery has partially changed the picture: buying momentum has returned strongly enough to push price above the EMA 34 and close in on the EMA 89. This is typically the moment when the market reveals its true intention — either continuing upward to confirm a phase shift, or pausing because buying pressure has not yet matured.
Volume has increased but remains relatively modest, indicating that large capital has not truly stepped in. This makes the 435–440 USD resistance zone a significant challenge: Tesla has been rejected here multiple times, and if buying power lacks depth, price may easily turn downward again.
Wishing everyone effective trading and resilience through every market movement!
TSLA in SELL ZONEMy trading plan is very simple.
I buy or sell when at either of these events happen:
* Price tags the top or bottom of parallel channel zones
* Money flow volume spikes beyond it's Bollinger Bands
So...
Here's why I'm picking this symbol to do the thing.
Price in selling zone at top of channels
Money flow momentum is spiked positive and nearing top of Bollinger Band
Entry at $447
Downside targets are
$370 bottom channel (short time frame)
$390 bottom channel (longer time frame)
$420 moving average
Will be buying NASDAQ:TSLQ

TESLA: Bullish Continuation Pattern: Eyes on 482 → 550 → 600TESLA: Bullish Continuation Pattern: Eyes on 482 → 550 → 600
TSLA is forming another bullish continuation pattern after a series of higher-low triangle formations. The structure suggests strong trend continuation potential if buyers reclaim momentum.
A confirmed breakout above the current resistance zone could open the path toward 482 and beyond.
Key Levels & Targets:
• 482 Quick target if resistance breaks
• 550
• 600
• 650
You may find more details in the chart!
Thank you and Good Luck!
❤️PS: Please support with a like or comment if you find this analysis useful for your trading day❤️

Long on TeslaThe rapid expansion of Tesla Robotaxi fleet in Austin from 30-60 cars to compete with google's waymo,along with it developing its own in house ai chips for its cars which would reduce operating costs to me that it can hit 600-650 within the next coming months .

Tesla $TSLATesla (TSLA) has launched new, more affordable "Standard" versions of its Model 3 and Model Y vehicles across Europe, a strategic move aimed at countering a sharp decline in sales within the region. This decline is attributed to intensifying competition from rival automakers and the polarizing political commentary of CEO Elon Musk, which has alienated some potential buyers.
Pricing and Product Details
In key European markets like the Netherlands, Tesla has significantly reduced entry prices. The Model 3 Standard is now listed at 36,990 euros ($43,130), a notable discount compared to the 45,990 euros ($53,620) for the Premium Long Range version. Similarly, the Model Y Standard is priced at 39,990 euros ($46,630), versus 50,990 euros ($59,450) for its Premium Long Range counterpart.
These Standard models are "de-contented," meaning they come with reduced specifications to achieve the lower price point. Key omissions and changes include:
The use of cloth seats instead of premium materials.
The removal of the rear passenger infotainment screen.
The absence of a glass roof.
Simplified interior lighting.
Less powerful electric motors and a decreased driving range per charge.
Both the Model 3 and Model Y Standard variants are available for delivery as soon as December. For context, in the United States, the Model 3 Standard starts at $36,990 and the Model Y Standard at $39,990.
European Sales Slump and Contributing Factors
The introduction of these budget-friendly models comes at a critical time for Tesla in Europe. According to data from the European Automobile Manufacturers' Association (ACEA), Tesla's vehicle registrations—a proxy for sales—plummeted by 48.5% year-over-year in October 2024, to just 6,964 units.
This decline starkly contrasts with the broader market trends. In the same period, total electric vehicle registrations across the European Union, UK, and European Free Trade Association surged by 32.9%, while overall vehicle registrations (across all powertrains) grew by 4.9%.
Analysts point to a confluence of factors behind Tesla's regional struggles:
Fierce Competition: The European EV market is becoming increasingly crowded with compelling offerings from both established European brands and new Chinese entrants.
Economic Headwinds: As CEO Elon Musk has noted, higher interest rates and an uncertain economic outlook are dampening consumer demand for big-ticket items.
CEO Polarization: A significant, albeit harder-to-quantify, factor is the backlash from some European consumers against Musk's public embrace of far-right political figures in the region and his contentious relationship with former U.S. President Donald Trump. This has led to a reputational challenge that may be affecting brand consideration.
Market Reaction and Technical Outlook
Tesla's stock (TSLA) showed little immediate movement on the news of the Standard model launch. However, shares are up approximately 6% for the week, largely buoyed by a recovery in the broader technology sector.
From a technical analysis perspective, the stock has identified two key support zones: the first at the 0.236 Fibonacci level (around $406) and a secondary, stronger support at the 0.382 Fibonacci level (around $354.94). On the upside, two primary take-profit targets have been established at $500 and $520 per share.
A Potential Catalyst: Regulatory Progress on Full Self-Driving
In a potentially positive development, the Netherlands' RDW vehicle authority has established a formal schedule for Tesla to demonstrate its Full Self-Driving (FSD) technology in February 2025. The purpose is to assess whether it meets European regulatory requirements. It is crucial to note that FSD has not yet been approved for use in Europe.
Securing approval from even a single European national regulator would represent a monumental step forward for Tesla. It could serve as a powerful differentiator in the market and a significant catalyst to help reverse the company's sales decline on the continent.
Conclusion
The launch of the Standard Range Model 3 and Model Y is Tesla's direct countermeasure to reignite demand in a critical but challenging European market. While the lower price point may attract more budget-conscious buyers, it remains uncertain whether this move alone can overcome the headwinds of competition, economic conditions, and brand perception. The upcoming FSD demonstration to Dutch regulators in February presents a separate, high-stakes opportunity that could substantially alter Tesla's trajectory in the region in the medium to long term.

Tesla Breakdown Alert: RSI Overbought + Bearish DivergenceTSLA Weekly Put Signal Summary
Direction: BUY PUTS (Short)
Confidence: 55% (Low conviction)
Strike Focus: $430.00
Expiry: 2025-12-12 (8 days)
Entry Range: $1.27–$1.29 (mid: $1.28)
Target 1: $2.54 (≈100% gain)
Target 2: $3.81 (≈200% gain)
Stop Loss: $0.76 (≈40% loss)
Position Size: 2% of portfolio (small due to low confidence)
Technical & Market Analysis
Katy AI Prediction: Downward movement from $453.85 → $435.44 (-4.1% predicted drop)
Weekly Momentum: Neutral (+0.07% 1W)
RSI: Overbought at 74.6 → suggests pullback possible
MACD: Bearish divergence detected → warning for reversal
Support / Resistance:
Resistance: $460.66 (stop loss level)
Support: $435.44 (Katy target)
Options & Flow Intel
Put/Call Ratio: 1.93 → strong bearish institutional positioning
High Volume: Protective $150 put activity noted
Max Pain: $452.50 → slightly below current price, aligns with downside bias
Risk Notes
Moderate risk due to low conviction + neutral composite score
Low volume may lead to whipsaw action
Tight stop recommended at $460.66 (breach invalidates bearish thesis)
💡 Key Takeaway:
This is a speculative bearish put setup based on Katy AI’s consistent short-term downward prediction. Only small position size is advised due to low confidence and moderate risk environment.
Tesla (TSLA) – Technical Analysis OverviewHello friends, I haven't shared an analysis for a long time. I'm back in the market. Don't forget to follow me for my regular analysis.
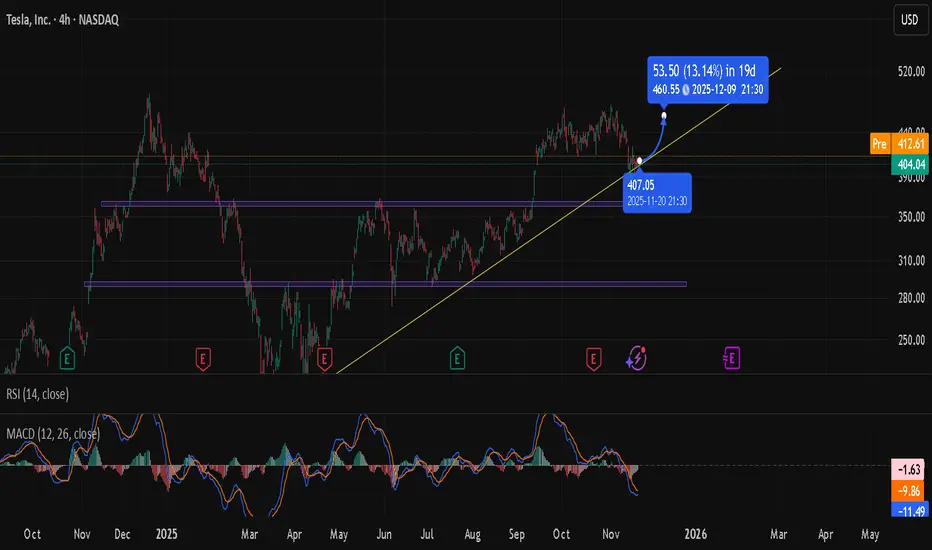
The chart shows that Tesla continues to hold its medium-term upward trend. The price recently tested the 408–410 support zone, which aligns with the rising trend line, and has reacted from that level. This area is technically significant, as it coincides with both trend support and a region where short-term liquidity has accumulated.
On the upside, the first notable resistance appears around 462–465. The projected ~13% potential move on the chart also points toward this region, suggesting that a rebound toward this level is plausible as long as the trend support remains intact.
Looking at the indicators:
RSI is currently within the 41–48 range, not in oversold territory but reflecting weakened momentum. This supports the idea that price is stabilising near a meaningful support area.
MACD remains in negative territory, indicating that bullish momentum has not fully recovered yet. A clearer shift toward the zero line would help confirm any sustained upward move.
In summary:
* The 408–410 zone is acting as a solid support.
* The broader trend structure remains intact and upward.
* 462–465 is the first major target area.
* However, momentum indicators are still soft, so confirmation through stronger candles would be constructive.
Volatility may remain elevated in the short term, but as long as the price stays above trend support, upward attempts appear more likely.
Disclaimer: This is a technical assessment only and does not constitute investment advice.*
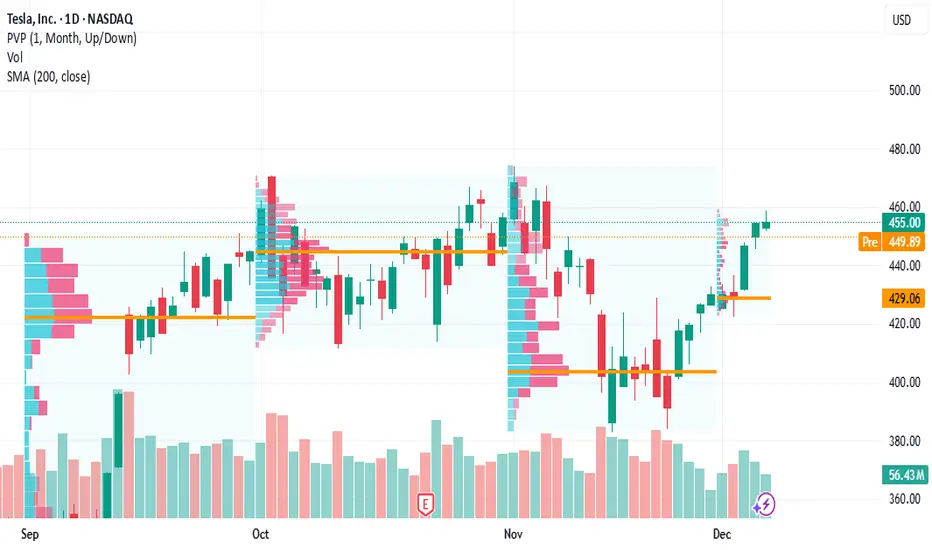
Tesla May Have Charged its BatteriesTesla has chopped sideways for months, but some traders may think the EV maker is ready to start moving again.
The first pattern on today’s chart is the $420 level. TSLA held that price several times between mid-September and mid-November. It briefly became resistance when the stock dipped but now the shares are holding above it again.
Second, prices bounced slightly above $380 in two separate weeks last month. That double bottom could be viewed as a bullish reversal pattern.
Next, the 8-day exponential moving average (EMA) is nearing a potential cross above the 21-day EMA. MACD has also started rising. Those may signal improving short-term trends.
Finally, TSLA is a highly active underlier in the options market. (Its average volume of 2.3 million contracts ranks second in the S&P 500, according to TradeStation data.) That may help traders take positions with calls and puts.
TradeStation has, for decades, advanced the trading industry, providing access to stocks, options and futures. If you're born to trade, we could be for you. See our Overview for more.
Past performance, whether actual or indicated by historical tests of strategies, is no guarantee of future performance or success. There is a possibility that you may sustain a loss equal to or greater than your entire investment regardless of which asset class you trade (equities, options or futures); therefore, you should not invest or risk money that you cannot afford to lose. Online trading is not suitable for all investors. View the document titled Characteristics and Risks of Standardized Options at www.TradeStation.com . Before trading any asset class, customers must read the relevant risk disclosure statements on www.TradeStation.com . System access and trade placement and execution may be delayed or fail due to market volatility and volume, quote delays, system and software errors, Internet traffic, outages and other factors.
Securities and futures trading is offered to self-directed customers by TradeStation Securities, Inc., a broker-dealer registered with the Securities and Exchange Commission and a futures commission merchant licensed with the Commodity Futures Trading Commission). TradeStation Securities is a member of the Financial Industry Regulatory Authority, the National Futures Association, and a number of exchanges.
Options trading is not suitable for all investors. Your TradeStation Securities’ account application to trade options will be considered and approved or disapproved based on all relevant factors, including your trading experience. See www.TradeStation.com . Visit www.TradeStation.com for full details on the costs and fees associated with options.
Margin trading involves risks, and it is important that you fully understand those risks before trading on margin. The Margin Disclosure Statement outlines many of those risks, including that you can lose more funds than you deposit in your margin account; your brokerage firm can force the sale of securities in your account; your brokerage firm can sell your securities without contacting you; and you are not entitled to an extension of time on a margin call. Review the Margin Disclosure Statement at www.TradeStation.com .
TradeStation Securities, Inc. and TradeStation Technologies, Inc. are each wholly owned subsidiaries of TradeStation Group, Inc., both operating, and providing products and services, under the TradeStation brand and trademark. When applying for, or purchasing, accounts, subscriptions, products and services, it is important that you know which company you will be dealing with. Visit www.TradeStation.com for further important information explaining what this means.

Tsla bullish breakout 2.7:1 risk reward ration Tesla is breaking out to bullish trend. Heading long here at 330, target 430$
Going Short TESLA HereTrading Fam,
I'm taking my first ever short here since implementing my new indicator. It has been killing it on the long side. We've exited our last 17 trades, all for wins, with an average profit of 30% per trade and our portfolio is up over 86% on the year. Now, it's time to test the short signals. We received two here on TSLA. I've taken a small entry since this is my first short, representing around 9% of the portfolio total. I'm going to target $350 but will not take more than a 7% loss, thus my stops are set at $476 bring the rrr on this trade entry to 1:3. Let's see how this goes.
✌️Stew

TSLA Post-Earnings Momentum – Don’t Miss!TSLA QuantSignals V3 – Weekly Trade Alert (2025-12-02)
Trade Direction: BUY CALLS (Bullish)
Confidence: 65% | Conviction: Medium
Recommended Strike: $430.00
Entry Range: $7.35
Target 1: $11.68 | Target 2: $15.43
Stop Loss: $5.11
Expiry: 2025-12-05 (3 days)
Position Size: 2% of portfolio
⚠️ Risk & Conflict Notes
Katy AI shows neutral bias with subtle bearish trend (-0.89% predicted move, 50% confidence), conflicting with bullish weekly momentum.
RSI overbought at 74 → potential pullback risk.
Options flow bearish (PCR 1.60) suggests institutional hedging; size position carefully.
Moderate risk warning: trade requires monitoring due to conflicting signals and short expiry.
💡 Trade Insight
Weekly bullish momentum +1.65% with trending regime supports short-term upside potential.
Technicals: MACD histogram bullish, VWAP support at $428.73, price near 91.6% of weekly range.
Timing advantage: leverage short-term momentum with 3-day expiry options.
Balanced delta (0.515) and tight stop loss help mitigate downside risk.

TSLA: Another Major Pivot — 325 Is Calling..We successfully caught the 3rd November high, and now we expect the current high to form another pivot.
From this area, we anticipate a continuation to the downside, with 325 as the next major target.
Bearish momentum remains in control.

TSLA Range Breakout SetupTesla on the daily chart is stuck in a tight battleground between structure and momentum. Price is consolidating below the 20- and 60-day moving averages after a bearish Market Structure Shift in early November, while still holding above the long-term 120-day moving average. The result is a classic Bear Flag look: a sharp downside pole followed by a choppy, upward-sloping consolidation between the $400 demand zone and $440 supply zone.
As long as TSLA trades inside this band, it’s a range game. The primary path is continuation lower if the Bear Flag resolves as expected. A daily close below roughly $415 would put pressure on the $400 support and open the way toward the $385 area, aligning with the flag breakdown logic and recent downside momentum. For this bearish continuation view, a sustained close back above $430–440 would effectively invalidate the pattern and suggest sellers are losing control.
On the flip side, a clean daily close above $440 would flip the script, clearing both key moving averages and turning the zone into support. That breakout could unlock a move toward the prior October swing region around $470, with the idea invalidated if price drops back into the range and especially below $400. This is a study, not financial advice. Manage risk and invalidations.
Thought of the Day 💡: Often the edge is in letting the market show its hand at the extremes of the range, not in guessing the next candle.
-------------------------
Thanks for your support!
If you found this idea helpful or learned something new, drop a like 👍 and leave a comment, I’d love to hear your thoughts!
TSLA Weekly Trade Snapshot: Bullish MomentumTSLA Weekly Signal | 2025-12-01
Instrument: TSLA
Direction: CALL (LONG)
Strike Price: $430.00
Entry Price: $9.50
Profit Target 1: $15.20 (60% gain)
Profit Target 2: $19.00 (100% gain)
Stop Loss: $6.65 (30% loss)
Expiry: 2025-12-05 (4 days)
Position Size: 2% of portfolio
Confidence: 65%
Weekly Momentum: BULLISH (+1.07% 1W)
Flow Intel: Bearish, PCR 1.56
Katy AI Prediction: Neutral (-0.91% predicted move)
Risk Level: MEDIUM – conflicts between Katy AI neutral and bullish technicals

$TSLA: $350 Target - $380 Short (Support Breaking)The support for Tesla seems to be breaking, and the oscillators are due for a negative downtrend along with the RSI close being too high. The analysts at the same time are neutral and this has been given a buy over a strong buy target with catalysts like lower earnings in some countries and a lack of competitive advantage over BYD for actual output of vehicles produced and sold. Management is also unsure of Musk who has a huge multitrillion dollar pay package incentive which will make the company even lower on cash. Therefore, the next target for a NASDAQ:TSLA short in my opinion, is $380 or less within Q1 of 2026. As always, none of this is investment or financial advice. Please do your own due diligence and research.

TSLA Gamma Structure and Key Reaction ZoneTesla (TSLA) stock has roughly $100 million of positive gamma exposure at the $450 strike, meaning a large concentration of call options is forcing dealers to buy shares as price moves upward toward that level, potentially creating a feedback loop that accelerates upside momentum. This “gamma wall” can act as a short-term magnet where price is drawn higher as hedging intensifies, but the effect is typically strongest only as long as spot price approaches or trades into that strike before options expiration.

