Tesla poised for breakout as bullish momentum builds up
Current Price: $458.96
Direction: LONG
Confidence Level: 68% (Based on clear bullish bias from multiple professional traders, strong call option flow, and price action holding above key EMAs despite mixed sentiment on X)
Targets:
- T1 = $465
- T2 = $475
Stop Levels:
- S1 = $452
- S2 = $440
**Wisdom of Professional Traders:**
I'm seeing the collective consensus from many professional traders leaning bullish on Tesla this week. Several traders highlight strong relative strength compared to the broader market, with repeated mentions of a potential run toward $470 and even $500 if the breakout holds. The wisdom of the crowd here is built on multiple factors: unusual bullish call flow, price holding above the 20‑ and 50‑day EMA, and clear technical formations like cup‑and‑handle and inverse head‑and‑shoulders patterns that traders watch for continuation moves.
**Key Insights:**
Here's what's driving this setup: Tesla just posted a strong Q4 production beat and announced an FSD beta 2.0 rollout for Q1 2026, which traders see as a near‑term catalyst. Across the board, I'm noticing repeated references to 460‑470 as the "battle zone" where Tesla often consolidates before pushing higher. The MACD remains bullish, RSI is elevated but not in reversal territory, and option flow last week was overwhelmingly in favor of calls — 97% call flow versus only 3% puts.
What's interesting is that while some market watchers on X are cautious about valuation (PE > 300), the technical picture from professional traders shows price action defending support zones. The $450‑$452 area has been mentioned as a solid dip‑buy zone by multiple traders, with upside targets in the mid‑$470s this week.
**Recent Performance:**
Tesla is up 2.7% in the last 24 hours, closing strongly above both the 20‑ and 50‑day EMA. Volume came in about 10% above the 30‑day average, suggesting healthy participation. Over the past week, it's tested $465 resistance multiple times without breaking through, consolidating just below it — a common pre‑breakout behavior traders watch closely.
**Expert Analysis:**
Several traders I track have pointed out that Tesla is forming an inverse head‑and‑shoulders pattern around the 460 zone, with higher lows developing over the past few sessions. Others note that the $467‑$470 resistance cluster, once cleared, could quickly open the door to the $475‑$480 range. The unusually large call option purchases targeting $460 and $500 strikes reflect conviction among big players. Momentum indicators (MACD positive, histogram rising) support this bias.
**News Impact:**
The recent production and delivery beat for Q4 2025 has already lifted sentiment, though traders think it's not fully priced in yet. The announcement of the Full‑Self‑Driving beta expansion is being discussed as a major revenue driver, and footage of robo‑taxis running without safety drivers in Austin is helping to build the narrative. Potential regulation issues and valuation stretch are risks, but for this week, the news flow supports sustained bullish interest.
**Trading Recommendation:**
Here's my take: I’d look to enter on a dip toward $452‑$454, aiming for a break above $465 for T1 and riding momentum toward $475 for T2. Keep stops relatively tight below $450 (S1) and more conservative traders can use $440 (S2) as the ultimate fail‑safe level. Given the repeated trader mentions of these levels and strong call activity, this looks like a solid short‑term long trade for the week. Watch for a clean breakout through $467 — it could trigger a fast move to second targets.
Tesla, Inc.
No trades
Trade ideas

TSLA Impulse After Multi-Year Correction?Looks like Tesla completed a multi-year correction at $215 in the form of a Running Flat.
If so then the move from $215 to current price could be wave 1 of 3 that could eventually end up around the $900 level.

What The Cumulative Volume Index Can Say About Smart Money
The cumulative volume index is an indicator of great importance when trying to suffice the difference between a strong market and a weak one.
One thing that has interested me as related to this indicator is related to the divergences between the CVI and price movement.
Overall, you surely would like the underlying stock to have an overall upwards trending CVI, as this indicates that there is a strong demand for that market and money is consistently flowing into it.
A downwards CVI would indicate that sellers are exiting their positions and have lost faith in the market.
However, with that being said there is something to say about the divergences and convergences of the CVI and price movement.
Key points of rising CVI and falling price:
Accumulation / absorption: Buyers may be quietly absorbing supply on the way down, so the breadth/volume backdrop is improving before price reflects it.
Selling pressure is weakening: The down-move may be running out of fuel (fewer stocks participating on volume), even if the index/price is still drifting lower.
Higher odds of a reversal or bounce: Not guaranteed, but divergences like this often precede a short-term bottom, especially if you later see price break structure (higher high / reclaim key levels).
Key points of falling CVI and rising price:
Rally on narrowing participation: Fewer stocks (or less advancing volume) are powering the move, so the uptrend is more fragile.
Distribution / fading demand: Buyers are still lifting price, but the net volume backdrop is deteriorating—often seen near exhaustion tops or late-stage pushes.
Higher odds of a pullback or reversal: Especially if price is making new highs while CVI makes lower highs.
I believe that this is a macro-level indicator that can provide valuable insights into the overall health of a given market, but in order to trade based off of this indicator at favorable entries it would require other filters and catalysts to time the market more efficiently.
Disclaimer: The information provided is for educational and informational purposes only and does not constitute financial, investment, legal, or tax advice. I am not a licensed financial advisor, and nothing here should be considered a recommendation to buy, sell, or hold any security, cryptocurrency, or other financial instrument. Trading and investing involve risk, including the possible loss of principal. You are solely responsible for your decisions—do your own research and consider consulting a qualified professional before making any financial decisions. Past performance is not indicative of future results.

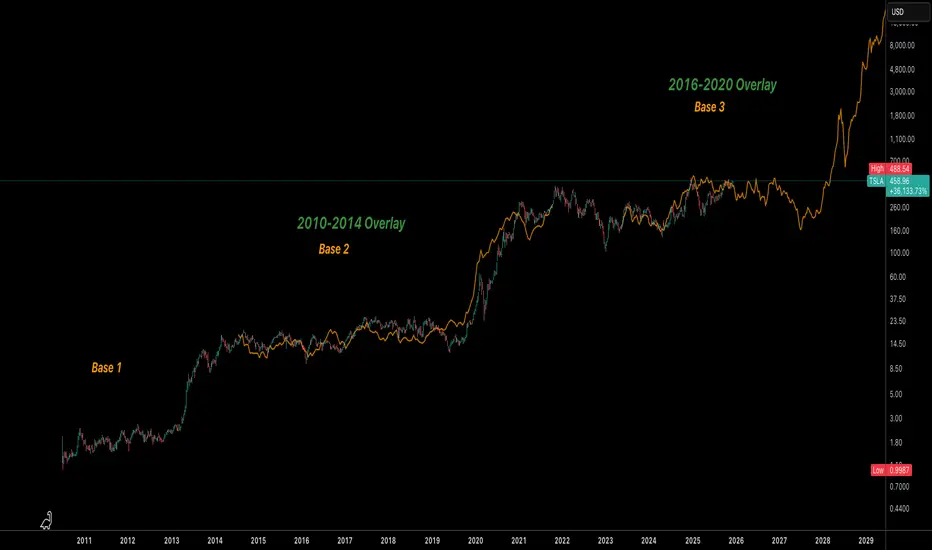
TSLA Weekly Log Chart: Three Bases, Same Rhythm?This is a TSLA weekly log-scale structure study that overlays prior “bases” onto the current price action to highlight Tesla’s repeating rhythm over the last decade-plus. Base 1 is normalized and overlaid onto Base 2, and Base 2 is then overlaid onto the current Base 3 to compare how Tesla historically moves from long, flat ranges into powerful expansion legs.
In both earlier cases, Tesla spent years in a broad, grinding base before resolving higher in a sharp, almost parabolic advance. The Base 1 → Base 2 overlay shows remarkably similar sequences: slow accumulation, a fake‑out or shakeout, then a sustained markup phase. The Base 2 → Base 3 overlay suggests the current structure is tracking that same rhythm on a higher price and market‑cap regime.
If this overlay continues to “rhythmically” follow Base 2, the message is not immediate liftoff, but a period of relatively flat / range‑bound trading first—choppy price action that compresses and frustrates, much like the late stages of Base 2 before Tesla finally broke out. The fractal implies that the market may need more time to digest, rotate ownership, and build energy before any potential next expansion leg. This would essentially be in the accumulation phase.
A clean break and hold above the upper end of the current multi‑year range would be the structural confirmation that the base has resolved; losing the lower band of the range for an extended period would weaken or invalidate the fractal. The overlay is used here to compare tempo and structure, not to project precise price targets or timing.
On a fundamental level, past parabolic phases in TSLA have coincided with inflection points in the story: rapid EV volume scaling, margin expansion, index inclusion, and a step‑change in investor perception of Tesla from “speculative automaker” to “platform / technology company.” Future parabolic behavior would likely need a similar kind of narrative and numbers shift:
• Clear evidence of sustained earnings and free‑cash‑flow growth from core EVs and new products (energy, autonomy, robotics, software).
• Large addressable markets actually converting into visible revenue and margin expansion, not just promises.
• A macro backdrop that supports risk assets and growth multiples, allowing the market to re‑rate Tesla higher again.
As market cap grows, each new cycle tends to require more time and more fundamental proof to justify a major re‑rating, which fits with the idea that these bases get longer even if the long‑term trend remains up. Percentage gains may compress, but the dollar move can still be huge—another reason the log scale is essential for seeing the real structure.
This is a structural and narrative framework, not financial advice. The overlay highlights how Tesla has “rhymed” in the past; whether it does so again will depend on execution, competition, macro conditions, and how the market chooses to re‑price the story this time.
TESLA: Short Signal with Entry/SL/TP
TESLA
- Classic bearish setup
- Our team expects bearish continuation
SUGGESTED TRADE:
Swing Trade
Short TESLA
Entry Point - 459.19
Stop Loss - 463.87
Take Profit - 450.58
Our Risk - 1%
Start protection of your profits from lower levels
Disclosure: I am part of Trade Nation's Influencer program and receive a monthly fee for using their TradingView charts in my analysis.
❤️ Please, support our work with like & comment! ❤️

Is Tesla Setting Up for a Rebound? Key Entry Levels Inside🎯 TSLA: The "Thief Strategy" Playbook | Swing/Day Trade Setup 📈
🔥 Quick Overview
Asset: Tesla, Inc. (TSLA)
Bias: 🐂 BULLISH
Strategy Type: Thief Layering Entry Method
Risk Level: Medium-High (Swing/Day Trade)
💰 The "Thief" Entry Strategy Explained
The "Thief Strategy" uses multiple limit orders (layering method) to accumulate position at different price levels. Think of it like setting traps at various floors of a building—you catch opportunities wherever price decides to visit! 🎣
📊 Entry Zones (Layer Your Orders):
Layer 1: $430.00
Layer 2: $435.00
Layer 3: $440.00
💡 You can add more layers based on your own risk appetite and account size. The beauty of layering? You average your entry and reduce timing risk!
🛡️ Stop Loss (SL):
Thief SL: $415.00
⚠️ Important Note: This is MY stop loss level based on the Thief Strategy framework. You're the captain of your own ship! 🚢 Adjust your SL based on YOUR risk tolerance and account management rules. Trade at your own risk—make money, take money, manage wisely!
🎯 Target (TP):
Primary Target: $490.00
🚨 Why $490? This zone represents a confluence of:
Strong resistance area
Potential overbought conditions
Historical trap zone where bulls get exhausted
📢 Thief OG's Reminder: I'm NOT saying you MUST take profit only at my TP level. If you see profits that make you smile, SECURE THEM! 💵 The market gives, and the market takes. Be greedy when you can, be smart always.
🔍 Technical Analysis Breakdown
Tesla is showing bullish momentum structure with potential for continuation toward the $490 resistance zone. The layering strategy allows us to build position as price potentially dips into demand zones before the next leg up.
Key Technical Levels:
Support Zone: $430-$440 (Our entry layers)
Invalidation: Below $415 (Stop loss)
Resistance Target: $490
📌 Related Pairs to Watch (Correlation Play)
Understanding correlated assets helps confirm your thesis:
AMEX:SPY (S&P 500 ETF)
TSLA often moves with broader market sentiment
Watch SPY for overall risk-on/risk-off environment
NASDAQ:QQQ (Nasdaq 100 ETF)
Tech-heavy index where TSLA is a major component
Strong correlation with TSLA price action
NASDAQ:NVDA (NVIDIA)
Both are high-beta tech growth stocks
Often move together during risk appetite shifts
TVC:DXY (US Dollar Index)
Inverse correlation: Strong dollar = pressure on growth stocks like TSLA
Weak dollar = tailwind for equities
💡 Key Point: If SPY/QQQ are bullish + DXY weakening = Strong confirmation for TSLA upside!
⚡ Trading Tips for Thief OG's
Don't FOMO — Let price come to your layers
Manage position size — Each layer should be equal weight
Trail your stop — Once profitable, protect gains
Watch volume — Confirm breakouts with volume spikes
Stay flexible — Market conditions change; so should you!
🎬 Final Words
This setup is all about patience, precision, and profit extraction! 🎯 The Thief Strategy isn't about stealing from the market—it's about being SMART and setting yourself up for success with calculated entries.
Remember: The best trades are the ones where you're prepared, not scared! 😎
✨ If you find value in my analysis, a 👍 and 🚀 boost is much appreciated — it helps me share more setups with the community!
#TSLA #TeslaStock #SwingTrading #DayTrading #ThiefStrategy #LayeringStrategy #StockMarket #TradingIdeas #TechnicalAnalysis #BullishSetup #TradingStrategy #RiskManagement #StockTrading #MarketAnalysis #TradingCommunity

World Finance Rating Agencies: An OverviewHistorical Background
The concept of credit ratings originated in the early 20th century. The first formal credit rating agencies were Moody’s (founded in 1909) and Standard & Poor’s (S&P) (with origins in 1860, evolving into S&P in 1941). Fitch Ratings, founded in 1913, also became a major player in the credit rating industry.
Initially, these agencies focused on rating bonds and fixed-income instruments in the United States. Over time, their operations expanded globally, covering sovereign nations, multinational corporations, structured finance products, and emerging markets. Today, the "Big Three"—Moody’s, S&P, and Fitch—dominate global credit ratings, collectively controlling roughly 95% of the market.
Purpose and Function
Financial rating agencies serve several critical functions in global finance:
Credit Risk Assessment: Agencies evaluate the likelihood that a borrower will default on obligations. Ratings range from high-grade (low risk) to junk (high risk), providing a snapshot of credit quality.
Investor Guidance: Investors, particularly institutional ones, use ratings to make informed investment decisions. Many funds and pension plans have policies restricting investments to certain rating thresholds.
Market Efficiency: Ratings reduce information asymmetry between borrowers and lenders. Investors can quickly gauge risk without conducting extensive internal research.
Regulatory Role: Financial regulators often incorporate ratings into capital adequacy rules. Banks, insurance companies, and investment funds may need higher capital reserves when investing in lower-rated securities.
Benchmarking and Pricing: Ratings influence borrowing costs. Higher-rated entities enjoy lower interest rates, while lower-rated issuers pay a premium for risk.
Types of Ratings
Financial rating agencies provide different types of ratings, depending on the instrument or entity being assessed:
Sovereign Ratings: Assess a country's ability and willingness to repay debt. These ratings impact government bond yields and influence foreign investment flows. Examples: U.S. AAA rating by S&P or India’s BBB- rating by Fitch.
Corporate Ratings: Evaluate corporations’ creditworthiness, often for bonds or long-term loans. These ratings reflect financial health, debt structure, profitability, and operational stability.
Structured Finance Ratings: Include mortgage-backed securities (MBS), collateralized debt obligations (CDOs), and asset-backed securities (ABS). These complex instruments require detailed risk modeling.
Municipal Ratings: Cover local government entities or projects, particularly in the U.S., affecting municipal bond markets.
Short-Term Ratings: Assess liquidity and ability to meet short-term obligations, often for commercial paper and money market instruments.
Rating Methodologies
Agencies use a mix of quantitative and qualitative methods to assign ratings. Key factors include:
Financial Ratios: Debt-to-equity ratio, interest coverage ratio, profitability, and liquidity.
Economic Environment: Macro conditions, inflation rates, currency stability, and economic growth.
Political Stability: For sovereign ratings, political risk, governance, and regulatory frameworks are crucial.
Industry Analysis: Sectoral trends, competition, and market dynamics.
Management Quality: Corporate governance, strategy, and operational competence.
The resulting rating is expressed as a letter grade. For example, S&P uses AAA (highest quality) to D (default), with intermediate grades like AA+, BBB-, etc. Moody’s uses a numeric system combined with letters (e.g., A1, Baa3).
Global Influence of Rating Agencies
Credit rating agencies have a profound impact on global finance:
Capital Flow Direction: Sovereign ratings influence foreign investment, with higher-rated countries attracting more capital.
Interest Rates and Borrowing Costs: Ratings directly affect yields on bonds and the cost of capital.
Financial Market Stability: Ratings changes can trigger large-scale portfolio reallocations, influencing stock and bond markets worldwide.
Emerging Markets: Agencies heavily affect emerging economies, where a downgrade can sharply increase debt servicing costs and reduce investor confidence.
Criticism and Controversies
Despite their significance, rating agencies have faced substantial criticism:
Conflict of Interest: Agencies are paid by the issuers they rate, creating potential bias. For example, during the 2008 financial crisis, they rated many subprime mortgage-backed securities as AAA, later revealed to be extremely risky.
Procyclicality: Ratings can amplify financial cycles. Downgrades during crises may force asset sales, worsening liquidity problems.
Opaque Methodologies: The complexity and lack of transparency in rating models, especially for structured finance products, make it difficult for external stakeholders to assess validity.
Regulatory Overreliance: Banks and investors often rely heavily on ratings for compliance, sometimes ignoring independent analysis, which can exacerbate financial instability.
Market Concentration: The dominance of the Big Three limits competition, potentially reducing innovation and accuracy in risk assessment.
Reforms and Modern Trends
In response to criticism, rating agencies have evolved:
Increased Transparency: Agencies now publish methodologies, criteria, and assumptions used in ratings.
Regulatory Oversight: Post-2008 reforms, such as the Dodd-Frank Act in the U.S. and EU regulation, increased oversight to reduce conflicts of interest.
Emergence of Alternatives: New players like DBRS Morningstar, Scope Ratings, and China Chengxin provide alternatives to the Big Three.
Integration of ESG Factors: Many agencies now incorporate environmental, social, and governance (ESG) metrics, reflecting long-term sustainability risks.
Technology and Big Data: Advanced analytics, machine learning, and real-time data improve predictive accuracy for ratings.
Regional and Global Perspectives
United States: The U.S. remains the center of rating agency operations, with S&P, Moody’s, and Fitch headquartered there. U.S. ratings influence global capital markets due to the dollar’s reserve currency status.
Europe: European regulators have attempted to encourage competition, with agencies like Scope Ratings (Germany) and Creditreform Rating gaining traction.
Asia: Emerging economies like China, India, and Japan have local agencies (e.g., China Chengxin, CRISIL, Japan Credit Rating Agency) to supplement international ratings.
Global Coordination: International bodies like the International Organization of Securities Commissions (IOSCO) set principles for credit rating agencies to enhance reliability and transparency globally.
Conclusion
World finance rating agencies play a critical role in shaping global financial markets. Their ratings guide investor behavior, influence borrowing costs, and contribute to market efficiency. However, their dominance and occasional lapses in judgment highlight the need for careful oversight, transparency, and the integration of alternative perspectives. The evolution toward ESG considerations, technological adoption, and regional diversification suggests that rating agencies will continue to adapt to the complex demands of modern global finance.
While their influence is undeniable, investors and policymakers must balance reliance on ratings with independent analysis and prudent risk management. The interplay between these agencies, global capital markets, and regulatory frameworks ensures that they will remain central players in international finance for decades to come.

TSLA still bullish short termTSLA printed a bullish pendant on the 4H time frame, short term bullish. Most likely touching 434 before going up again. Just my thesis!

Tesla Rejected at Key Breakout — Bullish Structure Still Intact NASDAQ:TSLA just got rejected at a major breakout level, but the bigger picture remains bullish. Price action shows a healthy uptrend with momentum building, suggesting this could just be a pause before continuation. As volume trends higher on dips, it hints that buyers are still active—just waiting for cleaner levels.
📅 With the FOMC coming up, expect potential de-risking or volatility across markets. That could drag TSLA lower short term, but it also opens the door for a cleaner entry near strong support. Watching the $421–$428 range for signs of a bounce or consolidation.
🔽 Trade Plan
Entry Zone: $421 – $428
Take Profit 1: $456
Take Profit 2: $488
Stop Loss: $408
TESLA TO BTC & TOTALThis analysis compares NASDAQ:TSLA performance relative to BINANCE:BTCUSDT .
As you can see, Tesla’s stock is showing a bullish stance against Bitcoin and appears to be at the beginning of its Elliott Wave 3.
This chart delivers Four key messages:
1.Bitcoin is expected to decline while Tesla moves higher
2.Bitcoin is expected to drop while Tesla moves into a range
3.Both are expected to decline, but Tesla is likely to fall less than Bitcoin
4.Both rise, but Tesla gains more.
I’d be happy if you shared your thoughts.
NASDAQ:TSLA
BINANCE:BTCUSDT
CRYPTOCAP:TOTAL
BINANCE:BTCUSD

The IMF and Currency Stabilization in Global Trade1. The Role of the IMF in Currency Stability
The IMF was established in 1944 during the Bretton Woods Conference to oversee the international monetary system and prevent the financial instability that contributed to the Great Depression. One of its key functions is to provide a framework where exchange rates can remain relatively stable. Stable currencies are essential for smooth global trade because fluctuations in exchange rates create uncertainty in import and export prices, impacting businesses, investors, and consumers alike.
By providing economic guidance, financial resources, and policy advice, the IMF helps member countries avoid currency crises, manage their monetary policies effectively, and maintain confidence in their national currencies.
2. Mechanisms of Currency Stabilization
The IMF uses a combination of financial tools, policy advice, and monitoring to stabilize currencies globally:
a. Financial Assistance Programs:
Countries experiencing balance of payments problems or facing a currency crisis can turn to the IMF for loans. These loans are often conditional upon implementing economic reforms that strengthen fiscal discipline, control inflation, and restore investor confidence. By providing temporary financial support, the IMF helps countries prevent devaluation of their currency, stabilize the economy, and protect trade flows. For instance, during the Asian Financial Crisis in 1997-1998, IMF assistance helped countries like South Korea and Thailand stabilize their currencies and restore market confidence.
b. Exchange Rate Surveillance:
The IMF monitors exchange rate policies of its member countries and evaluates whether they are consistent with economic fundamentals. Through its "Article IV Consultations," the IMF assesses macroeconomic policies, currency stability, and external sector performance. When misalignment or excessive volatility is detected, the IMF provides policy recommendations aimed at reducing speculative attacks and maintaining exchange rate stability.
c. Special Drawing Rights (SDRs):
SDRs are international reserve assets created by the IMF to supplement member countries' official reserves. SDRs can be exchanged for freely usable currencies and serve as a buffer during crises. By increasing global liquidity, SDRs help countries maintain currency stability without resorting to abrupt devaluations that could disrupt trade.
d. Technical Assistance and Capacity Building:
Beyond financial support, the IMF provides technical assistance in areas such as monetary policy, exchange rate management, and debt sustainability. By helping countries design better fiscal and monetary frameworks, the IMF enhances the resilience of national currencies against external shocks and speculative attacks.
3. Stabilizing Global Trade Through Currency Support
Currency stability is directly linked to the health of global trade. Stable currencies reduce uncertainty in import and export pricing, lower transaction costs, and attract foreign investment. When a country’s currency is volatile, it can lead to inflation or deflation in the domestic market, making trade agreements difficult to honor. The IMF’s interventions, therefore, play a crucial role in maintaining the predictability necessary for global commerce.
For example, if a developing country faces a sudden currency depreciation, the cost of imported goods rises sharply. This can lead to inflation, reduce purchasing power, and disrupt trade agreements. By providing IMF loans and policy guidance, the country can stabilize its currency, maintain international trade flows, and avoid a domino effect on regional economies.
4. Crisis Prevention and Management
The IMF is also central in crisis prevention. By monitoring global economic trends and exchange rates, the IMF can identify vulnerabilities before they escalate into full-blown currency crises. Early intervention may include policy recommendations, reserve support, or coordinated efforts with other international institutions.
A notable example is the European debt crisis in the early 2010s. Countries like Greece, Portugal, and Ireland received IMF support to stabilize their economies and prevent currency collapses. This intervention helped prevent broader disruption in the eurozone and protected trade relationships with other countries.
5. Promoting Confidence and Investor Trust
Currency stabilization is not only about technical support but also about psychological confidence. Investors and international traders are more likely to engage with a country that demonstrates stability in its currency. The IMF’s oversight and policy interventions signal to global markets that a country is taking steps to manage its monetary system prudently. This confidence reduces speculative attacks on currencies and lowers the risk premium on trade and investment, indirectly promoting a stable environment for global commerce.
6. Challenges in Currency Stabilization
Despite its efforts, the IMF faces challenges in stabilizing currencies:
Global Economic Interconnectedness: Currency crises in one country can quickly spread due to globalized trade and finance. Stabilizing one currency might not be enough if regional contagion occurs.
Domestic Policy Resistance: IMF programs often require austerity measures, monetary tightening, or structural reforms. These policies can be politically unpopular, leading to delays or partial implementation, which may reduce effectiveness.
Speculative Pressure: Even with IMF support, currencies are subject to market speculation, which can create volatility that is difficult to manage purely through policy interventions.
7. IMF’s Evolving Role in a Modern Context
In recent years, the IMF has adapted its role to address new challenges in currency stabilization:
Global Liquidity Support: During the COVID-19 pandemic, the IMF provided unprecedented liquidity support to member countries, allowing them to stabilize their currencies and maintain trade flows.
Debt Sustainability Focus: IMF programs now increasingly consider long-term debt sustainability to prevent future currency crises that might threaten global trade.
Collaboration with Other Institutions: The IMF often works alongside the World Bank, regional development banks, and central banks to coordinate policy responses to currency instability and trade disruptions.
8. Conclusion
In the complex ecosystem of global trade, currency stability is essential. Fluctuating exchange rates can disrupt trade agreements, create inflationary pressures, and deter investment. The IMF serves as a global stabilizer by providing financial assistance, monitoring exchange rates, issuing SDRs, and advising on economic policy. Its interventions not only stabilize individual currencies but also support the broader global trade environment by promoting confidence, predictability, and sustainable economic policies.
While challenges remain, including market speculation, domestic resistance, and regional contagion, the IMF’s role in currency stabilization is critical for the health of the global economy. By continuing to evolve and coordinate with other institutions, the IMF helps ensure that currencies remain reliable mediums of trade, facilitating economic growth, investment, and prosperity worldwide.
tsla will soon make a decision on the daily we are waiting for conformation to new all time highs.
we will either sweep the highs on October 03 and November 03 and spill and create a inverted head and shoulder.
or get a bull break out and never see 450 again
both scenarios are super bullish just need conformation on smaller times to play out and see what kind of candle we get on closing for the week.

TSLA shortLooks like Tesla is grabbing its ATH and then claims the downside liquidity to grab the higher stars afterwards ;) <3
Trade save!

Catching Trends Before They Run — JYL Trend Pro V1.0 BETA 1. What is JYL Trend Pro V1.0 BETA?
JYL Trend Pro is my personal trend‑following strategy built around a proprietary state engine I call JYL Trend.
Instead of staring at raw price bars and guessing “is this a real trend or just noise?”, the script translates price action into a clear sequence of states like:
“GO!” → first confirmation that a potential new long trend is starting
“GREEN LIGHT” → healthy bullish continuation
“BULLISH!” → aggressive momentum phase
“WATCH OUT!” → first warning that bullish conditions might be ending
“RED LIGHT” → sustained bearish pressure
“BEARISH!” → aggressive downside momentum
All of this happens automatically in the background. You don’t need to calculate anything or tweak formulas — you just read the states and trade your playbook.
Screenshot:
1drv.ms
1drv.ms
2. The 3 Modes: Stable / Impulsive / IMP+
JYL Trend Pro V1.0 BETA actually contains three personalities in one strategy.
You can switch between them with a single input depending on your style and market conditions.
🧊 2.1 Stable – “Let the trend breathe”
Stable mode is built for traders who prefer cleaner, slower signals:
Focus on the first strong trend confirmation (first “BULLISH!” or “BEARISH!” segment)
Avoids over‑trading inside choppy ranges
Takes partial exits when the trend starts weakening
Fully closes when the color flips (bullish → bearish or vice versa)
This is the “I don’t want to click too much, just ride the move and manage risk” profile.
⚡ 2.2 Impulsive – “Hit the gas when momentum appears”
Impulsive mode is more aggressive:
Allows earlier entries when the trend starts to accelerate
Adds to positions when new strong segments appear
Uses quick “fast exits” when the trend loses steam
Still keeps a safety net: color‑flip exits to avoid being stuck on the wrong side
If Stable is your cruise control, Impulsive is you manually stepping on the gas when you see an opportunity.
🚀 2.3 IMP+ – “Advanced scaling & risk logic on top of Impulsive”
IMP+ takes Impulsive logic and adds an advanced layer of:
Configurable early entries in strong moves (for traders who want a bit more “front‑running” of trends)
Smart adds inside the continuation zone
-After the BULLISH! / BEARISH! impulse, IMP+ looks for a specific type of continuation candle to add
-If you added early, it will skip the later add to avoid over‑leveraging the same move
Dynamic partial exits after big segments
-Scales out more as the move stretches, so you lock in profit without killing the entire trend
Open‑to‑open exhaustion exits
-After a strong trend leg (BULLISH! or BEARISH!), if the next candle opens too close to the previous one (configurable packages), IMP+ can treat it as exhaustion / hesitation and close the position — before the big reversal happens
In short: IMP+ is for traders who want the most “tactical” behavior — early entries, structured scaling, and more nuanced exit logic — while still being rules‑based, not discretionary.
3. How I Personally Use It
Everyone’s risk tolerance and timeframe are different, but here’s how I like to combine the modes:
On higher timeframes (4H / Daily):
→ I usually prefer Stable to catch the big swings and avoid noise.
On intraday momentum names:
→ I lean toward Impulsive or IMP+ to enter earlier and scale more actively.
When markets are clearly trending:
→ IMP+ is my “all tools unlocked” mode: early entries, adds after strong legs, and dynamic profit taking.
The trade direction filter lets me choose:
Only LONG
Only SHORT
Or both directions (for indices / futures / FX etc.)
That makes it flexible for different instruments and market regimes.
4. What this strategy is not
To keep this idea honest & within TradingView’s rules:
It is not a holy grail
It does not guarantee profit
Backtests do not equal future performance
You still need position sizing, risk management, and a plan
JYL Trend Pro is simply a framework that:
Structures entries (initial + adds)
Structures exits (partial + full)
Gives you consistent rules instead of emotional decisions
5. How to try it
This is the JYL Trend Pro V1.0 BETA version.
The strategy is available on TradingView as a protected / invite‑only script.
If you’d like to:
See how the different modes (Stable / Impulsive / IMP+) behave on your favorite tickers
Study the entry / add / reduce / exit logic on historical moves
Or just explore a different way to visualize trend sequences (“GO! / GREEN LIGHT / BULLISH! / WATCH OUT! / RED LIGHT / BEARISH!”)
👉 Check my profile for the script and more details.
If this idea helps you or gives you inspiration, I’d really appreciate a like, comment, or follow — it tells me to keep sharing more tools and improvements.
Trade safe & test everything before going live. 🙏

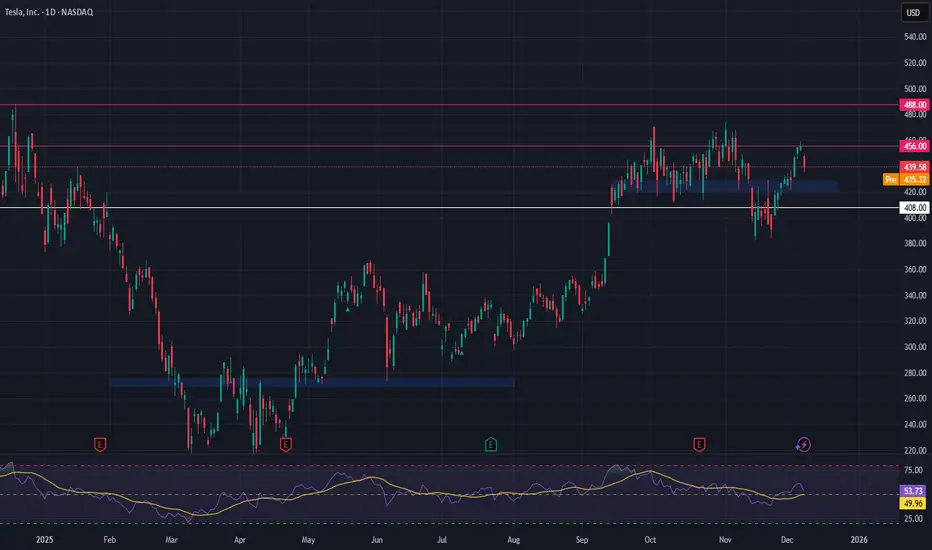
TSLA — [2D] WEEK 49 TREND REPORT | 12/04/2025TSLA — WEEK 49 TREND REPORT | 12/04/2025
Ticker: NASDAQ:TSLA
Timeframe: 2D
This is a reactive structural classification of TSLA based on the weekly chart as of this timestamp. Price conditions are evaluated as they stand — nothing here is predictive or forward-assumptive.
⸻
1) Current Trend Condition [ Numbers to Watch ]
Current Price @ 447.66$
• Trend Duration : +7 Days (Bullish)
• Trend Reversal Level ( Bearish ): 418.70$
• Trend Reversal Level ( Bearish Confirmation ): 428.42$
• Pullback Support : 413.70$
• Correction Support : 354.94$
⸻
2) Structure Health
• Retracement Phase:
Uptrend (operating above 78.6%)
• Position Status:
Healthy (price above both structural layers)
⸻
3) Temperature :
Warming Phase
⸻
4) Momentum :
Bullish
⸻
Author’s Note
UPWARD STRUCTURAL ALIGNMENT
This mark reflects a point where market behavior supported the continuation of the existing upward direction. It does not imply forecasting or targets — it simply notes where strength became observable within the current trend. Its meaning holds only while price continues to respect the broader structural levels that define the trend.
⸻
Methodology Overview
This classification framework evaluates directional conditions using internal trend-interpretation logic that references price behavior relative to its structural layers. These relationships are used to identify when price movement aligns with the framework’s criteria for directional phases, transition points, or regime shifts. Visual elements or structural labels reflect these internal interpretations, rather than explicit trading signals or preset indicator crossovers. This framework is observational only and does not imply future outcomes.

TSLA: The Super Lucrative Asset = Teslacmp : 446.74
This is under supply zone but above 417 : No major sellers will be sold their Qty.
according to chart.
Breaker Block above 465 if break and sustain it will be for next 534 Levels
SL : 415
Manage your Risk and Long view

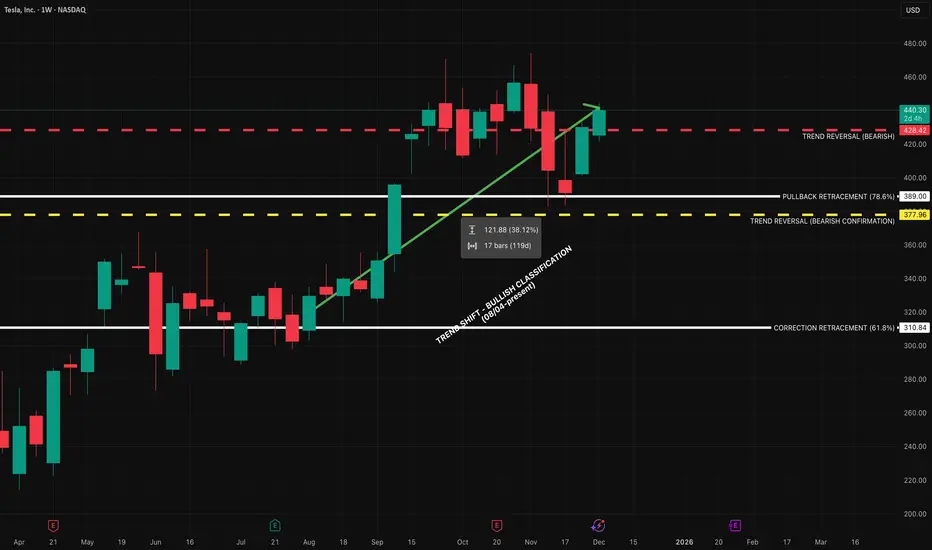
TSLA — WEEK 49 TREND REPORTTSLA — WEEK 49 TREND REPORT
Ticker: NASDAQ:TSLA — 12/03/2025 @ 440.31$
Timeframe: WEEKLY
This is a reactive structural classification of TESLA based on the weekly chart as of this timestamp. Price conditions are evaluated as they stand — nothing here is predictive or forward-assumptive.
⸻
1) Current Trend Condition
• Trend Duration: +17 weeks (Bullish)
• Trend Reversal Level (Bearish): 428.42$
• Trend Reversal Level (Bearish Confirmation): 377.96$
• Pullback Support : 389$
• Correction Support : 310.84$
⸻
2) Structure Health
• Retracement Phase:
Uptrend (operating above 78.6%)
• Position Status:
Healthy (price above both structural layers)
⸻
3) Temperature :
Cooling Phase
⸻
4) Momentum :
Bullish
⸻
5) Market Sentiment (RETAIL TRADER LINE)
Bullish
⸻
Author’s Note
This analysis is fully reactive, not predictive. Market conditions, trend structure, and behavior are classified as they appear in real time. The objective is to identify where directional shifts first occurred, where structural integrity remains intact, and where it would begin to weaken if key levels were breached.
Predictive analysis projects outcomes that do not exist yet. Without price confirmation, prediction is built on baseless assumptions. This framework avoids that entirely by responding only to verified structural changes and live conditions.
The levels shown simply identify where the current trend structure first shifted and where it would begin to lose integrity if breached. Recognizing these boundaries allows for clearer interpretation of market behavior without relying on forward guarantees, speculative projections, or unsupported assumptions.
⸻
Methodology Overview
This classification framework evaluates directional conditions using internal trend-interpretation logic that references price behavior relative to its structural layers. These relationships are used to identify when price movement aligns with the framework’s criteria for directional phases, transition points, or regime shifts. Visual elements or structural labels reflect these internal interpretations, rather than explicit trading signals or preset indicator crossovers. This framework is observational only and does not imply future outcomes.
TSLA Breakout Above $360 Opens Swing Trade SetupTesla broke the $360 resistance four days ago, a level that had been holding price down for the last 120 days. Once broken, price surged quickly toward the $420 zone.
In my view, if we get a chance to buy again near the 370 green support zone, it would be a great swing trade opportunity — especially with the rising trendline still intact.
🔍 Technical Analysis
Current Price: 420.95
360 acted as resistance for months, now flipped to strong support.
Green zone (360–375) aligns with the uptrend, key area to watch for re-entry.
🛡️ Support & SL
🟢 370 zone | SL: 345
🧭 Outlook
Bullish Case: Hold above 370 → continuation toward 450–475.
Bearish Case: Break below 345 → deeper correction.
Bias: Bullish while above 370.
🌍 Fundamental Insight
Valuation: Tesla trades at a relatively high P/E ratio (60–70 range) compared to traditional automakers, reflecting growth expectations rather than current earnings.
Revenue Growth: While margins have compressed due to price cuts, top-line growth remains supported by strong EV demand and expansion in new markets.
Innovation & AI: Tesla’s positioning in AI, autonomous driving, and energy storage continues to attract investor optimism beyond just vehicle sales.
Risks: Competition from other EV makers and margin pressure are key risks investors are watching.
✅ Conclusion
Tesla’s breakout above 360 ended months of pressure. A pullback into the green support zone would be a strong swing entry with trendline confluence. While valuation is stretched versus peers, bullish momentum and growth expectations continue to support the stock.
⚠️ Disclaimer
This analysis is for educational purposes only and does not constitute financial, investment, or trading advice.

TSLA daily bullish divergenceNASDAQ:TSLA is consolidating below all-time high resistance, suggesting a breakout is coming.
Wave (2) appears complete at the High Volume Node support and 0.5 Fibonacci retracement with a bullish structre flip.
📈 Daily RSI hit oversold with bullish divergence
👉 Continued downside has a target of the daily 200EMA $362
Safe trading

Tesla preparing for all time highs?NASDAQ:TSLA Price is ranging below all all-time high, well above the weekly pivot and 200EMA, which is bullish.
Wave © of C appears to be underway into price discovery with a target of $730, the R2 weekly pivot. This is because it has been printing a series of 3 wave structures. Wave B printed a triangle, which is a pattern found before a terminal move, reinforcing the Elliot wave count.
🎯 Terminal target for the business cycle could see prices as high as $730 based on Fibonaci extensions
📈 Weekly RSI is just below overbought so has room to grow
👉 Analysis is invalidated if we close back below wave (B), $280
Safe trading

Tesla bullish momentum points to $435 test this weekCurrent Price: $402.77
Direction: LONG
Confidence Level: 66% (Several traders lean bullish with clear near-term upside targets, but mixed caution at resistance)
Targets:
- T1 = $418
- T2 = $435
Stop Levels:
- S1 = $397
- S2 = $382
**Wisdom of Professional Traders:**
I've been pulling together what multiple professional traders are saying about Tesla, and the collective picture leans bullish in the short term. Several traders noted higher highs, higher lows in recent sessions and upside potential toward $435, even as they warn of possible resistance around $440. That said, the consensus is that as long as price stays above key supports like $397 and the more distant $382 zone, the bulls have control in this current weekly window.
**Key Insights:**
Here's what's driving this view: The price action is showing a clean pattern of higher highs and higher lows, with a possible push into the 430s before facing any major resistance. Traders are watching the 418–420 zone as a near-term waypoint; holding above it keeps the rally intact. The bullish sentiment is supported by patterns like weekly inside bar breaks to the upside and even a potential monthly cup-and-handle if deeper supports hold.
What's interesting is that even the cautious voices—those pointing out the rising wedge formation—still expect a run into the 435 area before any meaningful rejection. This gives the long side some breathing room this week, especially with key support levels unbroken. The fact that several traders identified the same upside levels increases the conviction in these targets.
**Recent Performance:**
Tesla gained nearly 10% recently, rebounding strongly from the lows and moving toward the important 418–420 support-resistance pivot. The stock is up significantly year-to-date—over 80% from certain analyses—with the latest breakout above prior consolidation bringing more buyers in. This rally is happening in line with broader market strength, as the NASDAQ, SPY, and even small caps have put in solid gains.
**Expert Analysis:**
Multiple traders see the near-term chart setup as constructive. A few pointed to a bullish breakout above $412.50 that sets the stage for higher moves, while others emphasized the importance of holding above the 50-day moving average. The $397 level repeatedly comes up as a line in the sand; lose that, and downside targets in the 370s might come back into play, but for now that level is intact. Upside calls cluster around $435, with extensions to $440 if momentum remains.
**News Impact:**
There's no major fresh headline driving Tesla right now, but the background tone includes optimism about potential chip partnerships and continued EV growth. Market-wide, traders are eyeing Fed policy signals from Jerome Powell's recent comments, which could influence momentum stocks like Tesla. With no adverse company-specific news, Tesla rides the tailwinds of a generally bullish tech market.
**Trading Recommendation:**
Given the collective trader analysis, I'd go LONG here with a first target at $418, locking in partial profits there, and a second target at $435. Stops go just below $397 to protect against sharp reversals, with a secondary stop near $382 if volatility spikes. The price pattern and widespread trader agreement on these levels make this a reasonable bullish setup for the week, but watch that 435–440 band closely for possible rejection.
TSLA: Hold or SellHello Traders,
Regarding the technical point of view!
Telsa have been previously overbought. there are two resistances on its way! 1st the dynamic and 2nd the static one!
A triangle shape has been formed!
If you have it right now, I'm more with keeping it!
But you may find more profitable stocks to buy!

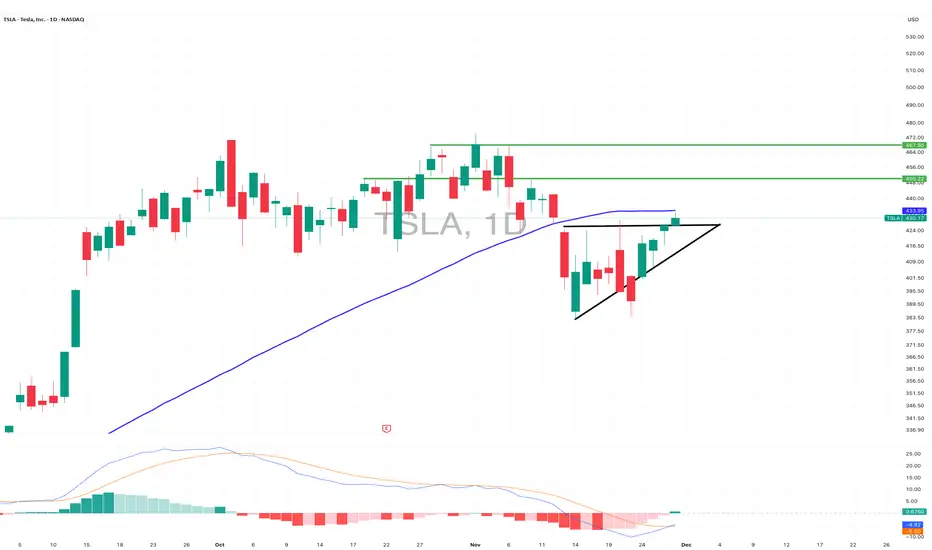
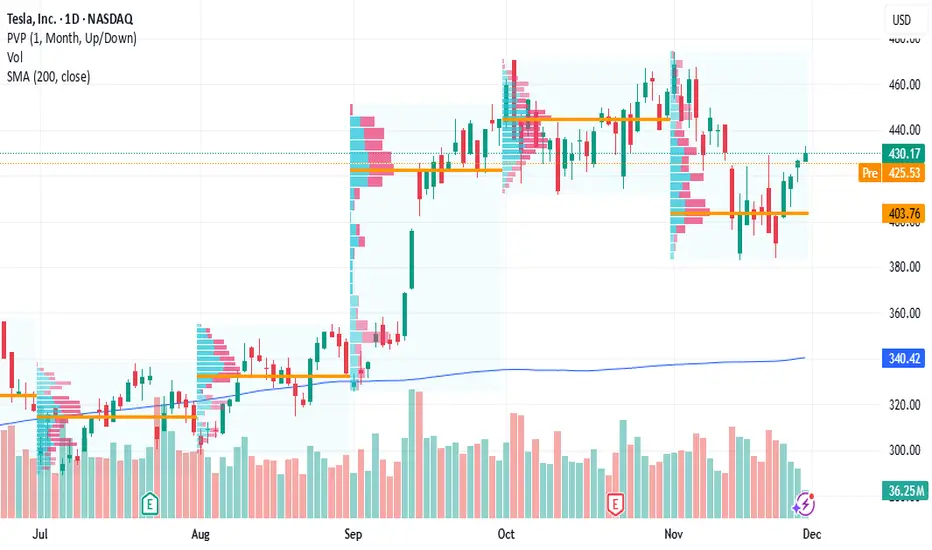
$TSLA Weekend analysis - 30th Nov, 2025NASDAQ:TSLA broke out of its ascending triangle on Friday and is now pushing toward the 50D SMA. It needs to reclaim and close above 433.95 to keep the momentum going.
If it clears that level, the next targets I’m watching are 450.22 and 467.82. The MACD also confirmed a bullish crossover on Friday, which supports the case for more upside.