UPS - Moves into gapThis is the second attempt for UPS to move into the 4/25/23 FGD and while volume is weak it is showing price strength and now a higher high.
Nice RR here of about $2.50:$10.
UPAB trade ideas
UPS-BEARISH SCENARIOLast month, a significant majority of 97% of UPS Teamsters voted in favor of authorizing a strike in the event that the parcel delivery company fails to present a satisfactory contract for the workers. National negotiations between the Teamsters and UPS commenced on April 17.
In the US parcel shipping market, UPS holds a market share of 24% based on parcel volume as of 2022. It is the second-largest player in the market, trailing only behind the US Postal Service, which holds a 32% market share.
The potential strike has the potential to further impact the already underwhelming financial performance of UPS. In the first quarter of 2023, the company reported an operating profit of $2.5 billion, representing a decline of 21.8% compared to the same period in the previous year. The reduced volume can be attributed to a slowdown in US retail sales and weakened demand in Asia.
Risk Disclosure: Trading Foreign Exchange (Forex) and Contracts of Difference (CFD's) carries a high level of risk. By registering and signing up, any client affirms their understanding of their own personal accountability for all transactions performed within their account and recognizes the risks associated with trading on such markets and on such sites. Furthermore, one understands that the company carries zero influence over transactions, markets, and trading signals, therefore, cannot be held liable nor guarantee any profits or losses.

UPS Weekly PutBuy NYSE:UPS Jul-07-23 $172.5 Strike Puts @ 0.14 Limit to Open
A quick short due in 3 days. Cheap entry with huge gain if the volatile drop continues to the downside.

UPS more upsideUPS looks pretty good.
The higher low seems to be confirmed and UPS may be ready for a mark-up phase .
Expecting a strong move in the next weeks.
Entry, stop loss and 2 targets (red lines) are shown on the chart.
Risk - reward ratio : 2,72
Good luck

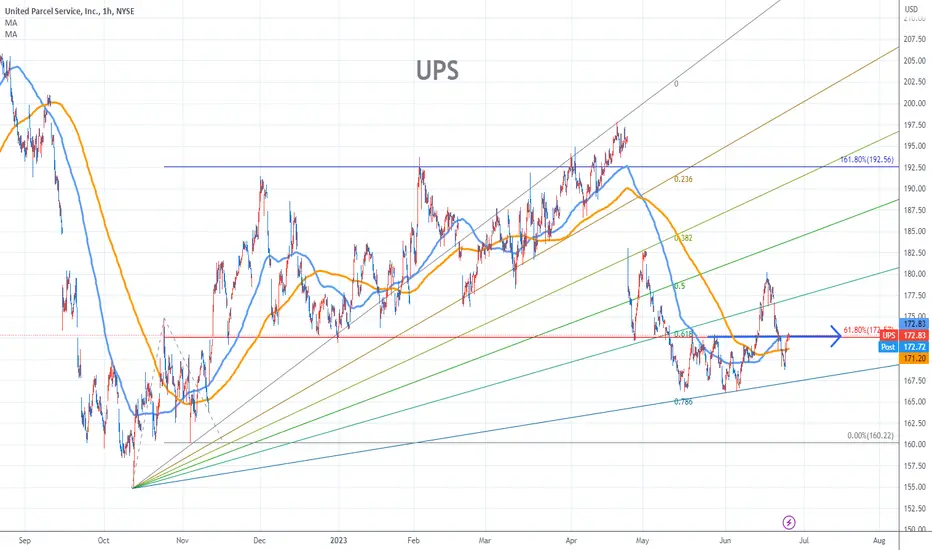
UPS Stock Chart Fibonacci Analysis 062623 Trading Idea
1) Find a FIBO slingshot
2) Check FIBO 61.80% level
3) Entry Point > 173/61.80%
Chart time frame : B
A) 15 min(1W-3M)
B) 1 hr(3M-6M)
C) 4 hr(6M-1year)
D) 1 day(1-3years)
Stock progress : B
A) Keep rising over 61.80% resistance
B) 61.80% resistance
C) Hit the bottom
D) Hit the top
Stocks rise as they rise from support and fall from resistance. Our goal is to find a low support point and enter. It can be referred to as buying at the pullback point. The pullback point can be found with a Fibonacci extension of 61.80%. This is a step to find entry level. 1) Find a triangle (Fibonacci Speed Fan Line) that connects the high (resistance) and low (support) points of the stock in progress, where it is continuously expressed as a Slingshot, 2) and create a Fibonacci extension level for the first rising wave from the start point of slingshot pattern.
When the current price goes over 61.80% level , that can be a good entry point, especially if the SMA 100 and 200 curves are gathered together at 61.80%, it is a very good entry point.
As a great help, tradingview provide these Fibonacci speed fan lines and extension levels with ease. So if you use the Fibonacci fan line, the extension level, and the SMA 100/200 curve well, you can find an entry point for the stock market. At least you have to enter at this low point to avoid trading failure, and if you are skilled at entering this low point, with fibonacci6180 technique, your reading skill to chart will be greatly improved.
If you want to do day trading, please set the time frame to 5 minutes or 15 minutes, and you will see many of the low point of rising stocks.
If want to prefer long term range trading, you can set the time frame to 1 hr or 1 day.
UPS Maco This is my UPS Chart Fib Timed and Fib level with a wedge focus run up and a ellipse accumulation zone focus

UPSSetting this Macro Potential play till AUG 3 I will be looking at what happens till June 29 if we run up till then, then I will be lookin at July 17 Opportunities to catch the next trend. Trying to see if this Diamond Double Curve Setup will play out to the run up potential to 193-195 at the end of this pattern frame. The spike up could come initially so thats something to watch for then a long down drip. THis is my notes not financial advice but if you do like my thoughts drop your boy a boost and cheers. 1LoV3

UPS taking profitsNYSE:UPS is up 2% today. It has hit my expected resistance so I have decided to take profits.
As shown in the 3-day chart, we have good momentum to the upside but the volume oscillator is trending down.
Note this is not bearish by any means, it only suggests that price action may be capped in the near term.
The 3 day chart is presented here based on my own back testing. I have observed that the 1 and 3 day volume tend to give more reliable predictions on trend continuations or reversals.


$UPS feeling bearish to the 140'sAfter putting in a lower high in April this is feeling rather bearish down the 140's or so.

UPSIndustrials look like they want to start rotating up. I like UPS if they do. Testing multiple levels here (AVWAP from c0vid lows, weekly 200 sma, & 1.618 extension. Watching for this to go red to green on the weekly to begin making its way back to AVWAP from ATH.

$UPS Q2 Earnings: Key Levels & Targets 🎯 NYSE:UPS gears up for Q2 earnings tomorrow morning 📈:
Completed a 2-2-2u reversal after bouncing off the 9EMA on Friday 📊
Near a wedge breakout & bearish gap fill 🧐
🔺 Calls: Trigger over $197.55
Targets: $199.55, HKEX:201 , HKEX:205
🔻 Puts: Trigger under $194.70
Targets: $192.87, $188.70, $186.55
💸 Market expects a HKEX:9 move. Trade wisely!

#UPS earnings tue With all the ups and downs of the market USP been in a nice up trend but looking at the charts USP setting up for nice bear flag with a bearish divergence forming on daily and weekly chart so im be keeping a close eye on it


Could be breaking outStill holding the trend and sitting right around the breakout level. Some interesting closes the last two days where buying has pushed it towards the high of each day. Not looking for much on this one, if it gets to 200 I'm content.

UPSit has a very weird chart which I can not estimate how it could make. UPS had a strong uptrend. whiting parallel channels it can hold an uptrend and fall below MA's. I think it could move in either direction the key levels are 50MA or the lower trendline should be broken.

UPS due for a move to the upsideI think UPS is setting up for a run to $193. Looking for a gap and go tomorrow just before ex dividend date.

Trading Idea 031: UPSMarket Conditions:
- bullish trend
- possible false breakout / reversal
- bullish sentiment in the market
Key Level and Lines:
- $191.60 resistance
Trading Ideas:
- go short using a false breakout / reversal signal from the resistance
- go long if the price moves above the resistance and consolidates above for a few days.

UPS has respected well defined channelConsumer retail spending starting to roll over and gas prices increasing again going to impact UPS bottom line

$UPS still stalking the $200PL and about to Golden cross on day$UPS still stalking the $200PL and about to Golden cross on day
Finished inside on Friday.
Calls over $192.25
Target $193.70, $197.53
Puts under $187.25
Target $186.13, $184.98

$UPS with a Bullish outlook following its earnings #Stocks The PEAD projected a Bullish outlook for $UPS after a Positive Under reaction following its earnings release placing the stock in drift A with an expected accuracy of 60%.

UPS United Parcel Service INC COM CL B If you build it, they will come.
200 price per share right around the corner.
Timing is important for those entering recent in hopes of supreme rocket launch.
-stikstockitslive

$UPS back above the 200 d EMA $UPS is back above the 200EMA, if breaks out of this Bull pennant, it's going to $190
