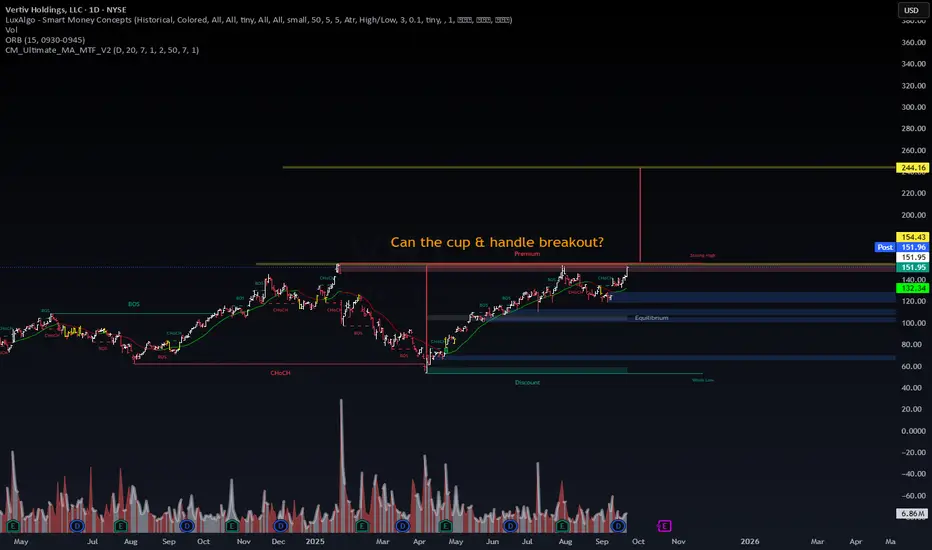
$VRT — Cup & Handle at Prior Highs: Is a Breakout Next?Thesis: Price is pressing the 154.4–155 strong-high. I’m tracking a daily close >154.5 and a retest-hold for confirmation. Measured move points to 165 → 178–180 → 200 if momentum + volume align (Bulkowski, 2012; Edwards et al., 2013).
Key Catalysts (near-term relevance):
AI data-center CAPEX tailwind accelerating: Nvidia’s new multiyear push (up to $100B tied to AI data-center build-out) underscores demand for power/cooling infrastructure suppliers like Vertiv. (Reuters, 2025; Business Insider, 2025; WSJ, 2025).
Direct NVIDIA alignment: Vertiv highlighted 800 VDC power architecture and collaboration across the NVIDIA ecosystem—positioned for next-gen AI factories. (Vertiv IR, 2025a; NVIDIA blog, 2025).
Fundamentals still supportive: Q2’25 showed strong orders/sales/EPS with raised FY guidance, confirming secular demand. (Vertiv IR, 2025b).
Vertiv
Capital return signal: Ongoing dividend (declared Sept 3, 2025) signals confidence. (Simply Wall St., 2025).
Next checkpoint: Earnings window late Oct ’25 (est.)—sizing/hedging prudent into that event. (TipRanks; MarketChameleon).
Levels & Plan:
Trigger/confirmation: Daily close >154.5 or intraday retest-hold of 154.5 as support.
Stops: Below handle low (<148) or ATR(14)×1.5 below entry (whichever is farther).
Targets: 165 / 178–180 / 200 with scale-outs (30/40/30).
If reject: Watch 138–132 demand for a higher-low setup.
Options alt: 30–60 DTE 160/180 call debit spread or 145/135 bull put spread (defined risk).
Risk Notes: Index beta (QQQ/SOX), earnings gap risk, and headline sensitivity from AI-CAPEX cycles; avoid low-volume breakouts.
Not financial advice. For education only. Manage risk.
Trade ideas
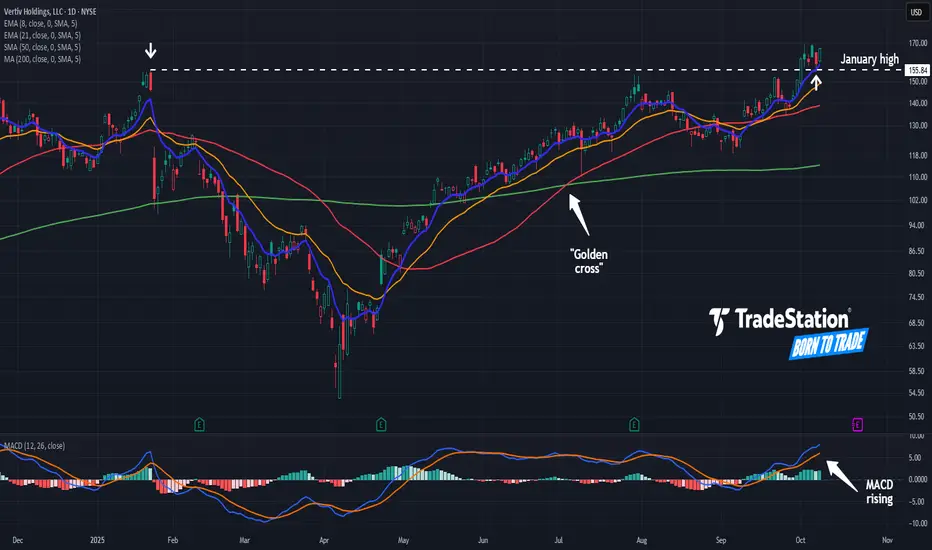
Vertiv May Have Broken OutVertiv was an early leader in the AI rally, and now it may be breaking out again.
The first pattern on today’s chart is the January high of $155.84. The provider of data-center power and cooling products began October by breaking above that level. This week, it pulled back to test it. Has old resistance become new support?
Second, prices wavered on either side of their 50-day simple moving average (SMA) for a few months and could now be accelerating from that line.
Third, the 50-day SMA had a “golden cross” above the 200-day SMA in July. That may suggest its longer-term uptrend is resuming.
Next, the 8-day exponential moving average (EMA) is above the 21-day EMA. MACD is also rising. Those signals may indicate the short-term trend has grown bullish again.
TradeStation has, for decades, advanced the trading industry, providing access to stocks, options and futures. If you're born to trade, we could be for you. See our Overview for more.
Past performance, whether actual or indicated by historical tests of strategies, is no guarantee of future performance or success. There is a possibility that you may sustain a loss equal to or greater than your entire investment regardless of which asset class you trade (equities, options or futures); therefore, you should not invest or risk money that you cannot afford to lose. Online trading is not suitable for all investors. View the document titled Characteristics and Risks of Standardized Options at www.TradeStation.com . Before trading any asset class, customers must read the relevant risk disclosure statements on www.TradeStation.com . System access and trade placement and execution may be delayed or fail due to market volatility and volume, quote delays, system and software errors, Internet traffic, outages and other factors.
Securities and futures trading is offered to self-directed customers by TradeStation Securities, Inc., a broker-dealer registered with the Securities and Exchange Commission and a futures commission merchant licensed with the Commodity Futures Trading Commission). TradeStation Securities is a member of the Financial Industry Regulatory Authority, the National Futures Association, and a number of exchanges.
TradeStation Securities, Inc. and TradeStation Technologies, Inc. are each wholly owned subsidiaries of TradeStation Group, Inc., both operating, and providing products and services, under the TradeStation brand and trademark. When applying for, or purchasing, accounts, subscriptions, products and services, it is important that you know which company you will be dealing with. Visit www.TradeStation.com for further important information explaining what this means.
Vertiv - Strong bullish trend ahead NYSE:VRT has seen a restoration of upside after breaking out of the flag and tested multiple times on the bearish gap zone between 125-146 range. Rounding v-shaped bottom will also propel the stock further into upsside. Momentum wise, the stock's upside momentum remain healthy ranging from short to long-term. Volume remain healthy and is likely to carry on forward. Near-term target will be at 198 and long-term target at 300.00

Inverse H&S forming on VRT? Am I hallucinating, or does that not look like the most clear-cut inverse H&S pattern?
Full disclosure, I have no idea whether this will breakout at all. I was just cruising through some data center-related stocks and spotted this interesting formation.
Leaving this here to look back on in a few month's time to see how it played out.
Let me know if you think this is what I think it is too, or not.

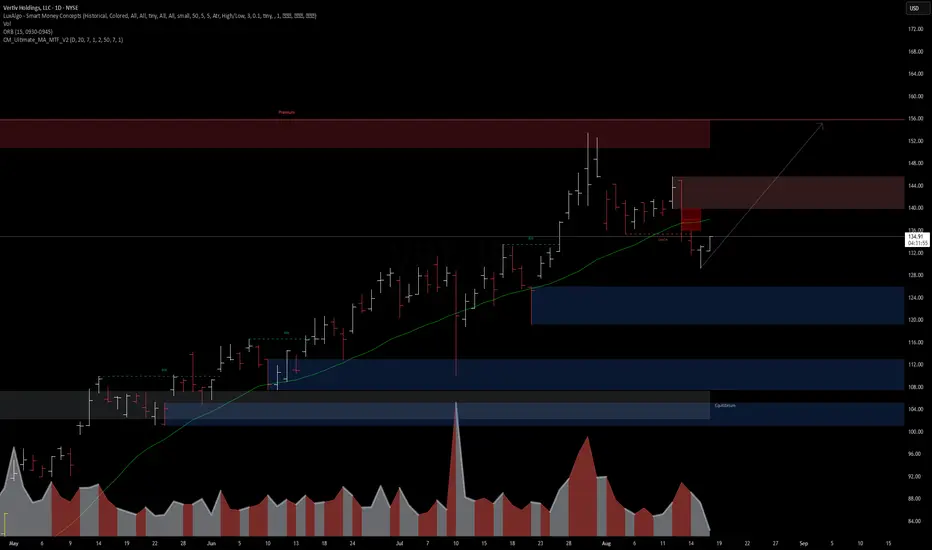
VRT – Demand Zone Defense & Trend Break📊 VRT – Demand Zone Defense & Trend Break
The past four sessions tested conviction. After a clean downtrend break, NYSE:VRT tapped into the $125–127 demand zone and attracted strong buyer aggression — exactly where liquidity confluence aligned with the 0.702 retracement.
🔹 Market Structure
Downtrend Broken → sellers lost momentum.
Demand Zone Defended → clear evidence of institutional buying.
Volume Spike → confirms aggressive absorption at lows.
Liquidity Roadmap → upside targets remain intact.
🔹 Levels in Play
Demand: $125–127 (must hold).
Supply / First Target: $137–142.
Final Liquidity Sweep: $150–157 swing high.
Invalidation: Close below $123 (opens path to $115).
✅ Bias
Short-to-mid term remains bullish, provided buyers defend the $125 zone. If successful, the path of least resistance is a liquidity run into the premium zone above $150.
💡 Lesson: Liquidity leaves footprints — when demand absorbs supply at key retracement levels, it pays to respect structure, not fear volatility.
#VRT #Liquidity #Trading #SmartMoney #Stocks #WaverVanir

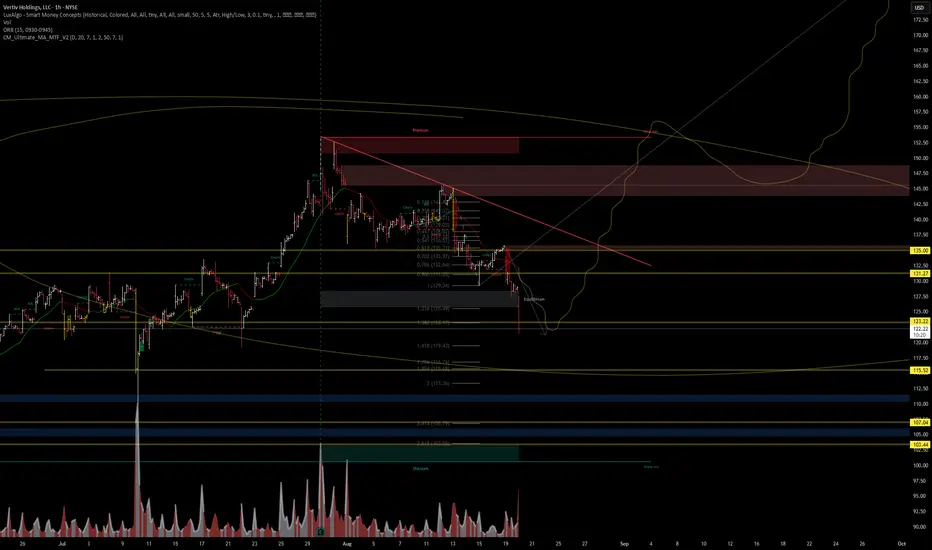
3rd Day in the trade, trusting AI to manage the risk🔎 Chart Structure & Key Zones
Trend Context: The chart shows a recent breakdown from an uptrend. Price rejected near ~$145–148 (supply zone), confirming resistance.
Current Price: ~$122, trading under key moving averages and inside a corrective structure.
Volume Profile: Distribution spikes near the recent highs suggest heavy selling pressure → distribution phase.
Fibonacci Levels:
123.6% extension near $125.5 already tested/rejected.
161.8% extension around $119.5 aligns with support demand zone.
2.0+ extensions target $103–106 (major equilibrium zone).
🟦 Demand / Support Zones
$119–116 → short-term demand, potential bounce area.
$106–104 → equilibrium zone, key higher-timeframe support.
$87–78 → deep retracement zone, only if market collapses.
🟥 Supply / Resistance Zones
$132–136 → immediate supply. Price must break and hold above this to shift bullish.
$144–148 → strong macro supply zone; multiple rejections here.
$152–156+ → premium liquidity, likely next major target if breakout succeeds.
📈 Trade Scenarios
Bullish Case (high-risk reversal play)
Watch for bounce at $119–116 with strong volume confirmation.
Break above $132 → opens path to $144–148 retest.
Long-term upside possible to $160+ if reclaim and hold above supply.
Bearish Case (continuation)
Failure to hold $119 → quick flush into $111 → $106 zone.
If $103 breaks, expect acceleration toward $87–78 (FIB 3.618–4.236 extensions).
⚖️ Risk Management
If long → place stops under $116.
If short → place stops above $132 (or scale risk if above $136).
✅ Summary:
VRT is currently in corrective mode, leaning bearish short-term.
$119–116 is the first battleground for bulls. If lost, deeper retrace into $106–104 equilibrium is highly probable.
Long-term bullish case resumes only if price reclaims and holds above $132–136 supply zone.
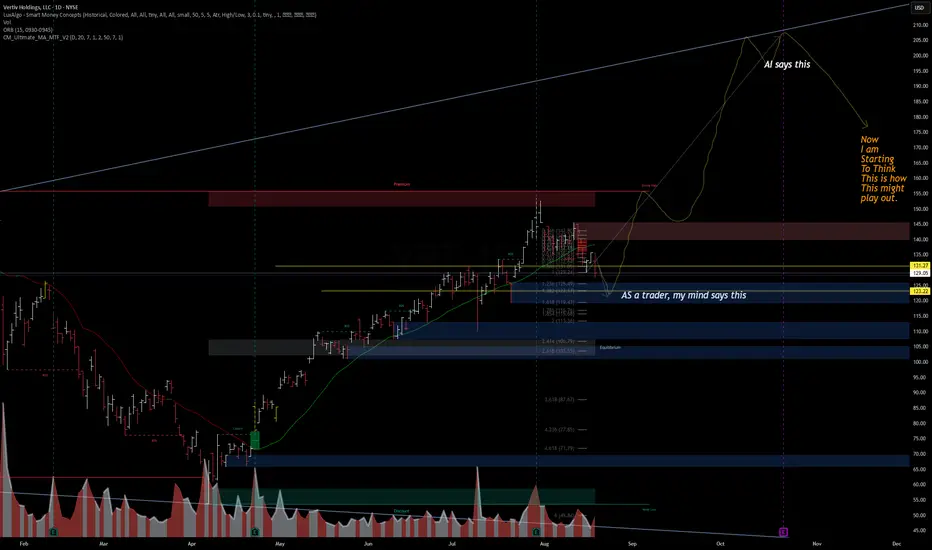
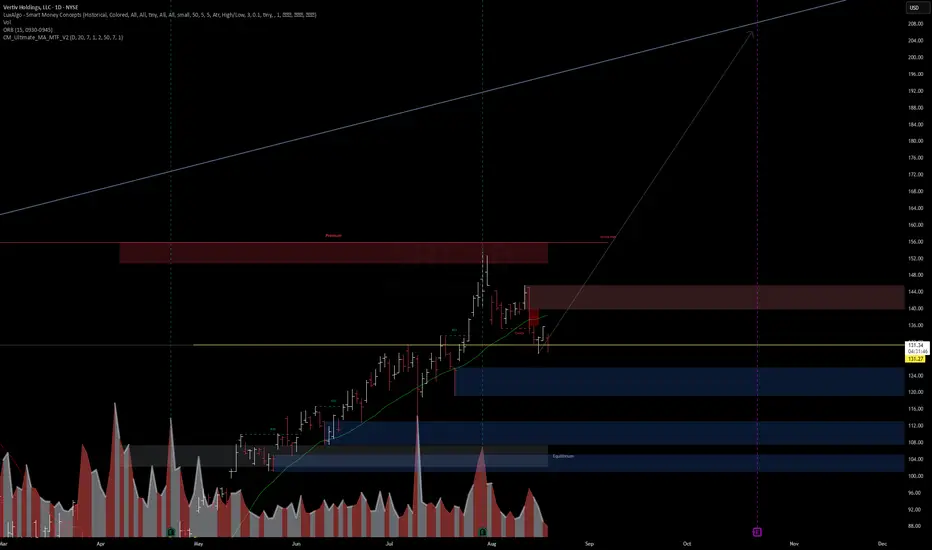
$VRT | Vertiv Holdings – AI vs Trader Mindset📊 NYSE:VRT | Vertiv Holdings – AI vs Trader Mindset
Interesting divergence here:
AI projection (yellow path) suggests a continuation higher toward $200+ before a macro pullback.
Trader’s view (blue zones) highlights liquidity gaps and possible retracement targets at $123, $116, and $106 before any bigger rally.
🔎 Chart Breakdown
Premium zone rejection near $140+
Equilibrium sits closer to $106
If downside liquidity sweep plays out, retracement into $116–123 demand zones could reload the uptrend.
⚖️ Key Levels
Bullish continuation: $145 → $175 → $200+
Bearish retracement: $123 → $116 → $106
💡 Sometimes AI favors trend continuation, while traders look for liquidity sweeps first. This setup could play out as a blend of both.
2nd Day in the trade. VRTPositions down, had an unexpected sell-off from the market. Position taken for a month, until next ER, will observe the price, volume, and participants. AI models have not changed, see you at $150
VRT (Vertiv Holdings) – Institutional Forecast & Smart Mone🔮 Forecast & DSS Outlook
Current Price: $134.77
Institutional Forecast Model: STRONG BUY
Target: $154.53 (+14.7% upside in 30 days)
Confidence Interval: $131.71 – $161.46
Expected Return: +14.66%
Risk/Reward: 1.74 : 1
Model Agreement: 7 of 9 bullish
📈 Our DSS (Decision Support System) signals accumulation continuation with elevated volatility (90%). Model suggests positioning 25% capital allocation with defined risk.
🏦 Market Structure (Smart Money Concepts)
Premium Zone (Supply): $148–156 (profit-taking zone)
Discount Zones (Demand):
Major demand: $124
Deeper liquidity: $112 & $104 equilibrium
Trend Bias: Price respected the 137 EMA and rebounded off a discount level.
Projection: Short-term bullish leg toward $145–148 liquidity, then expansion toward institutional $154–156 target.
⚖️ Risk Management
Entry: $134.7
Stop Loss: $123.4 (8.4% risk)
Target 1: $137.5 (partial scale)
Target 2: $154.5 (full institutional target)
Max Drawdown Tolerance: 46% (backtest metric)
Sharpe Ratio: 1.12
🧭 Trading Plan (WaverVanir Protocol)
Accumulation confirmed → Reclaim of mid-structure with liquidity sweep.
Execution Window → Align with volume confirmation & ORB breakout.
Exit Strategy → Scale partials at $137–145 zone, hold core to $154–156.
📌 Summary
VRT is setting up for continuation toward premium levels. Institutional forecast aligns with smart money structure—providing both statistical and structural confluence. Volatility is high, so scaling in is advised.
✅ Signal Score: 7.5 / 10
⚡ Bias: Bullish – Long Accumulation
📆 Time Horizon: 30 Days
#VRT #Stocks #TradingView #WaverVanir #SmartMoney #AITrading #InstitutionalFlow
VRT : Long Position Vertiv Holdings is trading above the 50 and 200-period moving averages.
It has overcome the resistances one by one without being exposed to a very high IV.
It has started to draw a cup.
However, it is much better to focus on the big gap rather than the cup formation because with good chances it can encounter a big resistance there.
Targeting the 50-period ema and the 0.5 level of the short-term Fibonacci retracement levels as a stop point gives us the opportunity to try trading at a not bad risk/reward ratio.
With a small position size or small portfolio percent :
Risk/Reward Ratio : 2.54
Stop-Loss : 103.77
Take-Profit : 145.32

Vertiv Holdings: Powering the AI ProgressionNYSE:VRT NASDAQ:NVDA NASDAQ:META NYSE:ETN NASDAQ:CEG
While investors are engaged in a race “identify the next major microchip manufacturer”, a quieter opportunity is emerging at the crossroads of artificial intelligence (AI), infrastructure, and long-term demand. Vertiv Holdings (VRT), a company often overlooked amidst the hype, could be the backbone of the AI boom. In a recent NVIDIA earnings call, CEO Jensen Huang dropped a pretty interesting statement: the biggest hurdle for future data centers isn’t chips or regulations- it’s power.
The Power and Cooling Conundrum
AI is no longer some futuristic bet, it’s more like the engine of modern enterprise. Data centers, once powered by modest CPUs, now rely on NVIDIA’s superior GPUs to handle complex, multi-task workloads at scale. But this shift has exposed a critical bottleneck: energy supply can’t keep up with compute demand. Think of NVIDIA’s GPUs as high-performance supercars-powerful yet fuel-hungry, requiring premium infrastructure to operate efficiently. Data centers face challenges like high carbon footprints, downtime risks (recall the $10 billion CrowdStrike outage from a faulty software update), and intense cooling needs due to soaring rack densities.
And this is where Vertiv (VRT) comes in. This company designs and delivers essential infrastructure-uninterruptible power supplies, power distribution units, and advanced cooling solutions (both air and liquid-based)-tailored for data centers, telecom, and industrial clients. If NVIDIA’s GPUs are the brain, Vertiv is the heart and lungs, ensuring these systems run without melting down. The cooling challenge, in particular, is a game-changer. With rack densities exceeding 300kW, traditional air cooling falls short, making Vertiv’s liquid cooling innovations a must-have.
A Strategic Edge: The META-Nuclear Play
The AI race isn’t just about chips- it’s also about the infrastructure to sustain them. A telling sign came from META, which recently inked a nuclear power deal with Constellation Energy. Why nuclear? It offers low-carbon, reliable, 24/7 power with massive capacity-ideal for AI’s energy demands. Yet, Constellation’s deal didn’t address cooling, a gap Vertiv fills perfectly. This collaboration points a broader trend: companies are scrambling to solve power and thermal management issues, and Vertiv is at the forefront of this effort.
Financial Momentum and Analyst Backing
Vertiv’s financials back up its strategic importance. In Q1 2025, the company reported $2.04 billion in revenue-a 25% year-over-year jump, surpassing the $1.94 billion estimate. Adjusted earnings per share hit $0.64, beating the $0.615 forecast. Its backlog soared 50% to $6 billion, signaling robust future demand, while free cash flow margins doubled to 13% ($1.48 billion). Earnings before interest, taxes, depreciation, and amortization grew 22.8%, with a manageable 1.6x leverage ratio and over $350 million annually invested in R&D-much of it for cutting-edge liquid cooling.
Looking ahead, analysts project revenue of $10.76 billion by 2026, with EPS growth of 22% annually and free cash flow reaching $1.6 billion, even as capital expenditure rises to 18.2%. The sentiment is overwhelmingly bullish: Bank of America, Goldman Sachs, and Barclays maintain "Buy" ratings, with target prices ranging from $115 to $130. Oppenheimer, a top analyst, recently raised its target to $132, while 75% of analysts recommend buying, with only 6.3% suggesting a hold or sell.
Outpacing the Market
Since its liberation date of April 2, Vertiv has outperformed its peers. While the S&P 500 grew 11.48%, NVIDIA rose 45.62%, Eaton Corporation 30.26%, and Constellation Energy 48.3%, Vertiv surged 69.8%. Its focus on data centers and AI-driven infrastructure is reflected in this outperformance, with even uranium ETFs (42.41%) tied to nuclear power trends being outpaced. Vertiv’s faster free cash flow growth and direct exposure to AI’s power and cooling bottlenecks give it an edge over cyclical chipmakers.
A Long-Term Buy?
The thesis is simple: AI is already here and it will stay, and the infrastructure supporting it-especially cooling- is important factor in ensuring the rotation of the gears. Vertiv is quietly becoming, lets say, the NVIDIA of infrastructure, leveraging strong financials, analyst confidence, and a critical role in solving AI’s energy crisis. At a current price of $127.37, with targets up to $132 within the next 18 months (and potentially higher over 2-3 years), VRT could be a pretty confident long-term buy. Unlike chipmakers facing valuation risks, Vertiv may offer stable growth tied to an urgent need, which one is growing today.
Disclosure: I currently hold no positions in VRT, NVIDIA, Eaton, or Constellation Energy.
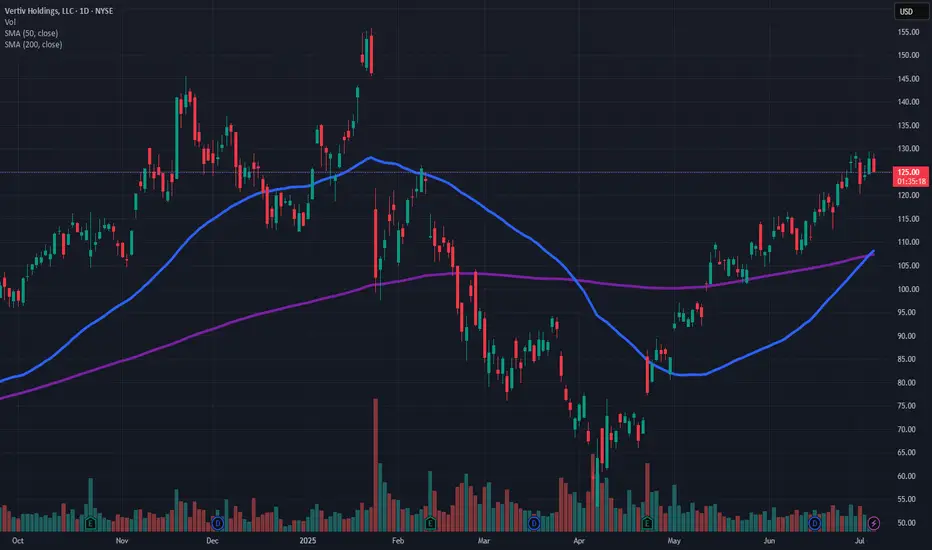
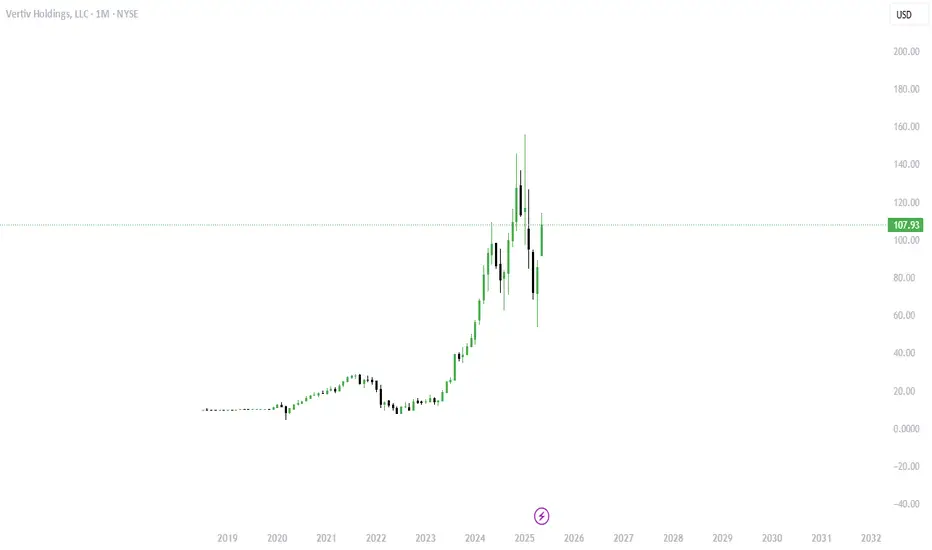
The Picks and Shovels of The AI Boom1. Six-Month Price Trend
Long-term uptrend: Over the past 6 months, VRT has climbed from ~ $54 to a recent high around $155—deep into a clear bullish channel
Pullbacks vs higher lows: Corrections have consistently bounced off rising trend-lines and key moving averages (50 & 200-day), reinforcing the uptrend .
🛡️ 2. Key Support & Resistance Levels
Support: Near the 50‑day SMA (~$108–$110)—previous pullbacks found strong buying interest here.
Fibonacci retracement zone: Around $117–$117.5 (61.8% from the 52-week high) also has historical support .
Resistance:
Around $155–$156, the recent 52-week high marks the first major hurdle.
Interim resistance around $128–$130, aligning with various pivot point R‑levels and the 6-month consolidation top .
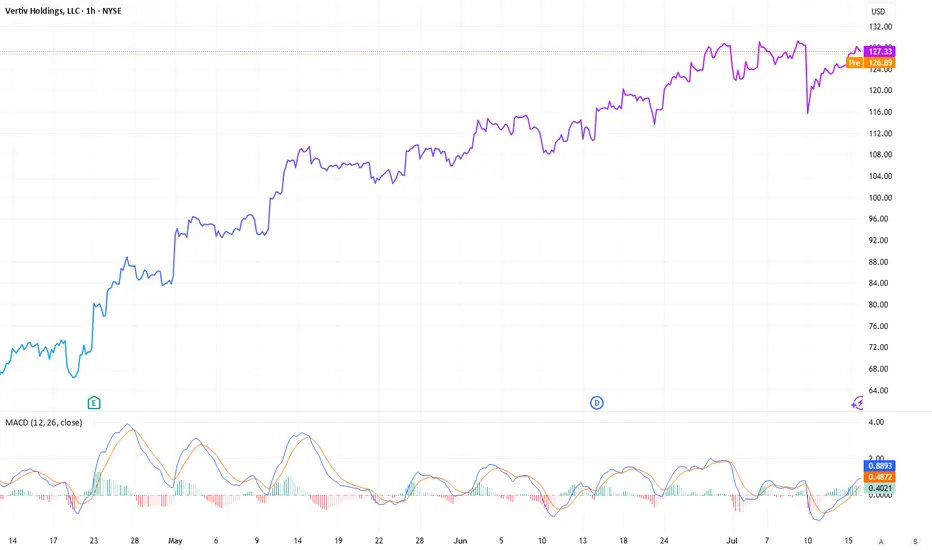
📊 3. Momentum Indicators
Financhill & ChartMill: RSI ~66.6–69.7, moving toward overbought but not extreme
Barchart shorter: 62–64—still in bullish-neutral range
MACD
Positive MACD reading: Values range from ~0.11 to +5.7, indicating bullish crossover momentum
Histogram and signal remain supportive of upward momentum.
Stochastics & ADX
Stochastics: Hovering in the 80s (overbought) but often remains elevated during strong uptrends
ADX ~28–29: Indicates a strong trending stock
⚖️ 4. Overall Technical View
Moving averages: 8, 20, 50, 100, 200‑day (both SMA & EMA) are all positively sloped with price above each—bullish alignment across all timeframes
MACD & RSI: Bullish, with MACD above signal line and RSI in bullish territory (though nearing overbought).
Chart patterns: Active long positions, cup‑and‑handle formations, and break above 50 & 200‑day EMAs suggest continuation setups.
✅ 5. Conclusion
VRT is firmly in a bullish technical regime:
Uptrend confirmed by price structure and moving averages.
Momentum indicators (MACD, RSI, ADX) support continued upside.
Key levels to watch: Support near $117–$110, Resistance around $130 and $155.
Recommendation: The setup favours bullish continuation. That said, RSI nearing overbought (~70) suggests caution—look for short-term consolidation or mild pullbacks before new entries.
Final stance: Bullish, with an eye on consolidation phases for optimal timing.
🧭 6. Watch Points
Break above $155 on strong volume = next leg higher.
Drop below 50‑day SMA (~$108) with weakness could signal deeper retracement.
RSI sustaining above 70 may lead to short-term kicker higher—or signal an overextension pause.
Is VRT (they make cooling systems for data centers) a buy ?Vertiv Holdings Co. (NYSE: VRT) is a leading provider of critical digital infrastructure and continuity solutions, particularly for data centers. Here's an overview of its recent performance, valuation, and potential challenges:
Financial Performance
Q1 2025 Highlights:
-Revenue: $2.04 billion, a 24% increase year-over-year.
-Adjusted EPS: $0.64, up ~49% from Q1 2024.
-Adjusted Operating Profit: $337 million, a 35% increase from Q1 2024.
-Book-to-Bill Ratio: Approximately 1.4x, indicating strong demand.
-Backlog: Increased to $7.9 billion, up ~10% from the end of Q4 2024.
Full-Year 2024 Performance:
-Revenue: $8.012 billion, a 16.74% increase from 2023.
-Net Income: $495 million, a 7.74% increase from 2023.
Valuation Metrics
-Market Capitalization: Approximately $41.13 billion.
-Price-to-Earnings (P/E) Ratio: Approximately 61.7x, which is higher than the industry average, indicating a premium valuation.
-Enterprise Value/Revenue: 5.1x.
-Enterprise Value/EBITDA: 24.5x.
-PEG Ratio: 2.7x, suggesting that the stock may be overvalued relative to its earnings growth.
Potential Challenges
-Valuation Concerns: The high P/E ratio suggests that the stock is priced for perfection. Any shortfall in performance could lead to a significant price correction.
-Supply Chain Risks: Vertiv faces operational risks related to its supply chain and manufacturing processes. Disruptions could impact production and increase costs.
-Regulatory and Legal Challenges: The company is exposed to various legal and regulatory risks that could impact its operations and financial performance.
-Market Dynamics: A slowdown in data center equipment purchases, particularly from major clients like Microsoft and Google, could affect Vertiv's order volumes in the near term.
Disclaimer: This analysis is for informational and educational purposes only and does not constitute financial advice, investment recommendation, or an offer to buy or sell any securities. Stock prices, valuations, and performance metrics are subject to change and may be outdated. Always conduct your own due diligence and consult with a licensed financial advisor before making investment decisions. The information presented may contain inaccuracies and should not be solely relied upon for financial decisions.
$NYSE:VRT (Vertiv Holdings, LLC) Bullish Outlook NYSE:VRT
Company Overview:
Cooling for Data Centers. One of the very few.
Vertiv Holdings Co. engages in the design, manufacture, and service of critical digital infrastructure technology that powers, cools, deploys, secures and maintains electronics that process, store and transmit data. It also offers power management products, thermal management products, integrated rack systems, modular solutions, and management systems for monitoring and controlling digital infrastructure.
Vertiv Group Corp., established in 2016 after its acquisition by Platinum Equity, stands as a global leader in data center cooling solutions. Offering precision cooling systems and thermal management solutions since its inception, Vertiv has garnered recognition for its innovative technologies and commitment to sustainability. Recent developments, especially in energy-efficient cooling systems, underscore its dedication to meeting evolving market needs. Vertiv's focus on innovation, reliability, and customer satisfaction has solidified its position as a top choice for organizations seeking cutting-edge cooling solutions for their critical digital infrastructure.
Other companies may partake in Data Center Cooling but Vertiv (VST) specializes in it. That's the big difference. It's not a side piece of the business to make additional $. That's what makes it special. That's why I mentioned there really isn't many companies that specialize in this critical area especially with the growth of data centers.
Technicals:
Positive Divergence
RSI at 36 and as of now crossing RSI-Based MA
Descending Wedge (breaking out as of 3/12)
Downside: A lot of resistance to break through as in it 's under ALL Moving Average's.
Overall NYSE:VRT continues to to increase every single quarter and is in a very strong market of data centers as these will continue to increase and need cooling. Institutions own 83.77%
VRT Snapshot
VRT Growth

VRT: Sell ideaOn VRT as you can see on the chart we would have a hight probability to have a downtrend if and only if we have the breakout with force the vwap and the support line by the sellers.

2/20/25 - $vrt - lil ST punt only2/20/25 :: VROCKSTAR :: NYSE:VRT
lil ST punt only
- not cheap, not expensive, but reasonable
- dr. warren says... better to pay reasonable px for great asset than great px for mediocre asset
- nvda results r on deck and mkt probably remains choppy until then, but my industry sources confirming this result will be smash and deekseek fear has more or less passed... demand still booked
- what this means is the whole complex runs (unclear on TPU types, avgo, googl, etc. but probably still bid)
- i think the NASDAQ:MU move earlier this week also a snippet view into the nvda results
- so here's a name 3% fcf yields, growing high DD... sub 1.5x peg. unique DC niche
- to be clear, i was trading this tape today but i'm not really enjoying it. i do like action, but lately it feels like i'm a fat chick on a treadmill and "not yet seeing results" but standing in place. i guess that deserves a pat on the back... if i can reach... it.
- all jokes aside
- looking for some ST punts. i am still playing NASDAQ:NICE from today's insane dump. took most of the ST action off here already with some nice gains, but apparently i'm back in this thing for the LT. valuation is just too obvious and it's good money
- here's an interesting one. vrt.
whatchu think anon? let's pay for weekend steaks?
V

vertiv is important now
vertiv is very important price
1 support daily 200 ma
2 key price line
if break key price ( 108 ) expect to 61
based on harmonic theory

Vertiv Holdings in Recovery.It will take a lot to beat that gap down, but trading is nothing without risk.

$VRTV VertIv Holdings - Bullish SetupAlert set above the 0.382 fib $119.76 and Gap @$121.48.
Pullback LOI $115.00.

1/27/25 - $vrt - i bot $110, trade1/27/25 :: VROCKSTAR :: NYSE:VRT
i bot $110, trade
- trading buy
- overbaked cake
- nvda complex reeling bc deepseek (i will write more on this later - but i've added to my 2027 NVDA calls after taking a bit off the table earlier last week)
- this one seems a bit like a reversion trade/ but growth phenom. any reversal in semis sees this go +5-10% ez. (also nancy)
- and if not, we can find a better LT parking spot w more nuanced size and expires.
V

Even If It Pops.... ITS BOUND TO DROP!Now, I am wishy washy with when I use technical and fundamental's to back my thesis up.
This is a technical thesis that has nothing to so with the company, but everything to do with human behavior.
Over stretched and weaknesses are showing, TAKE ADVANTAGE.
Lastly, you may looks at my ideas and thing "he has no clue what he is talking about", my arrows and lines are not meant to be 100% accurate, but more of a general movement that the stocks are most likely to follow.
Pay the most attention to my levels of volume.

VRT breakout out for a move higherNYSE:VRT with a strong break above the AVWAP from its all time high and a test in proximity to the prior base. If interested, I have more detail on this and other names in the substack in the links in my profile.

VERTIV for your long/medium term PortfolioThis Stock is interesting at the marked area which is a 1.618 extention of the first corrective move and a 0.618 retracement of the last strong push up.
i d like to see a crossing of the decending trendline o fthe correction and afterwards a crossing of the sma(89) to the upside.
let' s see what happens.
good luck all!
