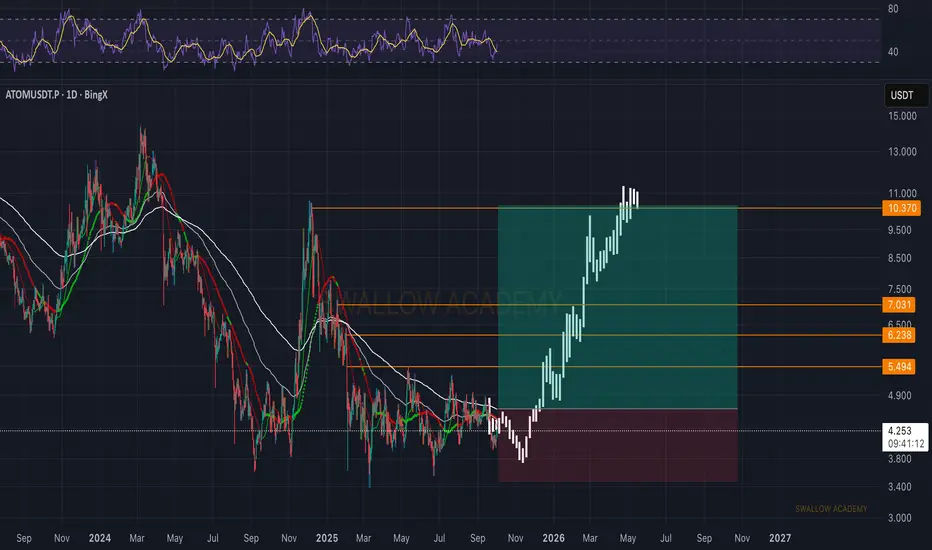
Cosmos (ATOM): Looking For Break of 200EMA | Bullish GameplanATOM has shown a strong bounce from the bottom zone and buyers have taken full control, driving the price back above key EMAs and straight into recovery mode. Current focus is the $10.3 resistance zone, which will act as the main level to watch. A clean breakout here could open the way toward higher
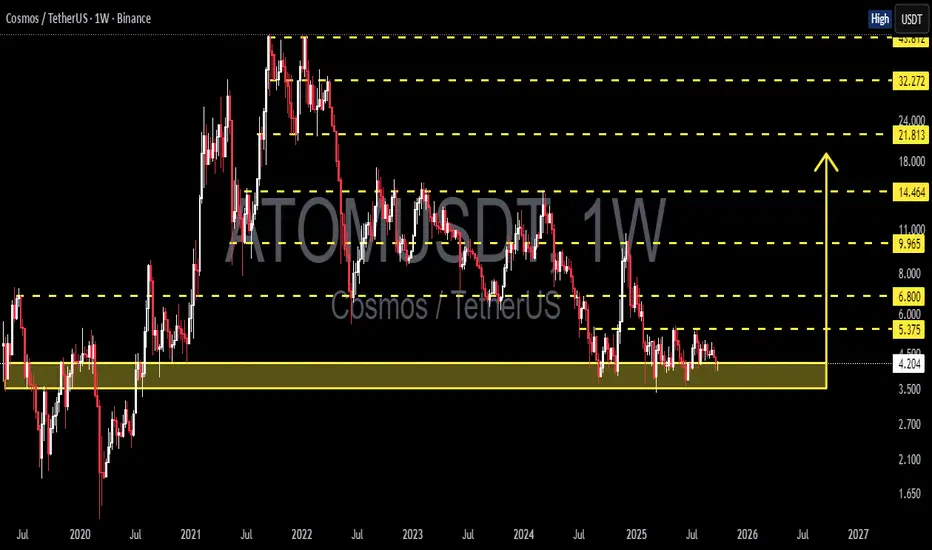
ATOMUSDT — Holding at Historical Support, Rebound or Break Down?📊 Overview
The Cosmos (ATOM/USDT) Weekly chart is at a decisive point. Price is currently sitting inside the historical support zone around 3.5 – 4.5 USDT, which has acted as a strong defense since 2020. Every time ATOM touched this area, a rebound followed — but this time the repeated tests sugges
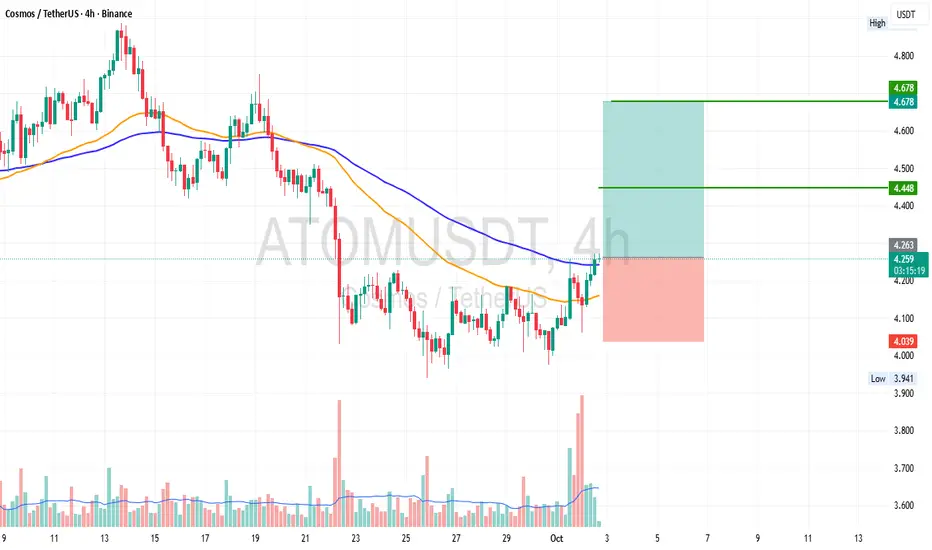
ATOM 4H Trade ideaATOM is going good. We can execute long trade here. Entry & Exit points are given on chart. NFA DYOR
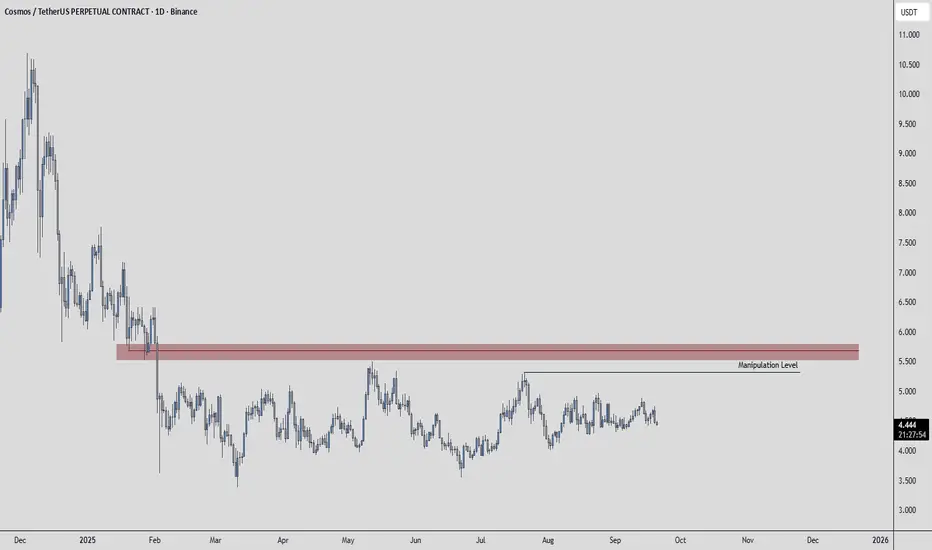
ATOMUSDT | Short From Red Box, Long-Term SetupResistance Zone
ATOMUSDT is facing heavy resistance at the red box, making it an attractive short entry zone. Structure shows sellers remain active here, and momentum hasn’t shifted yet.
Risk Management
For risk management, I’m anchoring this setup with a stop at 7.9. That level is key — a breako
atomusdtThe atom currency is moving in a triangle and a break from above could move to $5.6 and $6.3. The targets are clear.

Cosmos (ATOM): About To Go Parabolic | Bullish AFThe key zone on ATOM is that 200 and 100 EMA, which, upon seeing broken, we should see a good upside movement!
More in-depth info is in the video—enjoy!
Swallow Academy

ATOM to $16With breaking the resistance at 6.20, I think Atom can go to the very strong resistance area between $14 and $18, with the 61% Fibonacci level from top to bottom at $16.60

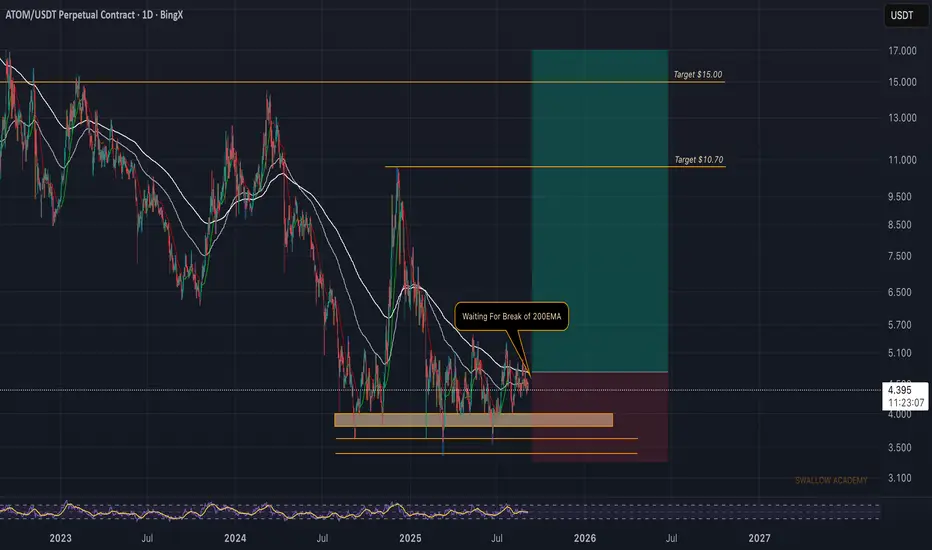
Cosmos (ATOM): Waiting For Break of 200EMA | BULLISH AFATOM is pressing against the 200EMA, which has been acting as dynamic resistance for a while. A clean break above this level would be the confirmation we’re waiting for to target higher zones.
The structure remains intact above the support zone, and as long as buyers defend this level, we’re positi
ATOM USDTATOM USDT
SPOT
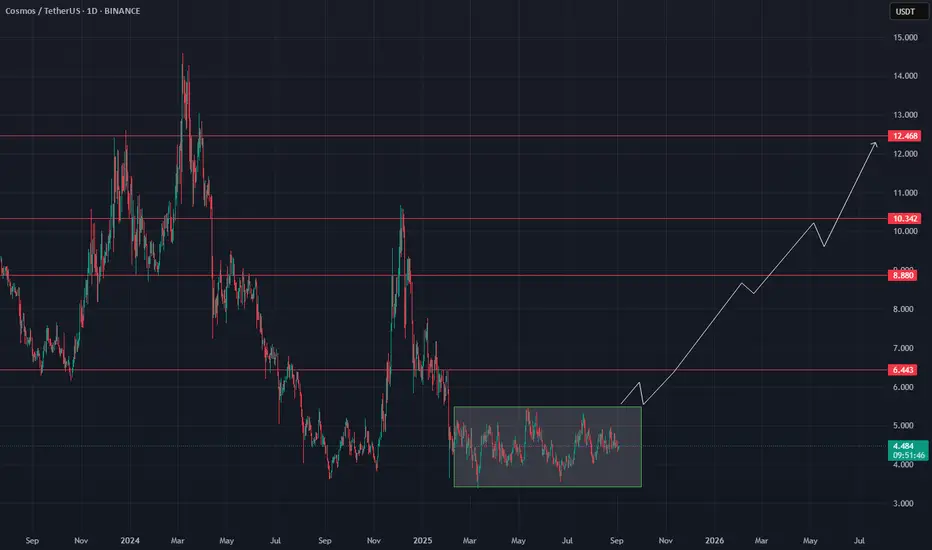
On the daily timeframe, after breaking above the green box, this altcoin has the potential to move toward the resistance levels highlighted by the red lines.
Personally, I’ve entered a small long position on this altcoin while strictly applying risk management.
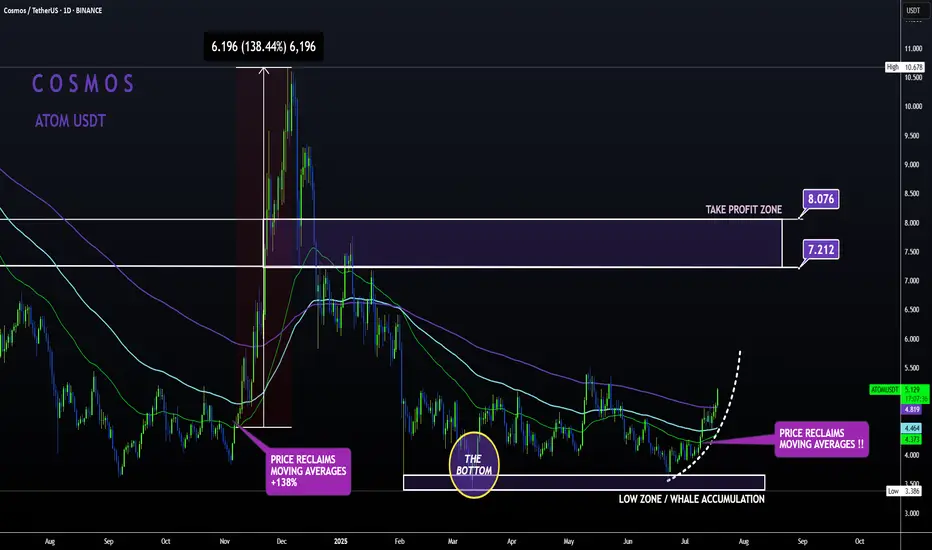
ATOM Sleeping GIANT ALT | Moving Averages BULLISH like NOV24'ATOM is slowly but surely making a turn up towards the first Take Profit point.
From the bottom, Cosmos has already increased a whopping 52% , with even more room to grow:
In my previous update, the 4 was still bearish when looking at trend lines and moving averages.
However, this has flipped
See all ideas
Summarizing what the indicators are suggesting.
Oscillators
Neutral
SellBuy
Strong sellStrong buy
Strong sellSellNeutralBuyStrong buy
Oscillators
Neutral
SellBuy
Strong sellStrong buy
Strong sellSellNeutralBuyStrong buy
Summary
Neutral
SellBuy
Strong sellStrong buy
Strong sellSellNeutralBuyStrong buy
Summary
Neutral
SellBuy
Strong sellStrong buy
Strong sellSellNeutralBuyStrong buy
Summary
Neutral
SellBuy
Strong sellStrong buy
Strong sellSellNeutralBuyStrong buy
Moving Averages
Neutral
SellBuy
Strong sellStrong buy
Strong sellSellNeutralBuyStrong buy
Moving Averages
Neutral
SellBuy
Strong sellStrong buy
Strong sellSellNeutralBuyStrong buy
Displays a symbol's price movements over previous years to identify recurring trends.