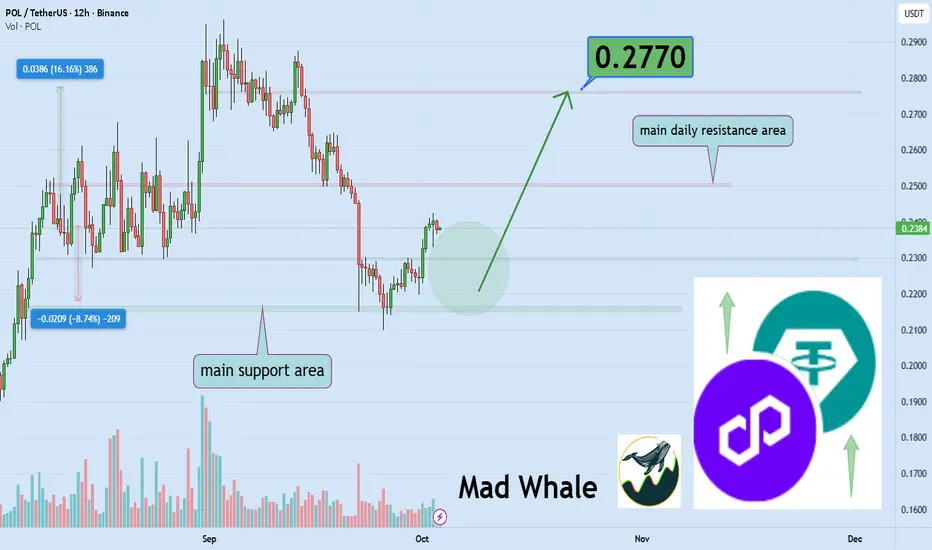
Polygon Poised To Rally 16% Toward $0.2770 TargetHello✌️
Let’s analyze Polygon’s price action both technically and fundamentally 📈.
🔍Fundamental analysis:
Polygon (POL) is upgrading to process more transactions faster and cheaper. Heimdall v2 already cut finality to ~5s, and the Rio upgrade targets 5,000 TPS. Past upgrades often pushed POL
POL - Confluence at Demand: Longs on the Trendline?POL BINANCE:POLUSDT has been overall bullish on the daily, moving inside a rising channel. Price is sliding toward the demand zone at $0.19–$0.21, right where the channel’s lower trendline comes in, clean confluence for dip buyers.
This zone is key 🔑. If bulls defend it, I’ll look for a rotation

Polygon (POL): Loading For Breakout | Good Momentum After 200EMAPolygon has formed a decent bullish trend here where price is looking for a potential breakout, which would give us a very good opportunity for a long position so that's what we are looking for.
A break of 200 EMA is where buyers should establish dominance and then lead the price to upper zones!

Polygon (POL): Reached Good Turning Point Before Pump | BullishPOL can give us a good turning point from here if buyers manage to get that market structure break on smaller timeframes.
More in-depth info is in the video—enjoy!
Swallow Academy

POL LONG IDEAim taking a long position here for BINANCE:POLUSDT.P
This is risky so I'm not responsible for your losses. DYR
Entry SL TP are visible on the chart.

POLUSDT Technical Analysis (2H Timeframe)Let’s see what opportunities the market might give us to enter! ⚡️
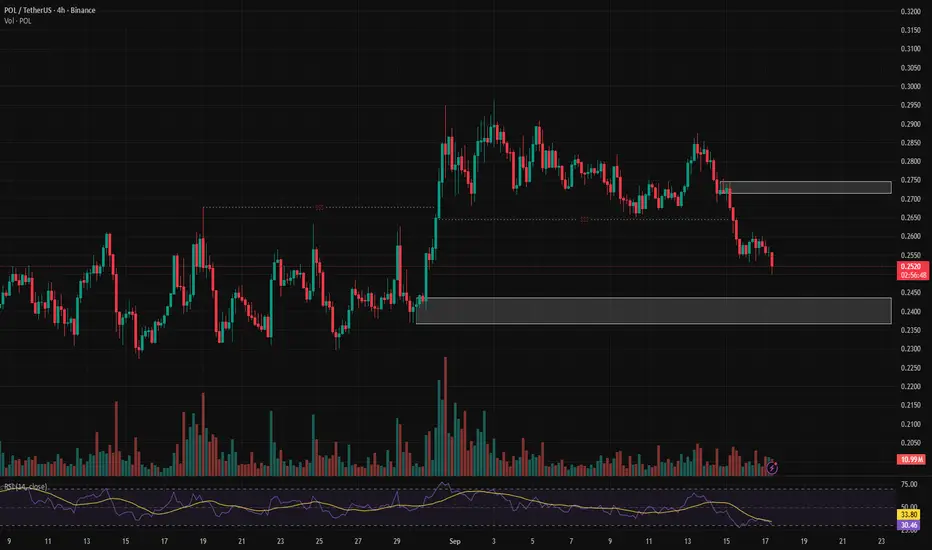
The price of POL has been in a steady downtrend after rejecting the 0.275–0.280 resistance zone. It is now approaching a strong demand zone around 0.238–0.245, where buyers have previously shown significant interest. The RSI is near
POL USDT LONG TRADE SETUPNew Trade Setup: POL-USDT
LONG
Entry: 0.2590 or CMP
Target: TP1: 0.2686, TP2: 0.2783, TP3: 0.2879, TP4: 0.2975
Stoploss: 0.2288
Leverage: 1X
Technical Analysis: POL/USDT is taking support from its support area there is high change of short term of trend reversal, we can see up trend in short ter

matic analysis chart for IRANIANHello dear people of Iran, all the details are clear in the film, and I said that because it is the first time, there are some shortcomings that you should forgive for your greatness. In short, watch it, enjoy it, like it, if you don't enjoy it, sacrifice your head.

POLYGON is best to Bet for ETHHello everyone,Polygon provides compatibility with EVM (Ethereum), which is a big advantage for developers who want to transfer or use existing code.
is a rival to Solana that assists ETH to make transactions faster and cheaper. this time we will not miss a big opportunity, polygon is also owned by

POL/USDT – LPL SetupPOL/USDT – LPL Setup
Price failed to create a new FVG and instead formed a Low Probability Leg (LPL) on this time-frame.This LPL may act as a discount array for a potential move higher.
🚩 Invalidation: If the Daily FVG breaks with a clear breakaway candle, this setup is void.

See all ideas
Summarizing what the indicators are suggesting.
Oscillators
Neutral
SellBuy
Strong sellStrong buy
Strong sellSellNeutralBuyStrong buy
Oscillators
Neutral
SellBuy
Strong sellStrong buy
Strong sellSellNeutralBuyStrong buy
Summary
Neutral
SellBuy
Strong sellStrong buy
Strong sellSellNeutralBuyStrong buy
Summary
Neutral
SellBuy
Strong sellStrong buy
Strong sellSellNeutralBuyStrong buy
Summary
Neutral
SellBuy
Strong sellStrong buy
Strong sellSellNeutralBuyStrong buy
Moving Averages
Neutral
SellBuy
Strong sellStrong buy
Strong sellSellNeutralBuyStrong buy
Moving Averages
Neutral
SellBuy
Strong sellStrong buy
Strong sellSellNeutralBuyStrong buy
Displays a symbol's price movements over previous years to identify recurring trends.