TAO Swing Long📈 Pair: TAO/USDT
📌 Type: Swing Long Limit Order
⭐️ Confidence Rating: 8/10 (1% risk)
Trade Setup
🔥 Entry — 285.5
🛑 SL — 259
🎯 TP1 — 328.5 (25% out)
🎯 TP2 — 358.9 (25% out)
🎯 TP3 — 419.9 (40% out)
🎯 Final TP — 478.9 (10% runner)
📌 SL → BE at 328.5 (TP1 hit)
📝 Note: This is a swing setup w

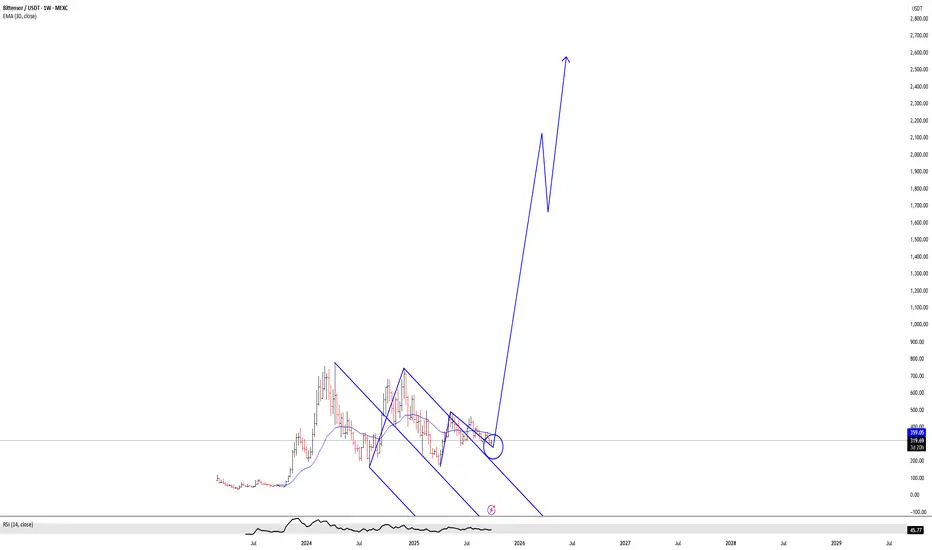
Bull Trap or...Bull Run...If there is somewhat of an alt season and crypto has more juice in it - this should do well - chart looks primed to moon or doom.
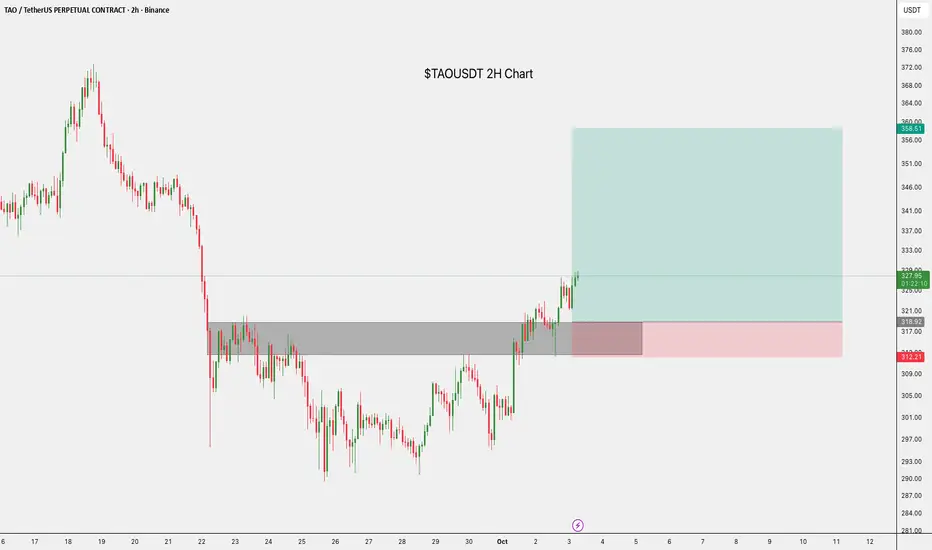
$TAOUSDT.P Trade Setup.$TAO/USDT 2H Trade Setup:
- Entry: CMP
- Stop Loss: $312.21
Target 1: $337.00.
Target 2: $358.61.
Price broke through key resistance, and we’re looking for a push up from this demand zone. Watch volume and structure for confirmation.
DYOR, NFA
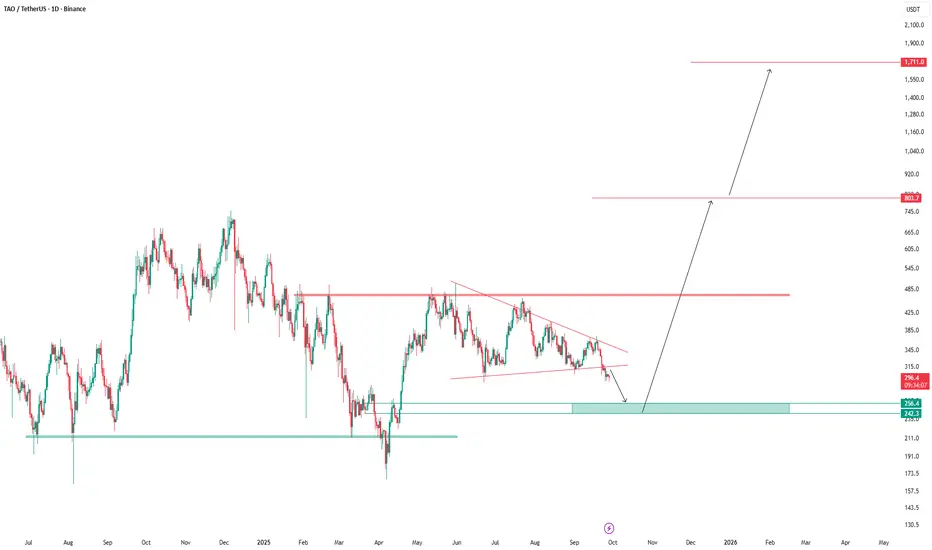
TAOUSDT 1D#TAO is trading within a descending triangle on the daily chart. If it manages to bounce from the support zone, we can expect a potential upward move. However, if the support zone breaks, it may revisit $274.5 and $243.8. In case of a breakout above the triangle resistance, the potential targets are
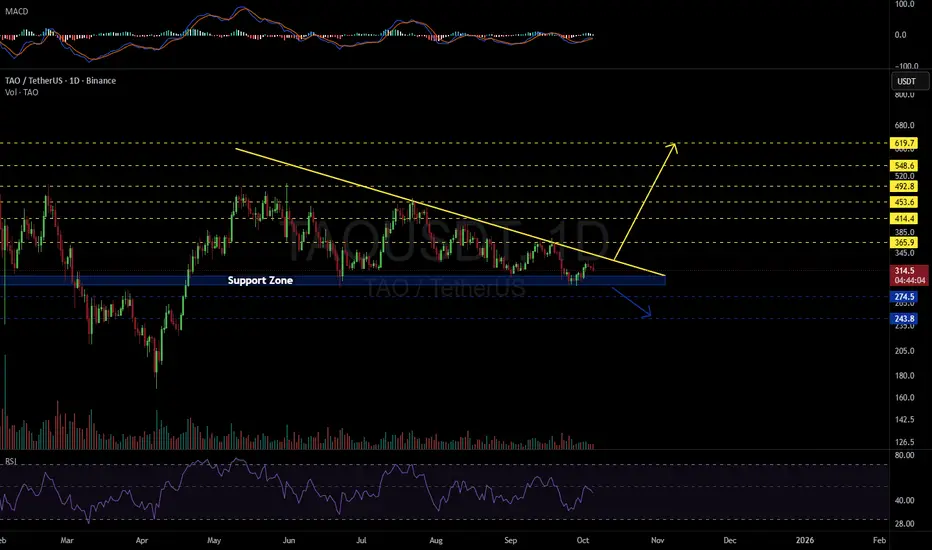
TAO – Descending Triangle at Critical Levels
TAO is consolidating inside a descending triangle, with sellers pressing from above and buyers defending the $256–$242 support zone.
- Resistance: $265–$270
- Support: $242–$256
- Bullish case: Break and close above $270 could trigger a rally toward $800–$1700.
- Bearish risk: Losing $170 supp
TAO - BEARISH WEEKLY VIEW! GETTEX:TAO - Price Analysis 🐸📉
🧭 Structure: attempted daily double bottom, but sellers still in control below former major supports now acting as resistance.
📊 Ichimoku (1D): price and lagging span remain under the cloud → bearish bias intact until a clean reclaim.
🪙 Next key downside: $280–

TAO 4H Analysis - Key Triggers Ahead💀 Hey , how's it going ? Come over here — Satoshi got something for you!
⏰ We’re analyzing TAO on the 4-Hour timeframe.
👀 On the 4-hour timeframe for Bittensor (TAO), we can see that this coin belongs to the AI category on CoinMarketCap and currently holds rank #35. TAO had been moving inside a co

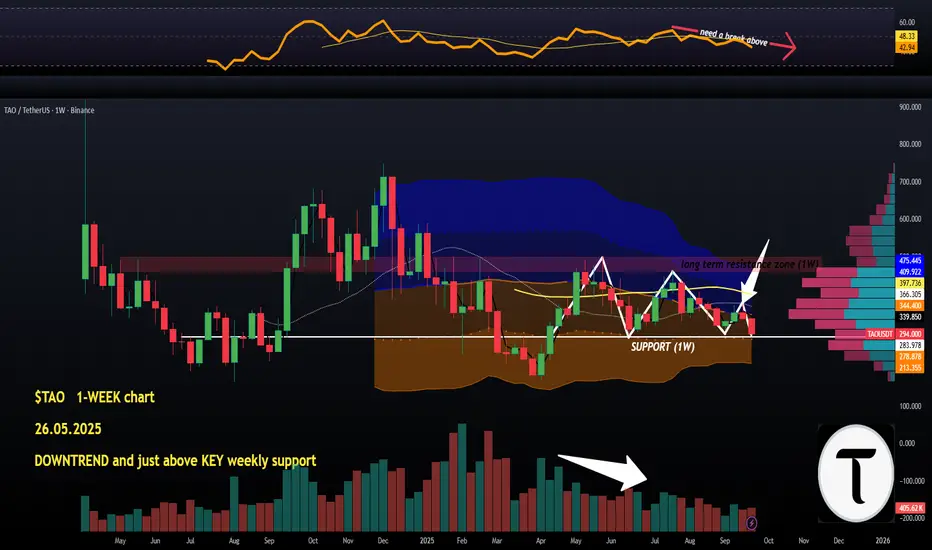
$TAO 1-week chart. DOWNTREND and just above KEY weekly supportGETTEX:TAO deep dive, starting from the fundamental WEEKLY chart and some key info prepared by #Grok as this is a great #AI based project currently around the $3B in marketcap.
The WEEKLY chart is not looking great, we have KEY horizontal support right below but the bounces off this level have bee
VWAP yearly channel GETTEX:TAO anchored VWAP on the yearly session. Tao trending around the Vwap line inside the channel. When it breaks out it will be very violent. Generational entry levels right now in my opinion.

See all ideas
Summarizing what the indicators are suggesting.
Oscillators
Neutral
SellBuy
Strong sellStrong buy
Strong sellSellNeutralBuyStrong buy
Oscillators
Neutral
SellBuy
Strong sellStrong buy
Strong sellSellNeutralBuyStrong buy
Summary
Neutral
SellBuy
Strong sellStrong buy
Strong sellSellNeutralBuyStrong buy
Summary
Neutral
SellBuy
Strong sellStrong buy
Strong sellSellNeutralBuyStrong buy
Summary
Neutral
SellBuy
Strong sellStrong buy
Strong sellSellNeutralBuyStrong buy
Moving Averages
Neutral
SellBuy
Strong sellStrong buy
Strong sellSellNeutralBuyStrong buy
Moving Averages
Neutral
SellBuy
Strong sellStrong buy
Strong sellSellNeutralBuyStrong buy
Displays a symbol's price movements over previous years to identify recurring trends.