CAD/CHF Bearish Continuation Setup: Flag + Rising WedgeHello guys!
Let's analyze CADCHF!
1. Flag Pattern Formation
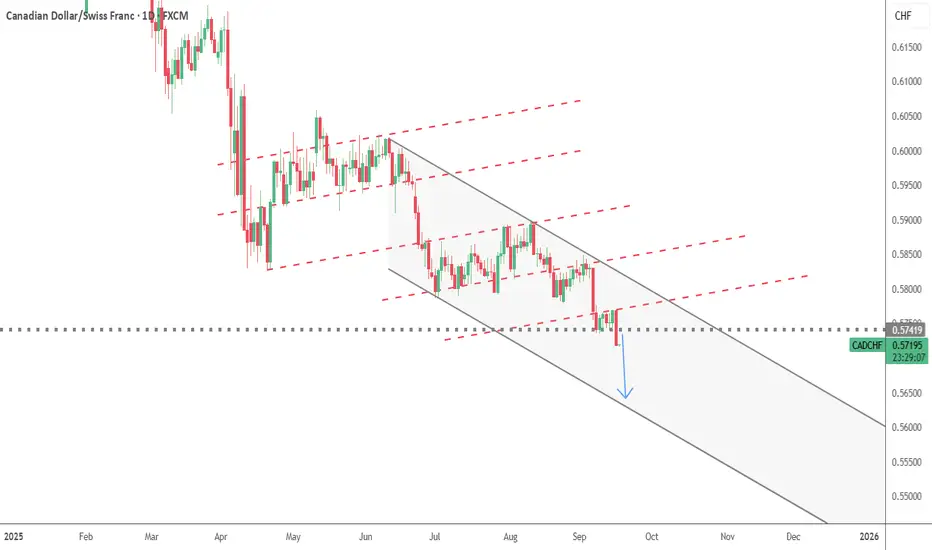
Firstly, CAD/CHF formed a bearish flag pattern. The flagpole was created by the sharp drop from around 0.5820 down to 0.5730, followed by the consolidation phase. The measured move of the flag points to a target around 0.5685, which is clearly marked on your chart.
2. Descending Trendline
We can also see a descending trendline drawn from the recent highs. This confirms that the dominant trend remains bearish, as sellers continue to push the price lower at each bounce.
3. Rising Wedge in Play
Currently, price is trading inside a rising wedge, moving upwards from the recent low near 0.5700 up to 0.5755. This wedge hasn’t broken down yet, but if it does, it will provide a strong short opportunity.
Target of the wedge breakdown: around 0.5720
Target of the flag pattern: around 0.5685
Disclaimer: As part of ThinkMarkets’ Influencer Program, I am sponsored to share and publish their charts in my analysis.
CADCHF trade ideas

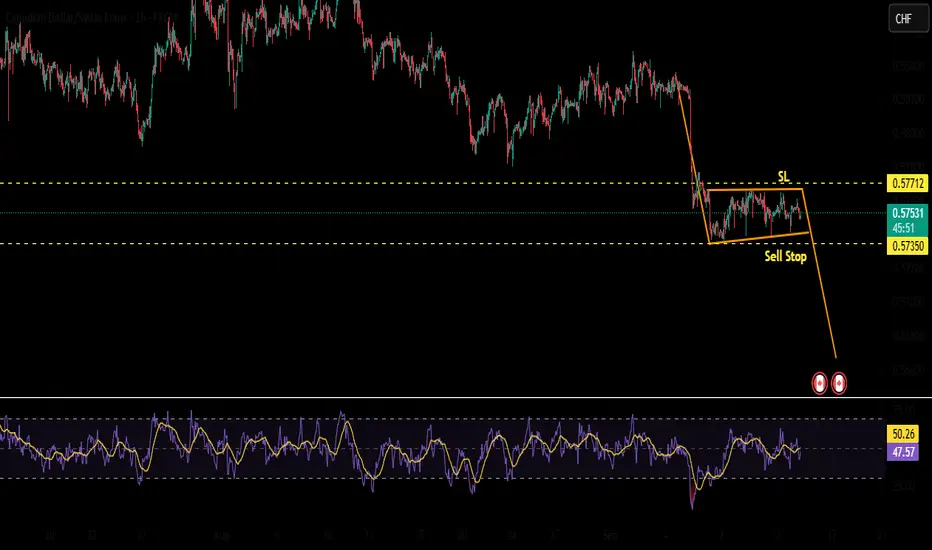
CADCHF Rally Meets Resistance, Bears Eye Fresh DownsideCADCHF has recovered into resistance near the 0.5770 zone after an aggressive drop earlier in September. The bounce looks corrective rather than structural, and the broader downtrend remains intact. With Canada facing stagflation risks and Switzerland maintaining low but stable inflation, the franc’s safe-haven demand keeps pressure on CAD.
Current Bias
Bearish – recent strength appears corrective; sellers are likely to re-engage below resistance.
Key Fundamental Drivers
Bank of Canada: Rate cut expectations are rising after soft GDP and weak labor data, weighing on CAD.
Swiss National Bank (SNB): Steady policy with inflation under control keeps CHF stable.
Oil Prices: Weak oil performance undermines CAD, given Canada’s reliance on energy exports.
Macro Context
Interest Rates: BoC is tilting dovish, while the SNB holds steady. Divergence favors CHF strength.
Growth Trends: Canadian economy shows stagnation risks; Switzerland remains resilient with moderate growth.
Commodity Flows: Oil remains a drag on CAD, with geopolitical headlines adding volatility.
Geopolitics: CHF demand often spikes during global risk-off events, while CAD suffers in those conditions.
Primary Risk to the Trend
A sharp rebound in oil prices or stronger-than-expected Canadian economic data could give CAD relief and weaken the bearish case.
Most Critical Upcoming News/Event
Canada GDP and inflation data
SNB commentary on currency strength
Global energy headlines affecting oil prices
Leader/Lagger Dynamics
CADCHF is generally a lagger, reflecting moves in oil and broader CHF sentiment. Watch oil for CAD momentum and EURCHF for CHF direction.
Key Levels
Support Levels: 0.5736, 0.5701
Resistance Levels: 0.5776, 0.5816
Stop Loss (SL): 0.5816 (above key resistance)
Take Profit (TP): 0.5736 (first target), 0.5701 (secondary target)
Summary: Bias and Watchpoints
CADCHF holds a bearish bias with the recovery stalling at 0.5770. The broader fundamental backdrop favors CHF as BoC shifts dovish and oil remains under pressure. A stop loss above 0.5816 helps protect against false breakouts, while profit-taking targets are set at 0.5736 and 0.5701. This pair is more of a lagger, following oil and CHF flows, so traders should stay alert to energy headlines and safe-haven demand.

CADCHF Elliott Wave AnalysisHello friends
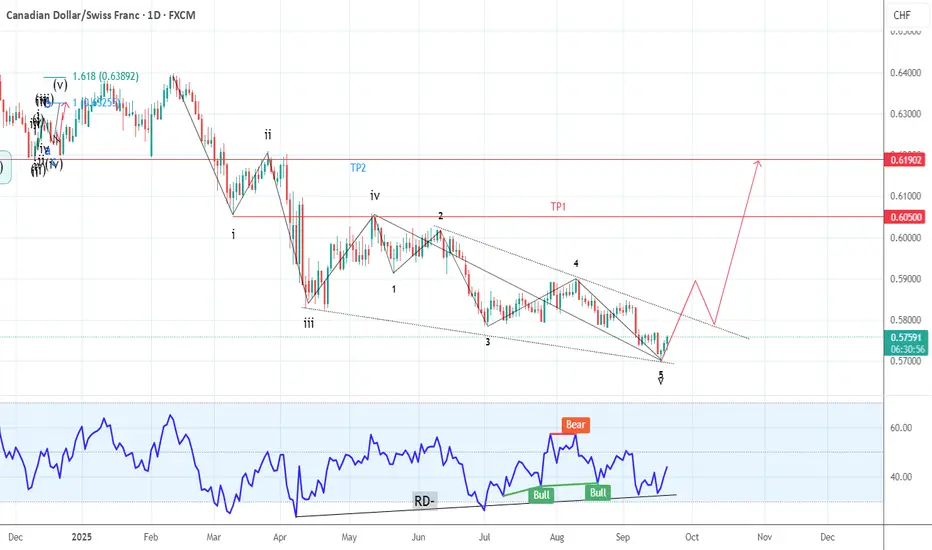
We are witnessing the formation of a complete Elliott wave pattern on the CADCHF chart. These waves from 1 to 5 are quite distinct and you can even count their subwaves (especially the microwaves of the main wave 5).
Now wave 5 is completing and moving inside a descending channel. The microwaves of wave 5 have already been completed. But after the completion of wave 5, with the breakdown of the trend line drawn above and a return to it, we can expect the price to grow to the specified support.
The first resistance is 0.60500 and the second target is 0.6200.
Of course, the price increase in wave 5 is always accompanied by divergence and a decrease in the slope of the chart, as you can see, the slope of wave 5 is much less than wave 3, and the divergence occurred between the main waves 5 and 3.
Good luck and be profitable.

CAD/CHF BEARS ARE STRONG HERE|SHORT
Hello, Friends!
CAD/CHF is trending down which is obvious from the red colour of the previous weekly candle. However, the price has locally surged into the overbought territory. Which can be told from its proximity to the BB upper band. Which presents a great trend following opportunity for a short trade from the resistance line above towards the demand level of 0.570.
Disclosure: I am part of Trade Nation's Influencer program and receive a monthly fee for using their TradingView charts in my analysis.
✅LIKE AND COMMENT MY IDEAS✅

CAD_CHF RESISTANCE AHEAD|SHORT|
✅CAD_CHF is set to retest
A strong resistance level
Above at 0.5790 after trading
In a local uptrend for some time
Which makes a bearish pullback
A likely scenario with the target
Being a local support
Below at 0.5763
SHORT🔥
✅Like and subscribe to never miss a new idea!✅

CADCHF - Buy - RR: 2-1Price is being at a H4 demand zone, absorbing more buy orders, expecting a move up high.
Buy now, TP and SL as published!

CADCHF Long Trade OANDA:CADCHF Long Trade
Entry:0.57550 - 0.5776
TP-1: 0.57950 - Breakeven here
TP-2: 0.58200
This is good trade.
Don't overload your risk like Greedy gambler!!!
Be Disciplined Trader, risk what you can afford.
Use proper risk management.
Disclaimer: Trading is risky, only idea, not advice.

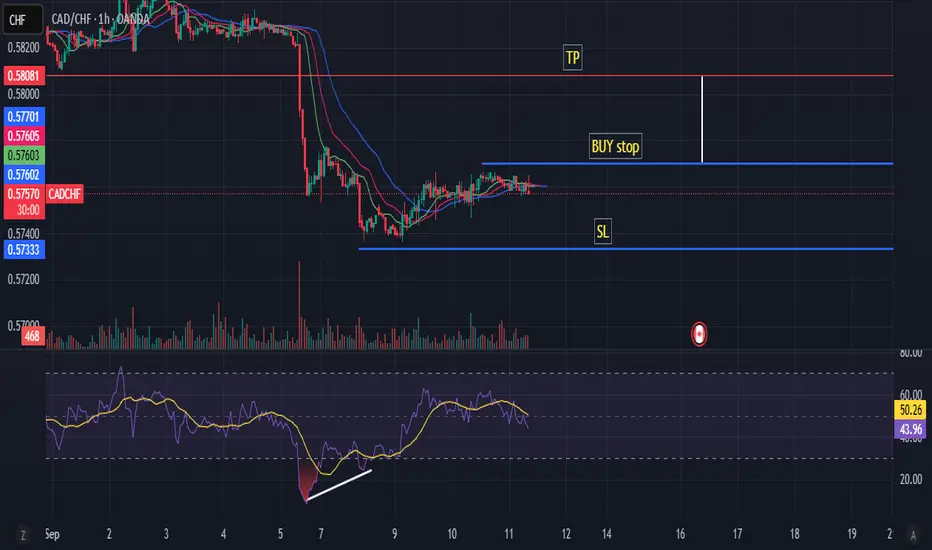
CADCHF in bearish trend CADCHF in bearish trend, RSI bullish diversion can be seen. My fx book bias 92% bullish entry with a buy stop RR 1:1
CADCHF Retest of Major Support Level at (0.58004 - 0.57835)Price is in heavy downtrend.
Price broke major support level that will turn to resistance at (0.58004 - 0.57835).
Bearish falling trendline with 2 touches at Key Support Level.
Price is in 50% - 61.8% Fib Zone.

CADCHF SELL IDEACADCHF - Canadian Dollar was weak today and Swiss Franc one of the strongest. Price is possible to fall on 0.60595

Bearish reversal off major resistance?CAD/CHF is rising towards the pivot which is an overlap resistance, and could reverse to the 1st support.
Pivot: 0.57794
1st Support: 0.57164
1st Resistance: 0.58228
Disclaimer:
The above opinions given constitute general market commentary, and do not constitute the opinion or advice of IC Markets or any form of personal or investment advice.
Any opinions, news, research, analyses, prices, other information, or links to third-party sites contained on this website are provided on an "as-is" basis, are intended only to be informative, is not an advice nor a recommendation, nor research, or a record of our trading prices, or an offer of, or solicitation for a transaction in any financial instrument and thus should not be treated as such. The information provided does not involve any specific investment objectives, financial situation and needs of any specific person who may receive it. Please be aware, that past performance is not a reliable indicator of future performance and/or results. Past Performance or Forward-looking scenarios based upon the reasonable beliefs of the third-party provider are not a guarantee of future performance. Actual results may differ materially from those anticipated in forward-looking or past performance statements. IC Markets makes no representation or warranty and assumes no liability as to the accuracy or completeness of the information provided, nor any loss arising from any investment based on a recommendation, forecast or any information supplied by any third-party.

CADCHF: Trend ContinuationCADCHF continues to remain bearish as it holds below the key level on the daily timeframe. Here's a summary of my key observations over on the daily and intraday timeframes.
Daily Timeframe:
Price broke the key support level in early September
After some sideways price action, price is currently making a bearish bar that engulfs the prior day's doji
H1 Timeframe:
Price broke through the ATL, which shows confluence with the downtrend
EMA20 is also below EMA60, moving further apart to signal momentum is picking up
Price is also below EMA20, which signals confluence with downtrend as well

CADCHF | ABCD PatternCADCHF has formed an ABCD pattern.Once it gives a breakout then it will further go downside and continue bearish trend.
CADCHFthe price respected it and formed sweep then choch and engulfing candle
which indicate uptrend wave
Exit point is 0.57700

CADCHF POSSIBLE LONGCADCHF Showing possible FLAT FORMATION?. We have seen 3 corrective waves in WAVE A, 3 corrective waves in B?. If CADCHF stays above 0.57350, then CADCHF should be expected to rally to 0.58900 TO COMPLETE C

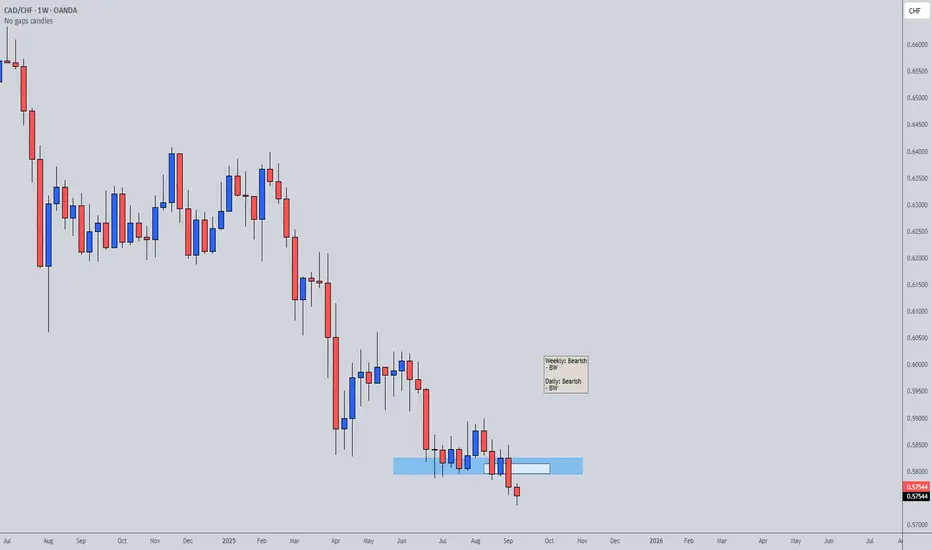
CADCHF - Short - Conviction: Low | Chronex (London • Sep 12)Hello Guys! Overall trend from all timeframe is Downtrend, sellers are in control. We are now on pretty good supply zone
Risks
1. Do we have economic high impact news release? No
2. Any higher-timeframe counter-trend zones? No
3. Has better zone above/below? None
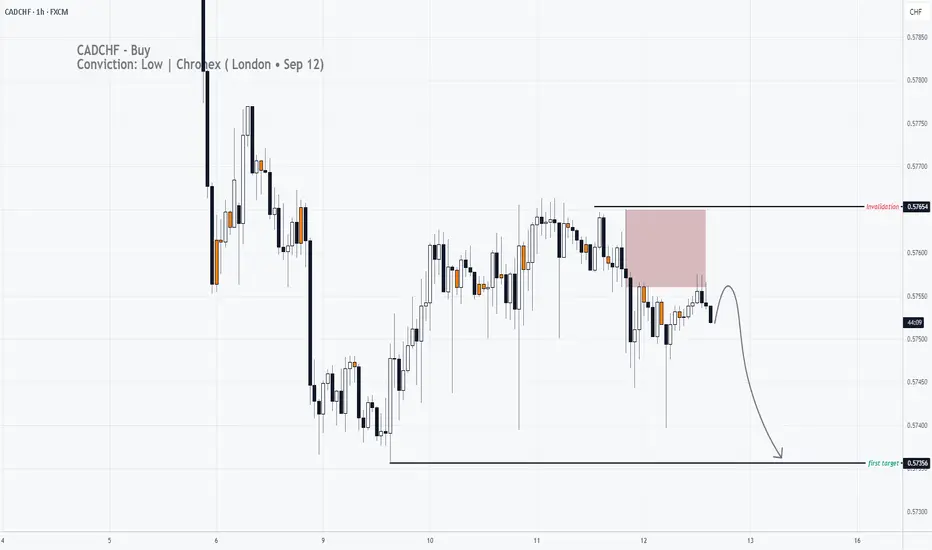
Sell CADCHF CADCHF Bearish Idea: A bearish flag is seen on the 3hr chart. We can expect price to decline today with sharp bearish moves before a potential change of direction

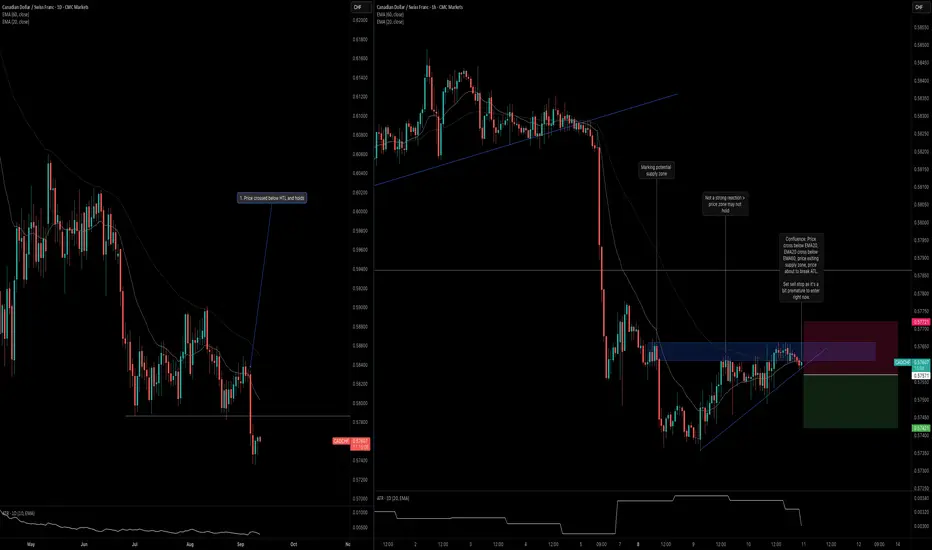
CADCHF: Trend Continues Below Daily LevelCADCHF is beginning to show confluence, which gives me an opportunity to frame my entry opportunity. Here are the key observations across the daily and H1 timeframes.
Daily Timeframe:
Price made a strong break below the HTL and is holding below it.
Although two bullish bar formed, they did not engulf the previous bearish bar, which is a good indication that buying strengh just isn't there.
H1 Timeframe:
There's quite a bit of confluence on the H1 timeframe with the first being price entering and exiting the potential supply zone.
In addition, price is about to cross below the ATL, which is another sign that the counter-trend move is ending.
Finally, there's confluence with the moving averages where EMA20 is crossing below EMA60; price is also beginning to cross below EMA20.
CADCHFLooking for a retracement to the upside anywhere between 38% or more. Previous low was broken. Let's see if we can get some bullish volume to the upside here within the next week or so.

CAD/CHF BULLISH BIAS RIGHT NOW| LONG
CAD/CHF SIGNAL
Trade Direction: long
Entry Level: 0.575
Target Level: 0.587
Stop Loss: 0.567
RISK PROFILE
Risk level: medium
Suggested risk: 1%
Timeframe: 1D
Disclosure: I am part of Trade Nation's Influencer program and receive a monthly fee for using their TradingView charts in my analysis.
✅LIKE AND COMMENT MY IDEAS✅
