Trade ideas

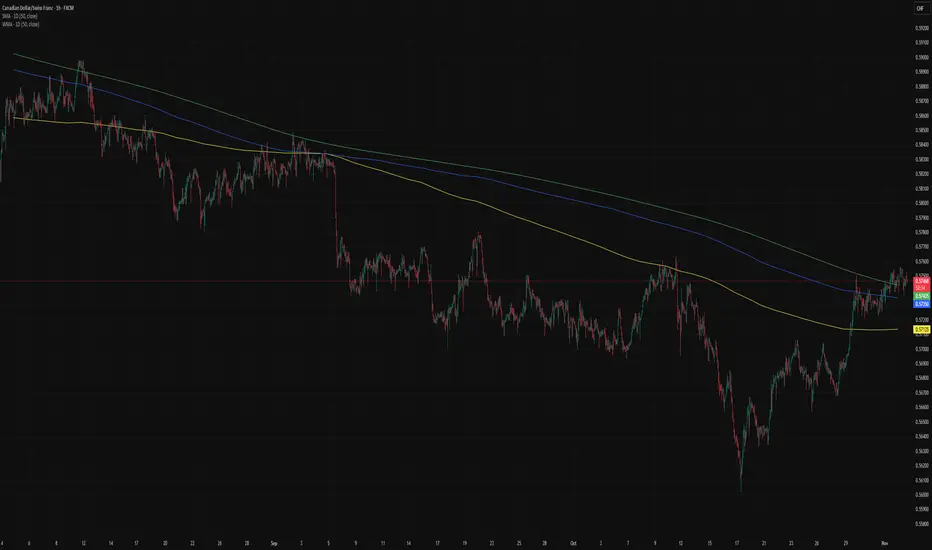
CAD/CHF – Retracement PhaseCAD/CHF remains structurally bullish on the higher timeframes, with price still trading above the primary ascending trendline. The recent tap into a minor supply zone has triggered a controlled pullback, and price is currently reacting around the 0.236 Fibonacci retracement level from the latest impulse leg.
If buyers maintain control above the trendline, the bullish structure remains intact and the market may look to resume upward movement. However, a break and clear acceptance below the trendline would likely open the door for a deeper correction toward the 0.382–0.50 Fibonacci zones, where prior demand and liquidity rest. The 0.618 retracement level stands as the critical structural decision point for medium-term trend continuation.
At this stage, the pair is in a retracement phase, and the next directional move will depend on how price resolves around these key technical areas. Monitoring reaction and order flow at each retracement zone will provide clarity on continuation versus deeper correction.
Key Technical Zones:
• Immediate Reaction Zone: 0.236
• Secondary Support Areas: 0.382 / 0.50
• Major Correction Zone: 0.618

CADCHF November 2025 fundamental analysisCanadian Dollar (CAD): Economic Headwinds and Continued Easing
Bank of Canada Policy
The Bank of Canada delivered another 25 basis point rate cut at its October 29 meeting, bringing the policy rate to 2.25%. This continues an aggressive easing cycle that has seen rates reduced by 225 basis points since June 2024, from a peak of 4.50% to the current 2.75%. Markets are pricing in current easing for the October meeting despite recent data showing 60,000 employment gains and headline inflation rising to 2.4%.
Economic Challenges
The BoC's dovish stance is driven by persistent concerns about the Canadian economic outlook. The third-quarter Business Outlook Survey showed that uncertainty around trade policy continues to weigh heavily on investment and hiring plans. The "future sales" indicator dropped back into negative territory for the first time in 2025, and 63% of firms expect either unchanged or reduced workforce levels—levels historically associated with unemployment rates of 7.3% or higher.
Canada's terms of trade have deteriorated significantly, with crude oil prices falling to multi-month lows. WTI crude is trading around $59-60 per barrel, down from earlier highs, removing a key pillar of support for the loonie.
November Outlook: Bearish
The Canadian Dollar faces a challenging November. USD/CAD has moved higher to the 1.40 handle, and while some analysts expect a return to 1.38 by year-end driven primarily by USD weakness, the path may be slow with potential spikes to 1.41. The loonie is expected to underperform against most G10 currencies, given the BoC's continued easing path and Canada's vulnerability to weak energy prices.
Swiss Franc (CHF): Safe Haven Supremacy Despite Zero Rates
Swiss National Bank Policy
The Swiss National Bank has maintained its policy rate at 0.00% and shows no inclination to move into negative territory despite franc strength. At its September meeting, the SNB notably refrained from describing the franc as "highly valued" or expressing concern over its appreciation—a significant shift in communication. This suggests the SNB has become more comfortable with franc strength, particularly as Switzerland's real exchange rate remains relatively stable due to low domestic inflation of just 0.2%.
Economic Environment
Switzerland's economy is projected to grow 1.5% in 2025 and 1.0% in 2026, with inflation expected to remain subdued at 0.2% in 2025 and 0.5% in 2026. The SNB characterized current policy settings as "appropriately expansionary" despite the 0% rate, and expressed confidence that inflation will remain within the 0-2% target range. Risks to the outlook are tilted to the downside, with weaker growth prospects potentially limiting any hawkish policy adjustments.
November Outlook: Bullish
The Swiss franc's safe-haven status provides strong support in November's uncertain environment. EUR/CHF has been trading around 0.92-0.93, and analysts expect the pair to gradually appreciate toward 0.96 over the next 12 months, implying modest franc weakness against the euro. However, against the dollar, the franc is expected to strengthen significantly, with USD/CHF forecasts suggesting 0.77 within a year, with downside risks toward 0.75 or even 0.73. The franc's outperformance has persisted despite substantial interest rate differentials, demonstrating the power of safe-haven flows in the current geopolitical environment.
Verdict
The ever-stable CHF is posed to continue its straight outperformance of the economically challenged CAD in November. CAD/CHF is therefore a SELL .
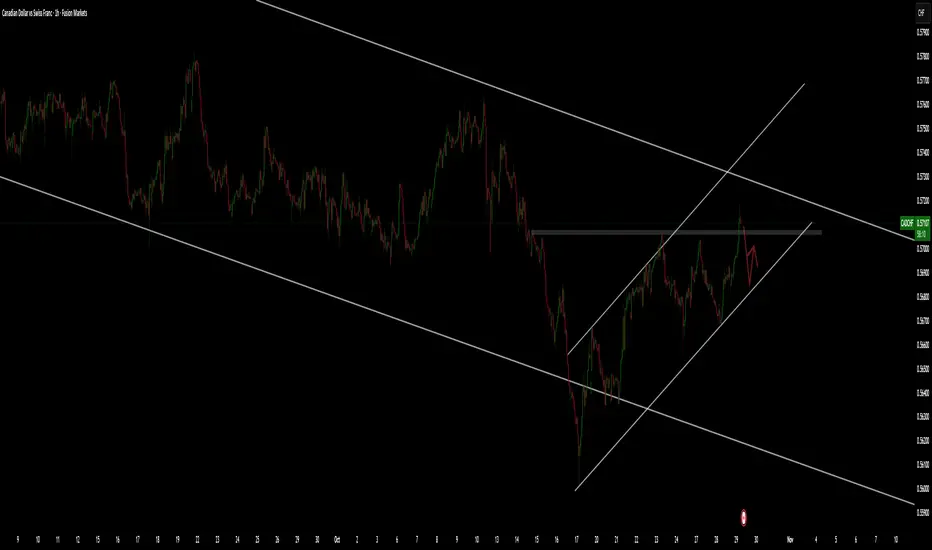
Analysis of CAD/CHFThe chart of this pair has a very clean and educational setup.
The previous trend was strongly bearish — so clear that it’s easily noticeable at first glance.
What’s the rule we’ve set? **Never open a position against the trend.**
Now, the price has managed to break a long and valid trendline after quite some time, and it has already made a pullback.
Despite that, we still don’t open any positions until we get confirmation.
And when do we get that confirmation? When the price can break above the **0.57630** level — that’s when we can confirm a potential trend reversal is forming.
Personally, I would prefer to see a fake move at this point — a rejection and a drop back below the trendline — so I can take a short position, as it would carry less risk.

CADCHF — Daily vs 4H ChartCADCHF — Daily vs 4H Chart 📉
The overall trend remains bearish, and I don’t see any sign of a Market Structure Shift (MSS) yet.
On the 4H timeframe, I notice a short-term bullish move, but I expect a bearish reaction from the Daily “Orange” resistance zones.
I’ll look to sell once a clear price-action confirmation appears.
Target: Nearest psychological level
🎯 Goal 001 → 0.55200
OANDA:CADCHF


AUDCHF Trade Recap, 31.10.25 Morning ForcastPairs on Watch
FX:AUDCHF Long
TVC:GOLD Short
FX:NZDUSD Short
FX:NZDJPY Short
FX:CADCHF Long
A short overview of the instruments i am looking at for Today, Multi-timeframe analysis down to what i will be looking for entry

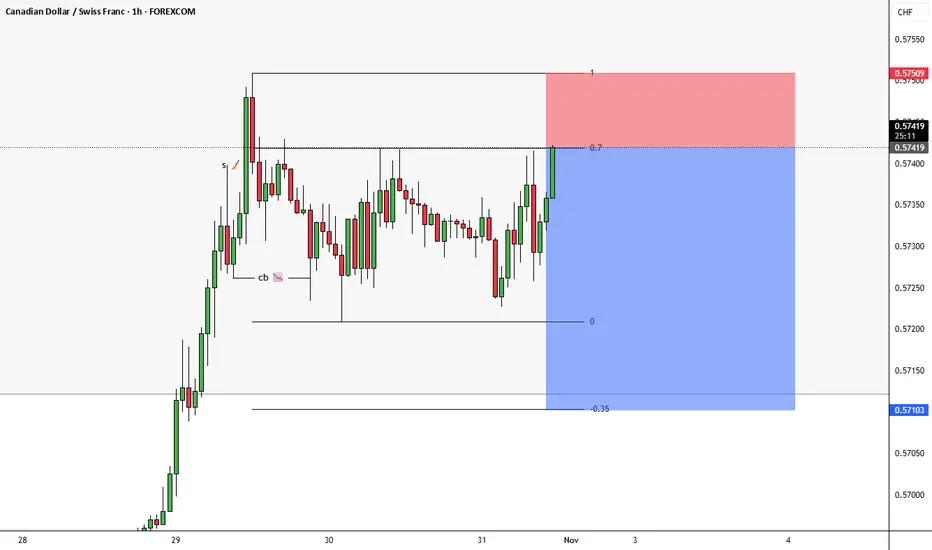
CADCHF pullback.CADCHF has been moving nicely within the channel. But overall it is in the DownTrend and now going for a pull back. If breaks the small channel a possible fall.
CADCHF A Fall Expected! SELL!
My dear followers,
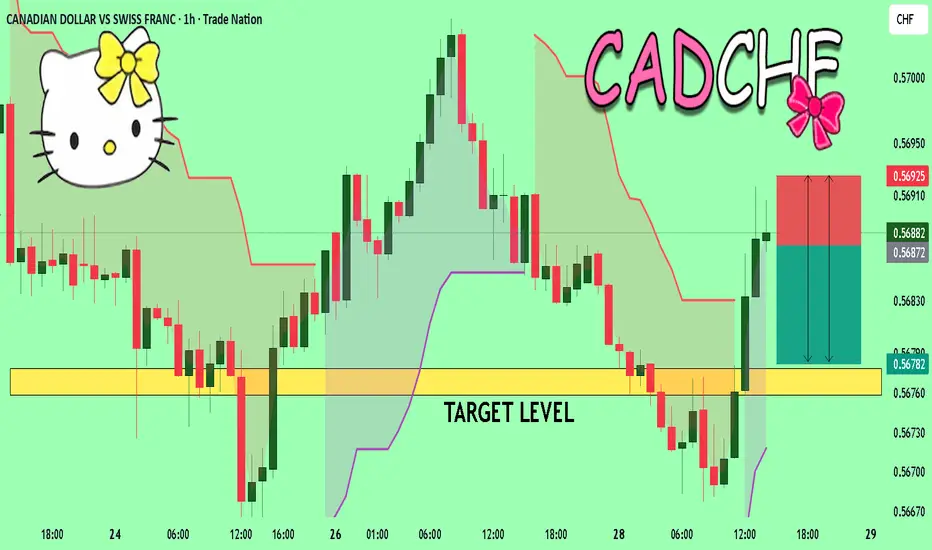
I analysed this chart on CADCHFand concluded the following:
The market is trading on 0.5687 pivot level.
Bias - Bearish
Technical Indicators: Both Super Trend & Pivot HL indicate a highly probable Bearish continuation.
Target -0.5677
Safe Stop Loss - 0.5692
About Used Indicators:
A super-trend indicator is plotted on either above or below the closing price to signal a buy or sell. The indicator changes color, based on whether or not you should be buying. If the super-trend indicator moves below the closing price, the indicator turns green, and it signals an entry point or points to buy.
Disclosure: I am part of Trade Nation's Influencer program and receive a monthly fee for using their TradingView charts in my analysis.
———————————
WISH YOU ALL LUCK
CADCHF Forming Descending ChannelCADCHF is currently trading within a well-defined descending channel on the daily timeframe, signaling a prolonged bearish trend. However, the recent price action near the lower boundary of the channel suggests potential exhaustion of selling pressure and a possible reversal setup. The pair has bounced strongly from the lower trendline, and if price breaks above the upper boundary of this channel around the 0.5700–0.5720 zone, it could confirm a bullish breakout. This would open the door for a potential recovery toward 0.5900 and possibly 0.6000 in the coming weeks, offering attractive buy-side opportunities for swing traders.
Fundamentally, the Canadian dollar is gaining underlying strength due to rising oil prices and stable economic performance, while the Swiss franc remains under slight pressure as risk sentiment improves globally. The Bank of Canada’s firm stance on controlling inflation continues to support CAD, whereas the Swiss National Bank maintains a cautious policy approach, limiting CHF’s upside. With commodity demand increasing and global markets showing risk-on momentum, CADCHF could see renewed bullish energy if the technical breakout aligns with these macroeconomic factors.
Traders should watch for a clear daily close above 0.5720 for confirmation of a breakout from the falling channel. As long as the pair stays above 0.5650, the bullish scenario remains valid. This setup offers a potential reversal opportunity from a prolonged downtrend, positioning CADCHF for a profitable upside move in the medium term.
CADCHF: SHORT TERM BULLISH MOVEMENTI expect CADCHF to make a short move to the up side before resuming movement to the down side.
This publication is for educational purposes only.

CADCHF — 1H ChartCADCHF — 1H Chart 📉
Price has formed a Double Top at a key level.
If price returns for a retest, I’ll look to sell toward my take-profit target.
🎯 Sell Target → 0.56745
OANDA:CADCHF

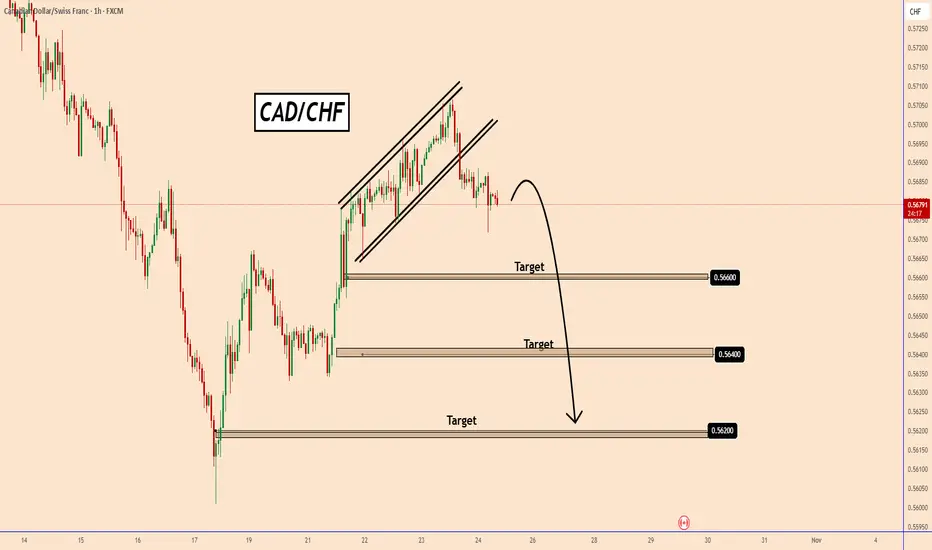
CADCHF Forms Bearish Channel- Sellers Target 0.5620 ZoneCADCHF Forms Bearish Channel- Sellers Target 0.5620 Zone
CADCHF shows a rising channel pattern (bearish flag formation) following a strong impulsive downward move.
This indicates that the recent bullish correction might be coming to an end, and CADCHF could resume its prior bearish trend.
The price appears to have rejected the upper boundary of the channel, suggesting weakening buying momentum.
Key Targets:
First target: 0.5660
Second target: 0.5640
Final target: 0.5620
You may find more details in the chart!
Thank you and Good Luck!
❤️PS: Please support with a like or comment if you find this analysis useful for your trading day❤️
CADCHF – 4H Reversal WinHere’s a trade we took last Thursday on the 4-hour chart. It was a textbook VMS setup:
✅ Strong reversal structure
✅ Engulfing candle confirmation
✅ Momentum strong with clear divergence
✅ Volume at 77 (medium but supportive)
We entered with a limit order on the pullback (about 38%), and the market eventually carried the position to profit. The trade lasted a full week — and this morning, it hit target for the win. ✅
This is the power of applying the VMS Strategy with patience and discipline. We don’t chase; we prepare, wait for alignment, and let the market do the rest.
⚠️ For educational purposes only. This is not financial advice.

CAD-CHF Will Fall! Sell!
Hello,Traders!
CADCHF is approaching a horizontal supply area where institutional selling pressure may return. A reaction from this zone could trigger a bearish continuation toward the next liquidity pocket. Time Frame 5H.
Sell!
Comment and subscribe to help us grow!
Check out other forecasts below too!
Disclosure: I am part of Trade Nation's Influencer program and receive a monthly fee for using their TradingView charts in my analysis.

CAD/CHF BEST PLACE TO SELL FROM|SHORT
CAD/CHF SIGNAL
Trade Direction: short
Entry Level: 0.568
Target Level: 0.564
Stop Loss: 0.570
RISK PROFILE
Risk level: medium
Suggested risk: 1%
Timeframe: 5h
Disclosure: I am part of Trade Nation's Influencer program and receive a monthly fee for using their TradingView charts in my analysis.
✅LIKE AND COMMENT MY IDEAS✅

Bullish bounce off pullback support?CAD/CHF is falling towards the pivot which is a pullback support that aligns with the 38.2% Fibonacci retracement and could bounce to the 1st resistance.
Pivot: 0.56666
1st Support: 0.5636
1st Resistance: 0.5721
Disclaimer:
The above opinions given constitute general market commentary, and do not constitute the opinion or advice of IC Markets or any form of personal or investment advice.
Any opinions, news, research, analyses, prices, other information, or links to third-party sites contained on this website are provided on an "as-is" basis, are intended only to be informative, is not an advice nor a recommendation, nor research, or a record of our trading prices, or an offer of, or solicitation for a transaction in any financial instrument and thus should not be treated as such. The information provided does not involve any specific investment objectives, financial situation and needs of any specific person who may receive it. Please be aware, that past performance is not a reliable indicator of future performance and/or results. Past Performance or Forward-looking scenarios based upon the reasonable beliefs of the third-party provider are not a guarantee of future performance. Actual results may differ materially from those anticipated in forward-looking or past performance statements. IC Markets makes no representation or warranty and assumes no liability as to the accuracy or completeness of the information provided, nor any loss arising from any investment based on a recommendation, forecast or any information supplied by any third-party.

CADCHFNot financial advice. The essence of investing & trading is the intelligent and patient preying on the greed, fear, impatience, addiction and ignorance of the majority. It's definitionally Darwinian.

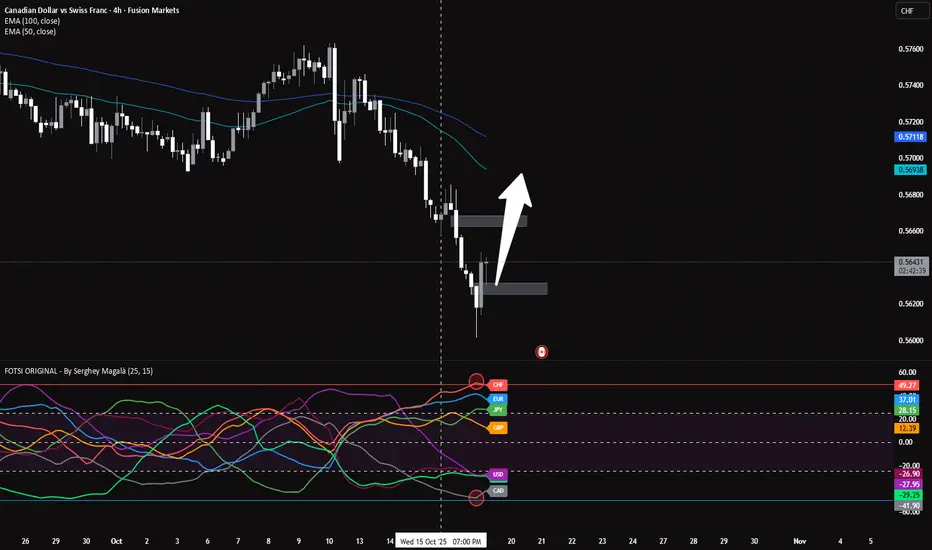
CADCHF - BUYAccording to the FOTSI indicator, both on H1 and H4, there’s overbought pressure on CHF and oversold pressure on CAD — and this is exactly what we look for to take buy setups on the CADCHF pair. It’s the standard setup within the FOTSI strategy, with a pullback to the 50 and 100 EMAs.

CADCHF SELL TRADE IDEAI’ve taken a sell position on CAD/CHF as the pair continues to follow a strong bearish trend on both the daily and 4-hour timeframes. The overall market structure clearly shows consistent downside movement, with lower highs (LH) and lower lows (LL) forming across all key timeframes.
On the 1-hour chart, price recently formed a new lower high, rejecting the descending trendline — a clear confirmation of bearish continuation. This setup aligns perfectly with the higher timeframe trend and offers a clean confluence-based short entry with a favorable risk-to-reward ratio.
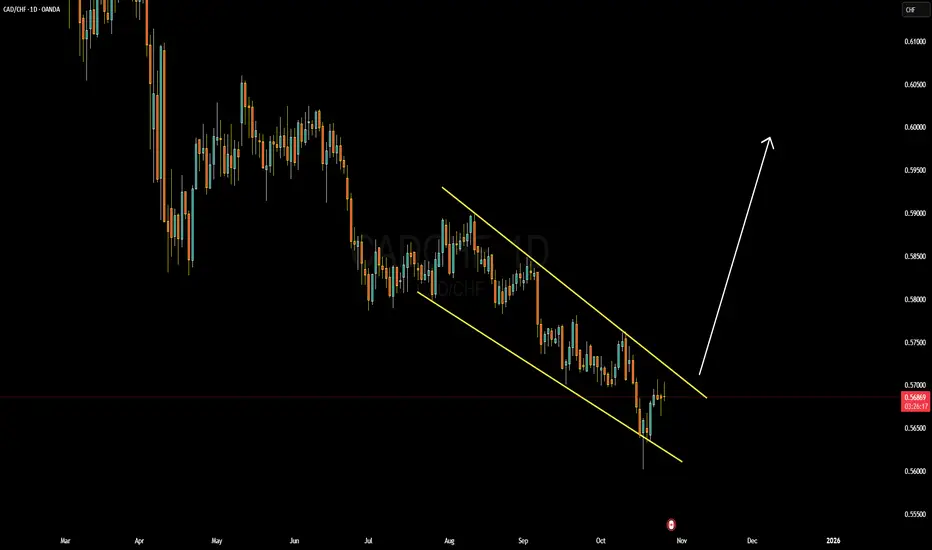
CADCHF 1D Market OutlookPotential for a bullish pullback on the CADCHF 1D which could lead to a price movement towards the resistance level at 0.60000. BUY levels from 0.56300
