CADCHFthe price respected it and formed sweep then choch and engulfing candle
which indicate uptrend wave
Exit point is 0.57700
CADCHF trade ideas

CADCHF POSSIBLE LONGCADCHF Showing possible FLAT FORMATION?. We have seen 3 corrective waves in WAVE A, 3 corrective waves in B?. If CADCHF stays above 0.57350, then CADCHF should be expected to rally to 0.58900 TO COMPLETE C

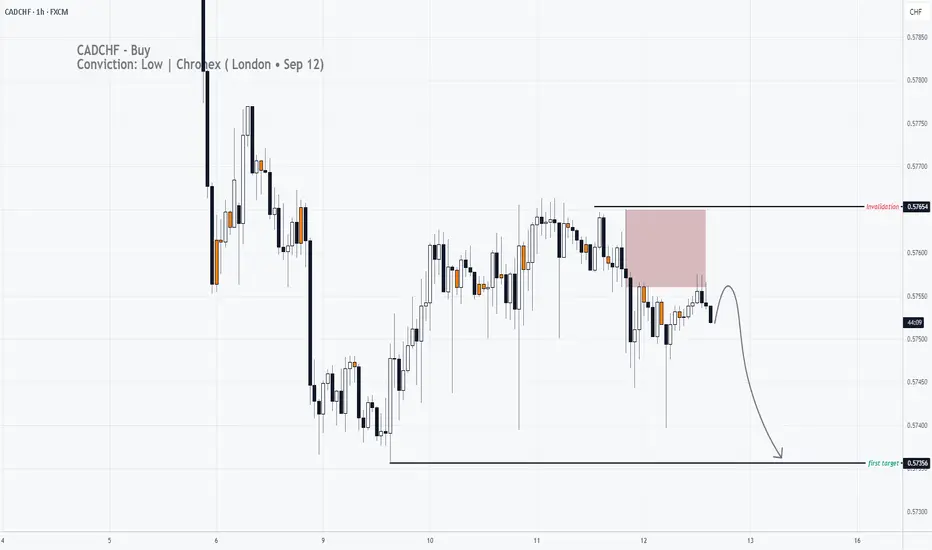
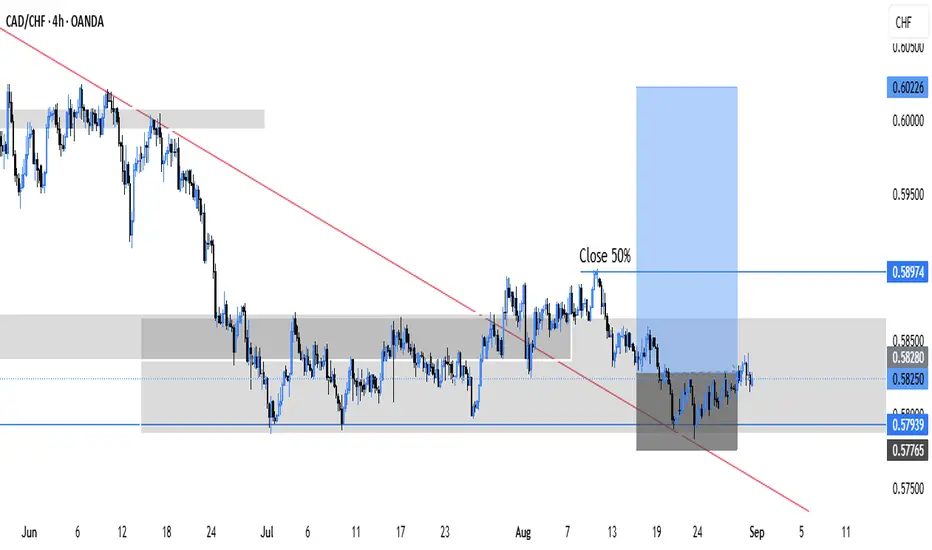
CADCHF - Short - Conviction: Low | Chronex (London • Sep 12)Hello Guys! Overall trend from all timeframe is Downtrend, sellers are in control. We are now on pretty good supply zone
Risks
1. Do we have economic high impact news release? No
2. Any higher-timeframe counter-trend zones? No
3. Has better zone above/below? None
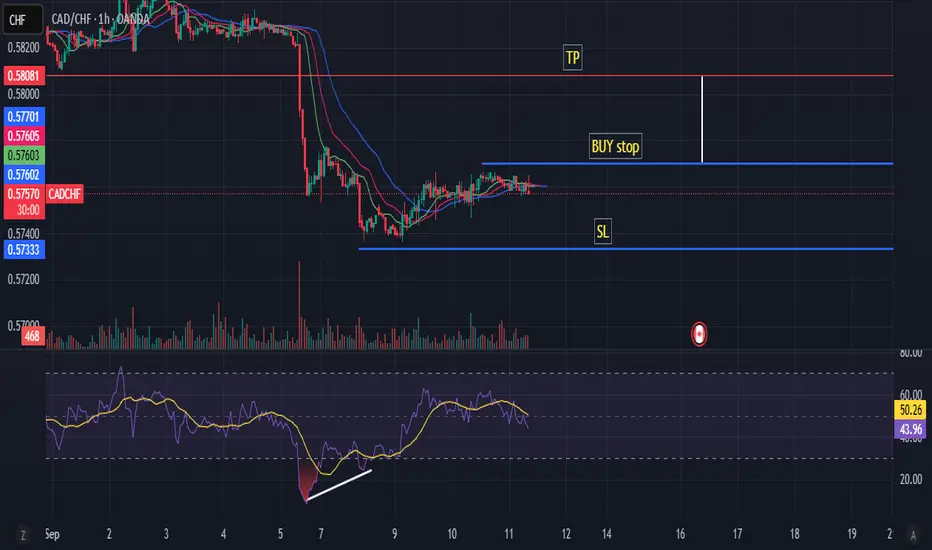
CADCHF in bearish trend CADCHF in bearish trend, RSI bullish diversion can be seen. My fx book bias 92% bullish entry with a buy stop RR 1:1
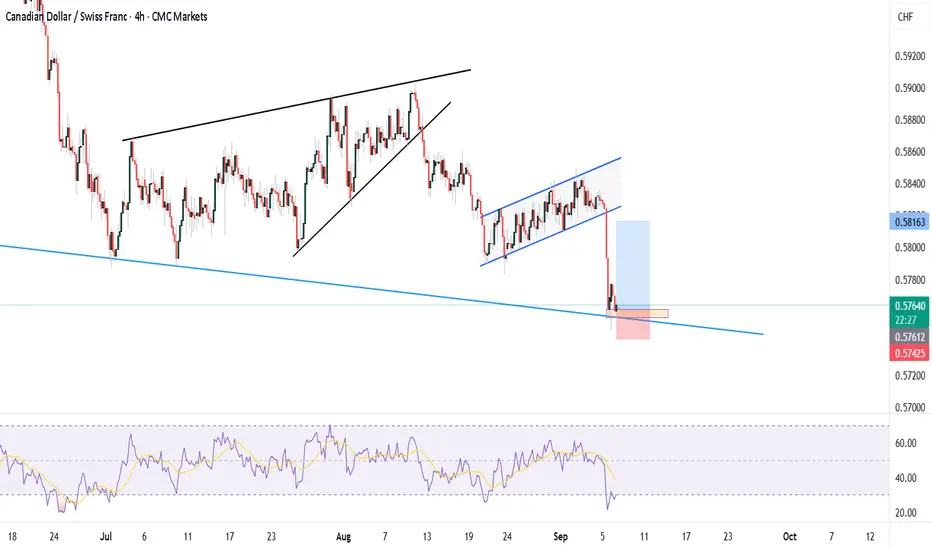
Sell CADCHF CADCHF Bearish Idea: A bearish flag is seen on the 3hr chart. We can expect price to decline today with sharp bearish moves before a potential change of direction

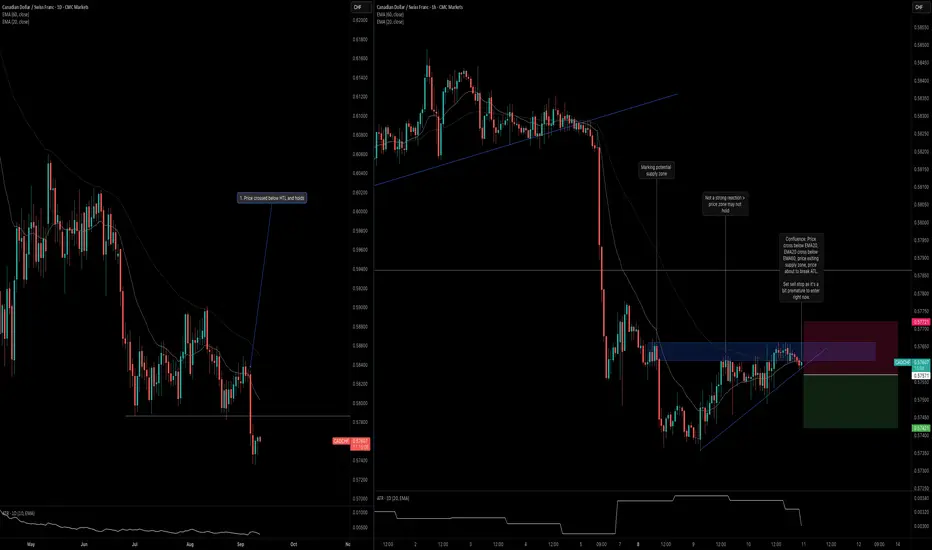
CADCHF: Trend Continues Below Daily LevelCADCHF is beginning to show confluence, which gives me an opportunity to frame my entry opportunity. Here are the key observations across the daily and H1 timeframes.
Daily Timeframe:
Price made a strong break below the HTL and is holding below it.
Although two bullish bar formed, they did not engulf the previous bearish bar, which is a good indication that buying strengh just isn't there.
H1 Timeframe:
There's quite a bit of confluence on the H1 timeframe with the first being price entering and exiting the potential supply zone.
In addition, price is about to cross below the ATL, which is another sign that the counter-trend move is ending.
Finally, there's confluence with the moving averages where EMA20 is crossing below EMA60; price is also beginning to cross below EMA20.
CADCHFLooking for a retracement to the upside anywhere between 38% or more. Previous low was broken. Let's see if we can get some bullish volume to the upside here within the next week or so.

CAD/CHF BULLISH BIAS RIGHT NOW| LONG
CAD/CHF SIGNAL
Trade Direction: long
Entry Level: 0.575
Target Level: 0.587
Stop Loss: 0.567
RISK PROFILE
Risk level: medium
Suggested risk: 1%
Timeframe: 1D
Disclosure: I am part of Trade Nation's Influencer program and receive a monthly fee for using their TradingView charts in my analysis.
✅LIKE AND COMMENT MY IDEAS✅

CADCHF H1 CAD CHF has Formed a falling wedge pattern and then creating a market structure shift to the upside.
Price is currently pulling towards the golden fib zone.
Confluences for the trade:
- Falling wedge reversal pattern
- Matrket structure shift
- RSI Divergence
- Price pulling back to fib levels

The Bigger PictureThis pair has been depreciating for years, but I think 2025 at least will be a strong year for CAD.

CADCHF BUY TRADE IDEACADCHF Price is currently at the lower trendline after a bearish trend. The RSI level is at 30.09, which represents the oversold level. Based on these conditions, my anticipation is a bullish trend from the current price.
CAD-CHF Will Keep Falling! Sell!
Hello,Traders!
CAD-CHF keeps falling
In a strong downtrend
And the pair made some
Strong bearish moves
Today already so we are
Bearish biased and we
Will be expecting a
Further bearish move down
Sell!
Comment and subscribe to help us grow!
Check out other forecasts below too!
Disclosure: I am part of Trade Nation's Influencer program and receive a monthly fee for using their TradingView charts in my analysis.

CAD/CHF – Bearish Outlook In 3 StepsCAD/CHF – Bearish Outlook 🚨
Pair: CAD/CHF
Bias: Bearish
The CAD/CHF is showing signs of weakness
on the charts. Here’s what to think about:
Fibonacci Breakdown 📉
Price has broken below key Fibonacci
retracement levels, confirming
that the upward correction is exhausted.
Sellers are now in control, and deeper
retracement toward lower
fib zones is expected.
MACD Crossover 🔻
The MACD has crossed bearish, signaling
momentum is shifting
strongly to the downside.
This crossover aligns with the Fibonacci
breakdown, giving confluence
to the bearish setup.
Trend Context 📊
On higher timeframes, CAD/CHF
has been struggling near resistance.
Current structure suggests a potential
continuation lower as the
Canadian Dollar weakens against the Swiss Franc.
📌 Trading Plan
Sell Bias: Look for short entries
below broken fib levels.
Targets: Next Fibonacci zones
lower (0.618 → 0.786 retracement area).
Stop Loss: Above the broken
fib retracement + MACD confirmation zone.
👉 In simple words: CAD/CHF is crashing,
and technicals (Fibonacci + MACD crossover)
confirm the bearish momentum.
Rocket boost this content to learn more.
Disclaimer: Please use a simulation
trading account before you trade with
real money because trading is risky.

CADCHF 1D | Market OutlookPotential for a bullish pullback on the CADCHF 1D which could lead to a price movement towards the resistance level at 0.60000. BUY levels from 0.57600

CAD/CHF BEARS ARE STRONG HERE|SHORT
Hello, Friends!
We are going short on the CAD/CHF with the target of 0.578 level, because the pair is overbought and will soon hit the resistance line above. We deduced the overbought condition from the price being near to the upper BB band. However, we should use low risk here because the 1W TF is green and gives us a counter-signal.
Disclosure: I am part of Trade Nation's Influencer program and receive a monthly fee for using their TradingView charts in my analysis.
✅LIKE AND COMMENT MY IDEAS✅

CAD/CHF SHORT FROM RESISTANCE
Hello, Friends!
CAD/CHF pair is in the downtrend because previous week’s candle is red, while the price is evidently rising on the 12H timeframe. And after the retest of the resistance line above I believe we will see a move down towards the target below at 0.579 because the pair is overbought due to its proximity to the upper BB band and a bearish correction is likely.
Disclosure: I am part of Trade Nation's Influencer program and receive a monthly fee for using their TradingView charts in my analysis.
✅LIKE AND COMMENT MY IDEAS✅

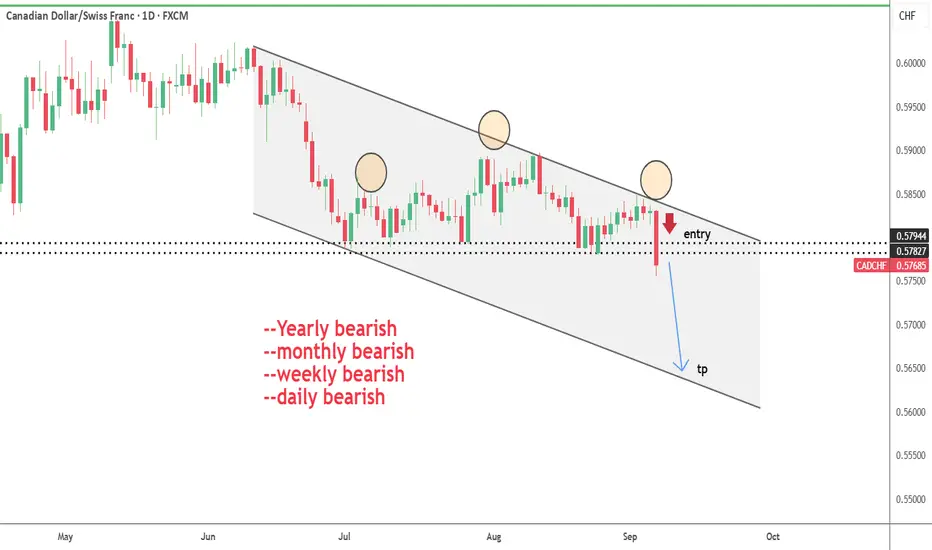
CADCHF--Descending channel--yearly bearish
--monthly bearish
--weekly bearish
--daily bearish
--tp and entry levels are as shown on chart
--also check the chart I published 24 Aug. below.
CAD/CHF – Bullish Channel in PlayCAD/CHF – Bullish Channel in Play
Price is moving inside a rising channel, showing a clear bullish trend.
The pair is expected to rise further to the first target area at 1.6840.
If the momentum continues, the next possible target is 0.6850.
As long as price stays within the channel, the bias remains bullish. Watch for reactions near the target zones—these could act as resistance and trigger short-term pullbacks.
Be careful: A break below the channel could shift the bias to bearish, so keep an eye on support levels.
You may find more details in the chart!
Thank you and Good Luck!
PS: Please support with a like or comment if you find this analysis useful for your trading day

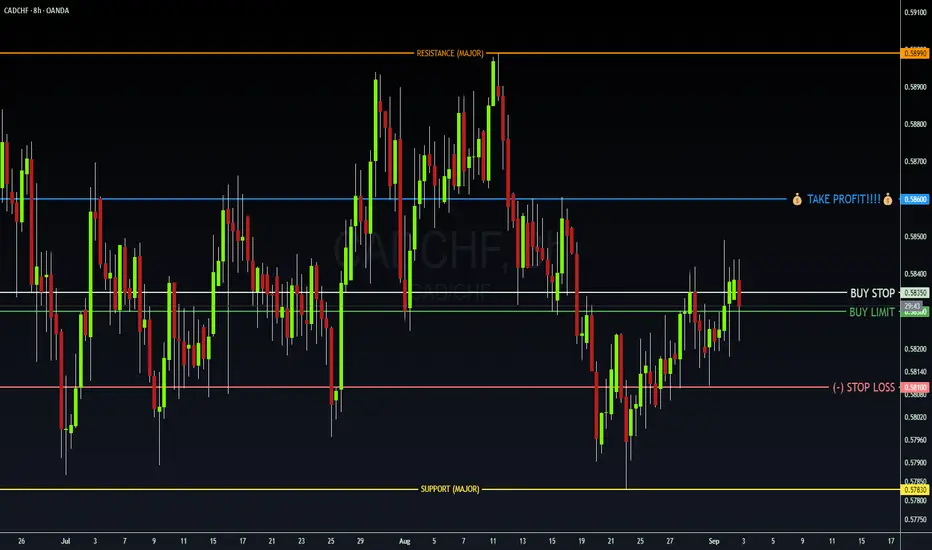
CADCHF 8H TECHNICAL ANALYSISOVERALL TREND
📈 Short-term bullish momentum
— price bouncing from support with upside potential toward resistance.
🎯 ENTRIES
🟢 Buy Limit: 0.5830
🟢 Buy Stop: 0.5835
🎯 TARGETS (TAKE PROFIT)
💰 TP 1: 0.5860 (short-term target)
💰 TP 2: 0.5899 (major resistance)
🔴 STOP LOSS
🔻 SL: 0.5810
📊 STRUCTURAL NOTES
Market consolidating above 0.5820, showing bullish buildup.
Double confirmation: Buy Stop triggers on breakout, Buy Limit catches retracement.
Key rejection zone: 0.5860 (expect reaction).
Major resistance: 0.5899 (potential final target).
SL placed below rejection wick cluster (0.5810).
🧪 TRADE OUTLOOK
Bias: Bullish toward 0.5860 → 0.5899
Risk/reward = favorable (approx 1:2)
If price closes below 0.5810, bullish structure invalid
⚡ SIGNAL FORMAT
PAIR: CADCHF
BUY LIMIT: 0.5830
BUY STOP: 0.5835
TP: 0.5860 → 0.5899
SL: 0.5810
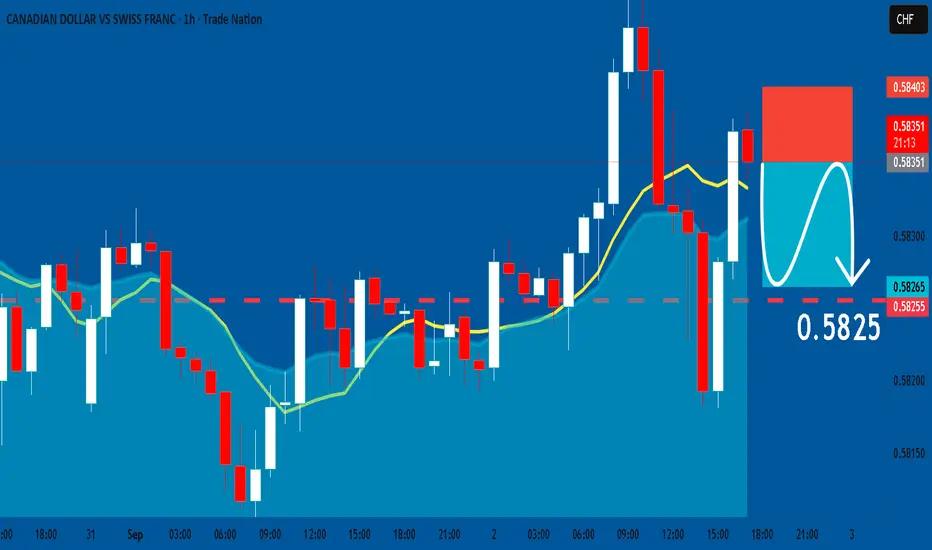
CADCHF: Short Signal Explained
CADCHF
- Classic bearish pattern
- Our team expects retracement
SUGGESTED TRADE:
Swing Trade
Sell CADCHF
Entry - 0.5835
Stop - 0.5840
Take - 0.5825
Our Risk - 1%
Start protection of your profits from lower levels
Disclosure: I am part of Trade Nation's Influencer program and receive a monthly fee for using their TradingView charts in my analysis.
❤️Please, support our work with like & comment!❤️
CADCHF ShortI see a pattern forming similar to previous price move. A nice upside down cypher pattern, targeting the low. entering short on the daily tf.
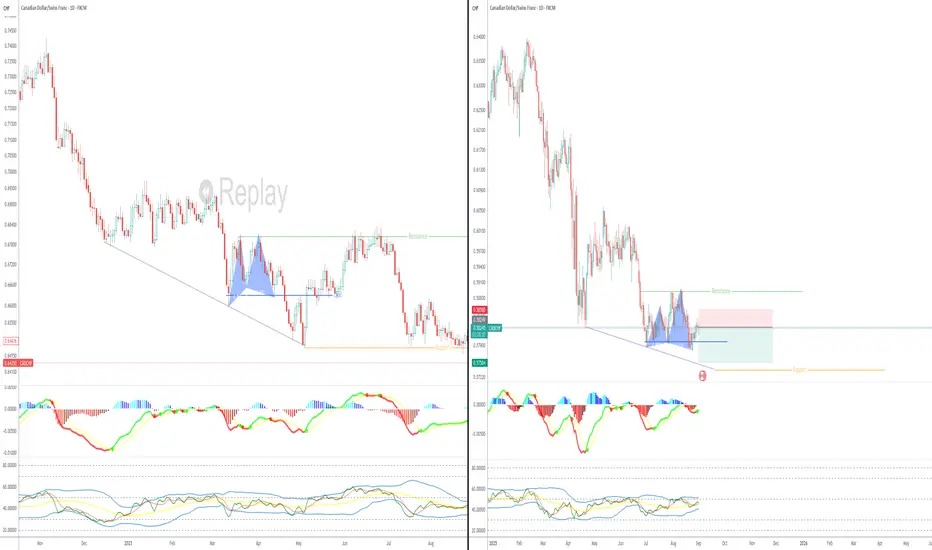
CADCHF REVERSAL Technically:
Bullish Divergence
Break bearish trendline and retest
printed 1st higher high
strong support just above SL
CADCHF- BUY IDEAPrice found support one more time. Technically, I anticipate a bullish price action to develop away from that level.
Next possible pullback level is 0.60162
