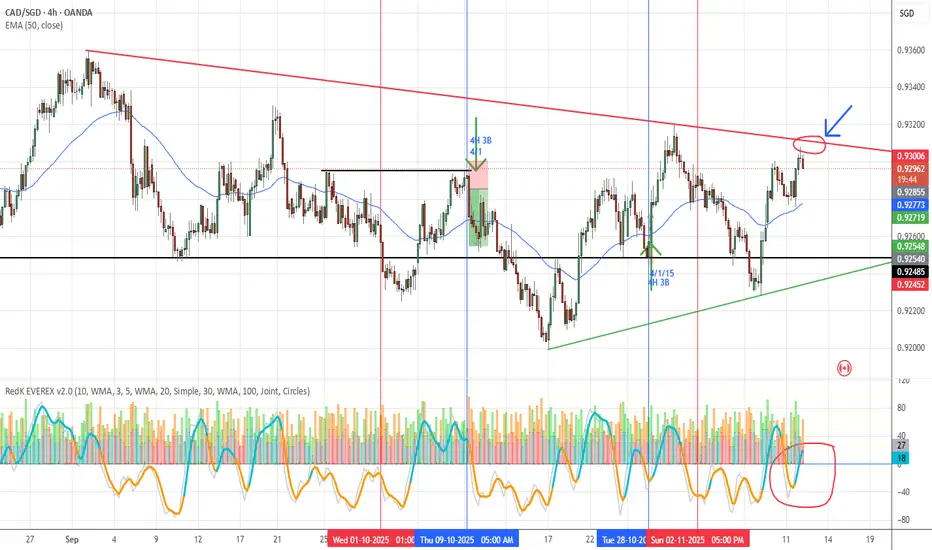
CADSGD – 4H Chart: Watching for 3rd Touch on Downtrend LineGood morning,
Price is approaching the 3rd bounce area of the downward trendline on the 4-hour chart — a key structure zone to watch.
At the moment, momentum is still pointing up, which means buyers are still showing strength.
Before we consider any short setups, we’ll need to see momentum flatten
Related currencies
CADSGD – Watching 4H Resistance ZoneCADSGD is sitting at a strong resistance zone on the 4H chart, where price has just printed multiple shooting star candles.
Current conditions:
✅ Momentum is elevated and could be turning down
✅ Structure shows rejection with SS candles
⏳ Still waiting for volume to push over 75
⏳ Need an engul

SGDCAD: Price Holds Above Daily HTLKey Observations
Daily Timeframe:
Price tested this daily HTL as resistance a few times. The last break was very strong.
After price reverted below this daily HTL, it did not make a new lower low. Instead, it traded above this level rather quickly.
Overall, this gives me an indication that se

CAD/SGD — WatchlistPrice broke above resistance and is now pulling back to retest that zone as support. I’m watching for upside VMS alignment: Volume picking up, Momentum turning/holding higher, and a clean bullish engulfing off the retest.
If/Then (4H):
If we get bullish engulfing + improving V/M and price accepts

CAD/SGD – Watchlist Update The recent break of structure wasn’t convincing enough for us to consider it a valid shift.
There was no strong momentum behind the move, and price failed to show commitment to the downside.
We’ll continue to watch for a more decisive break, followed by a clean pullback into resistance.
Only then w

CAD/SGD – Watching for Pullback Setup (4H Chart)
Price action is currently breaking through a strong support zone, which may now act as resistance.
From here, we’re watching to see if price continues lower and forms a clear structural pattern. If that happens, we’ll then look for a pullback into the newly formed resistance zone.
Only if we get

CAD/SGD – Setup WatchWe’re closely watching CAD/SGD for a potential pullback into a major resistance zone — a level that has proven to be super strong in recent history.
If price pulls back cleanly into that area and the VMS criteria align (Volume, Momentum, Structure), this could shape up to be a high-probability setu

CAD/SGD SHORT Investment Opportunity
Hello everyone, I am Andrea Russo, a Forex Trader, and today I want to share with you a trading strategy that I am currently following on the CAD/SGD currency pair. This analysis is designed to help traders better understand the dynamics of this pair and optimize their trades.
CAD/SGD SHORT Posit

CAD/Singapore Dollar ShortSingapore:Asia´s Switzerland getting stronger on China´s boosting industry and strong copper
Canada weaker because of Trump´s tariffs and weaker economy
Rockets: Entries
Yellow zone is not stop zone.It is the zone where I sell more:i COVER MY SELLS in thise zone.
Your stop should be based on yo

$CADSGDAnother trade opportunity presented itself today. I'm going to link this to my previous published chart. The description is the same. Just found another entry candle per my strategy. Looking for price to retrace towards the target zone located on this chart.

See all ideas
Summarizing what the indicators are suggesting.
Oscillators
Neutral
SellBuy
Strong sellStrong buy
Strong sellSellNeutralBuyStrong buy
Oscillators
Neutral
SellBuy
Strong sellStrong buy
Strong sellSellNeutralBuyStrong buy
Summary
Neutral
SellBuy
Strong sellStrong buy
Strong sellSellNeutralBuyStrong buy
Summary
Neutral
SellBuy
Strong sellStrong buy
Strong sellSellNeutralBuyStrong buy
Summary
Neutral
SellBuy
Strong sellStrong buy
Strong sellSellNeutralBuyStrong buy
Moving Averages
Neutral
SellBuy
Strong sellStrong buy
Strong sellSellNeutralBuyStrong buy
Moving Averages
Neutral
SellBuy
Strong sellStrong buy
Strong sellSellNeutralBuyStrong buy
Displays a symbol's price movements over previous years to identify recurring trends.
Frequently Asked Questions
The current rate of CADSGD is 0.92467 SGD — it has decreased by −0.08% in the past 24 hours. See more of CADSGD rate dynamics on the detailed chart.
The value of the CADSGD pair is quoted as 1 CAD per x SGD. For example, if the pair is trading at 1.50, it means it takes 1.5 SGD to buy 1 CAD.
The term volatility describes the risk related to the changes in an asset's value. CADSGD has the volatility rating of 0.18%. Track all currencies' changes with our live Forex Heatmap and prepare for markets volatility.
The CADSGD showed a −0.33% fall over the past week, the month change is a −0.38% fall, and over the last year it has decreased by −4.01%. Track live rate changes on the CADSGD chart.
Learn how you can make money on rate changes in numerous trading ideas created by our community.
Learn how you can make money on rate changes in numerous trading ideas created by our community.
Currencies are usually traded through forex brokers — choose the one that suits your needs and go ahead. You can trade CADSGD right from TradingView charts — just log in to you broker account. Check out the list of our integrated brokers and find the best one for your needs and strategy.
When deciding to buy or sell currency one should keep in mind many factors including current geopolitical situation, interest rates, and other. But before plunging into a deep research, you can start with CADSGD technical analysis. The technical rating for the pair is sell today, but don't forget that markets can be very unstable, so don't stop here. According to our 1 week rating the CADSGD shows the strong sell signal, and 1 month rating is sell. See more of CADSGD technicals for a more comprehensive analysis.