Dax for tomorrowWatch that 23.5K area if it gets tested.Could get a bear trap below.Its tried to rally off it.Maybe it will.?Lets see what happens
DE40 trade ideas

Could the price reverse from here?DAX40 (DE40) is rising towards the pivot, which is a multi swing high resistance and could reverse to the 1st support, which acts as a pullback support.
Pivot: 24,650.07
1st Support: 23,406.35
1st Resistance: 25,104.61
Risk Warning:
Trading Forex and CFDs carries a high level of risk to your capital and you should only trade with money you can afford to lose. Trading Forex and CFDs may not be suitable for all investors, so please ensure that you fully understand the risks involved and seek independent advice if necessary.
Disclaimer:
The above opinions given constitute general market commentary, and do not constitute the opinion or advice of IC Markets or any form of personal or investment advice.
Any opinions, news, research, analyses, prices, other information, or links to third-party sites contained on this website are provided on an "as-is" basis, are intended only to be informative, is not an advice nor a recommendation, nor research, or a record of our trading prices, or an offer of, or solicitation for a transaction in any financial instrument and thus should not be treated as such. The information provided does not involve any specific investment objectives, financial situation and needs of any specific person who may receive it. Please be aware, that past performance is not a reliable indicator of future performance and/or results. Past Performance or Forward-looking scenarios based upon the reasonable beliefs of the third-party provider are not a guarantee of future performance. Actual results may differ materially from those anticipated in forward-looking or past performance statements. IC Markets makes no representation or warranty and assumes no liability as to the accuracy or completeness of the information provided, nor any loss arising from any investment based on a recommendation, forecast or any information supplied by any third-party.

GER30 H4 | Falling towards 50% Fibonacci supportBased on the H4 chart analysis, we could see the price fall to the buy entry at 23,984.95, which is an overlap support that lines up with he 50% Fibonacci retracement and could bounce from this level to the upside.
Stop loss is at 23,708.21, which is a pullback support that aligns with the 138.2% Fibonacci extension.
Take profit is at 24,462.60, which is a pullback resistance.
High Risk Investment Warning
Trading Forex/CFDs on margin carries a high level of risk and may not be suitable for all investors. Leverage can work against you.
Stratos Markets Limited (tradu.com ):
CFDs are complex instruments and come with a high risk of losing money rapidly due to leverage. 65% of retail investor accounts lose money when trading CFDs with this provider. You should consider whether you understand how CFDs work and whether you can afford to take the high risk of losing your money.
Stratos Europe Ltd (tradu.com ):
CFDs are complex instruments and come with a high risk of losing money rapidly due to leverage. 66% of retail investor accounts lose money when trading CFDs with this provider. You should consider whether you understand how CFDs work and whether you can afford to take the high risk of losing your money.
Stratos Global LLC (tradu.com ):
Losses can exceed deposits.
Please be advised that the information presented on TradingView is provided to Tradu (‘Company’, ‘we’) by a third-party provider (‘TFA Global Pte Ltd’). Please be reminded that you are solely responsible for the trading decisions on your account. There is a very high degree of risk involved in trading. Any information and/or content is intended entirely for research, educational and informational purposes only and does not constitute investment or consultation advice or investment strategy. The information is not tailored to the investment needs of any specific person and therefore does not involve a consideration of any of the investment objectives, financial situation or needs of any viewer that may receive it. Kindly also note that past performance is not a reliable indicator of future results. Actual results may differ materially from those anticipated in forward-looking or past performance statements. We assume no liability as to the accuracy or completeness of any of the information and/or content provided herein and the Company cannot be held responsible for any omission, mistake nor for any loss or damage including without limitation to any loss of profit which may arise from reliance on any information supplied by TFA Global Pte Ltd.
The speaker(s) is neither an employee, agent nor representative of Tradu and is therefore acting independently. The opinions given are their own, constitute general market commentary, and do not constitute the opinion or advice of Tradu or any form of personal or investment advice. Tradu neither endorses nor guarantees offerings of third-party speakers, nor is Tradu responsible for the content, veracity or opinions of third-party speakers, presenters or participants.

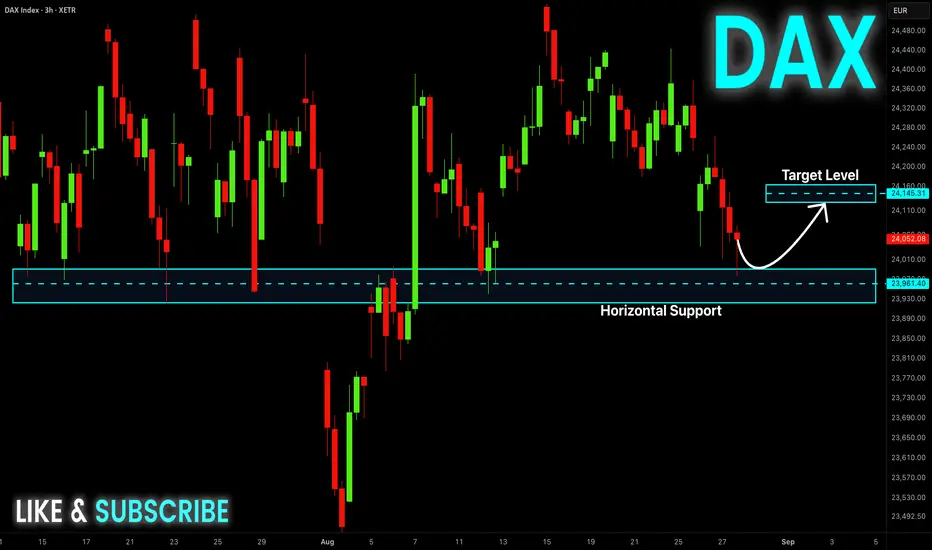
DAX Move Up Ahead! Buy!
Hello,Traders!
DAX is etching closer
Towards the horizontal
Support 23,930 so after
The retest we will be
Expecting a bullish move up
Buy!
Comment and subscribe to help us grow!
Check out other forecasts below too!
Disclosure: I am part of Trade Nation's Influencer program and receive a monthly fee for using their TradingView charts in my analysis.
Dax Bullish sideways consolidation?The DAX remains in a bullish trend, with recent price action indicating a potential oversold rally within the broader uptrend.
Support Zone: 23790 – a key level from previous consolidation. Price is currently testing or approaching this level.
A bullish rebound from 23790 would confirm ongoing upside momentum, with potential targets at:
24540 – initial resistance
24670 – psychological and structural level
24980 – extended resistance on the longer-term chart
Bearish Scenario:
A confirmed break and daily close below 23790 would weaken the bullish outlook and suggest deeper downside risk toward:
23610 – minor support
23400 – stronger support and potential demand zone
Outlook:
Bullish bias remains intact while the FTSE holds above 23790. A sustained break below this level could shift momentum to the downside in the short term.
This communication is for informational purposes only and should not be viewed as any form of recommendation as to a particular course of action or as investment advice. It is not intended as an offer or solicitation for the purchase or sale of any financial instrument or as an official confirmation of any transaction. Opinions, estimates and assumptions expressed herein are made as of the date of this communication and are subject to change without notice. This communication has been prepared based upon information, including market prices, data and other information, believed to be reliable; however, Trade Nation does not warrant its completeness or accuracy. All market prices and market data contained in or attached to this communication are indicative and subject to change without notice.

GER30Trend:** Trading inside a **downward sloping channel** → short-term bearish bias.
Resistance:** 24,350 – 24,500 (channel top).
Support:** 24,100 – 23,900 (channel bottom).
RSI:** \~47 → below neutral, showing mild bearish momentum.
Volume:** Flat overall, sellers slightly stronger on down moves.
**Outlook:**
* Likely bearish toward **24,100 → 23,900** unless price breaks above **24,500** with strong volume.
* Breakout above 24,500 = possible rally to **24,700 – 25,000**.
👉 Current bias: **Bearish within the channel**.

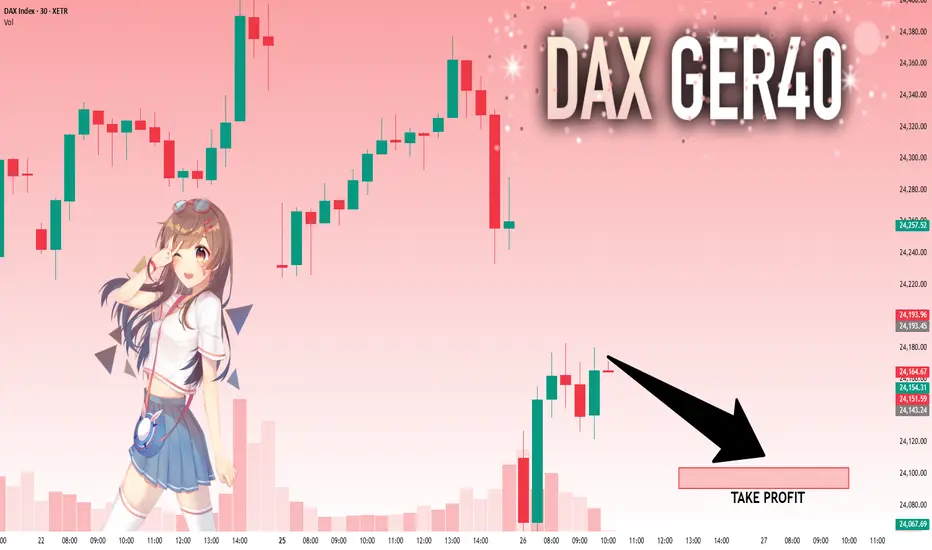
Triangle patternThe price has been consolidating for a while after breaking a bullish trendline, now the price has made a triangle pattern followed a small pullback, now the price looks ready to make a bearish move to the support area
WE ONLY TRADE PULLBACKS
GTradingMethod | GER40CASH (DE40) LONG SETUPI’m watching a possible inverse head & shoulders forming on the hourly chart and looking for a long entry if confirmed.
It will also be a good time for reversal with Europe markets opening at the close of this hour.
That gives it liquidity it needs to push up aggressively.
Some of the variables I will be looking for is 1) The hourly candle to close in the entry range and 2) Lower volume on this candle versus the trough of the left shoulders.
📊 Trade Plan:
Risk/Reward: 4.6
Entry: 24 236.3
Stop Loss: 24 194
Take Profit 1 (50%): 24 394
Take Profit 2 (50%): 24 480
💡 GTradingMethod Tip: Predefining your risk isn’t just a habit — it’s what keeps emotions out of trading and lets probability play out over time.
🙏 Thanks for checking out my post! Make sure to follow me to catch the next update. If you found this helpful, give it a like 👍 and share your thoughts 💬 — I’d love to hear what you think!
⚠️ Please note: This is not financial advice. This content is to track my trading journey and for educational purposes only.

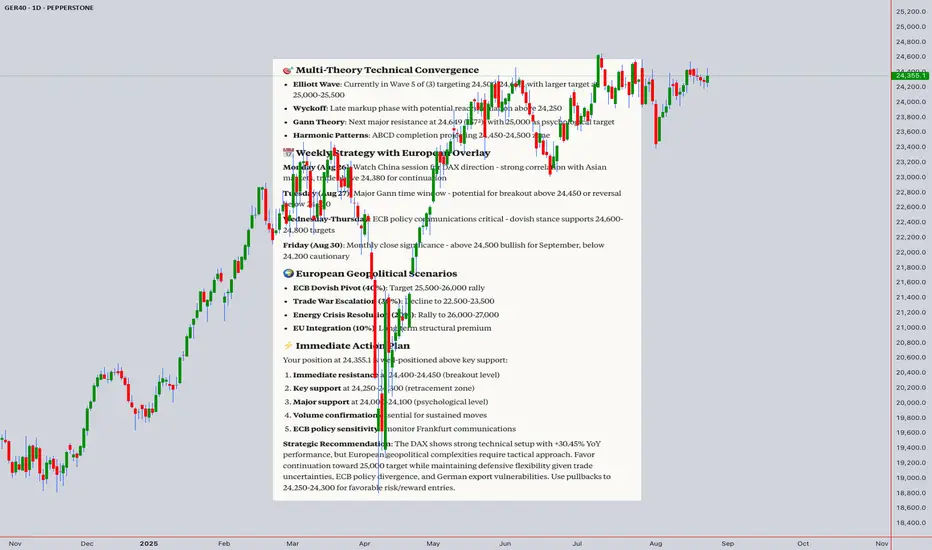
# GER40 Comprehensive Technical Analysis# GER40 Comprehensive Technical Analysis & European Geopolitical Strategy
**Current Position**: 24,355.1 (Aug 23, 2025, 12:50 AM UTC+4)
* 🎯 Executive Summary
GER40 at historically elevated levels showing strong annual performance (+30.45% YoY). Multiple theory convergence suggests continuation potential toward 25,000-25,500, but European geopolitical complexities and ECB policy uncertainty create mixed intermediate outlook requiring tactical approach.
---
# 🇪🇺 EUROPEAN GEOPOLITICAL & FUNDAMENTAL BACKDROP
*German Economic Context**
*# Structural Factors
*Industrial Powerhouse**: Manufacturing export dependency
*China Exposure**: Significant trade relationship vulnerability
*Energy Transition**: Green technology leadership opportunity
*Demographic Challenges**: Aging population impact on growth
*# Current Economic Health
*GDP Growth**: Modest expansion amid global headwinds
*Inflation**: Moderating but above ECB target
*Employment**: Strong labor market supporting consumption
*Export Performance**: Mixed due to global trade tensions
*European Central Bank Policy Environment**
*# Monetary Policy Stance
*Interest Rates**: Restrictive levels impacting growth
*QE Programs**: Reduced asset purchases
*Forward Guidance**: Data-dependent approach
*Currency Impact**: Euro strength affecting competitiveness
*# Policy Risk Factors
*Divergence from Fed**: Different inflation trajectories
*Fragmentation Risk**: Southern European bond spreads
*Banking Sector**: Credit conditions tightening
*Political Pressure**: Member state fiscal concerns
*Geopolitical Risk Matrix**
*# Regional Tensions
*Russia-Ukraine**: Ongoing conflict affecting energy/trade
*Trade Wars**: US tariff policies under Trump administration
*China Relations**: Balancing trade vs. security concerns
*Brexit Aftermath**: UK-EU relationship stability
*# European Integration
*Fiscal Union**: Progress on common debt instruments
*Defense Cooperation**: Increased military spending
*Migration Policy**: Political stability implications
*Green Deal**: Massive investment program impact
---
# 📊 MULTI-TIMEFRAME TECHNICAL ANALYSIS
*INTRADAY ANALYSIS (5M - 4H)**
*# **5-Minute Timeframe Analysis**
** Candlestick Patterns
*Current Formation**: Consolidation after recent strength
*Key Patterns**:
*Hammer below 24,300**: Bullish reversal signal
*Shooting Star above 24,400**: Profit-taking warning
*Doji at 24,350**: Indecision at current levels
*Volume Analysis**: Below average, suggesting institutional pause
** Technical Indicators (5M)
*RSI(14)**: 55-60 (Neutral momentum)
*VWAP**: 24,340 ± 20 (Dynamic support/resistance)
*Bollinger Bands**: Middle band at 24,335, slight expansion
*EMA(20)**: 24,325 (immediate support)
** 5M Trading Setup
*Long Entry**: Break above 24,380 with volume >150% avg
*Stop Loss**: Below 24,310 (70 point risk)
*Target 1**: 24,450 (R:R 1:1)
*Target 2**: 24,520 (R:R 1:2.4)
*# **15-Minute Timeframe Analysis**
** Harmonic Patterns
*Active Pattern**: Bullish Bat completion at 24,200-24,250
*ABCD Structure**: C-D leg targeting 24,450-24,500
*Fibonacci Levels**:
- 61.8% extension at 24,480
- 78.6% extension at 24,550
- 100% extension at 24,620
** Wyckoff Analysis (15M)
*Phase**: Reaccumulation after markup
*Character**: Smart money testing supply
*Volume Pattern**: Lower volume on pullbacks (bullish)
*Next Expected**: Continued markup if 24,250 holds
** 15M Strategy
*Pullback Entry**: 24,280-24,320 support zone
*Stop Loss**: Below 24,250 (30-70 point risk)
*Target 1**: 24,420 (R:R 1:2)
*Target 2**: 24,500 (R:R 1:4)
*# **30-Minute Timeframe Analysis**
** Elliott Wave Structure
*Primary Count**: Wave 5 of (3) in progress
- Wave 1: 23,800 → 24,200
- Wave 2: 24,200 → 24,000
- Wave 3: 24,000 → 24,400 (extended)
- Wave 4: 24,400 → 24,250 (shallow)
- Wave 5 Target: 24,500-24,650
** Alternative Count
*Wave (5) of larger degree**: Targeting 25,000-25,500
*Correction Risk**: If above 24,600, watch for exhaustion
*Invalidation**: Below 24,100 negates bullish structure
** W.D. Gann Analysis (30M)
*Square of 9**:
- 24,336 = 156² ÷ 10 (current level)
- 24,649 = 157² ÷ 10 (next resistance)
- 24,964 = 158² ÷ 10 (major target)
*Time Theory**: Next major window Aug 28-30
*Angle Theory**: 1x1 Gann line at 24,000 (major support)
*# **1-Hour Timeframe Analysis**
** Ichimoku Kinko Hyo
*Tenkan-sen (9)**: 24,360 (dynamic resistance)
*Kijun-sen (26)**: 24,280 (key support)
*Kumo Cloud**: 24,150-24,250 (support zone)
*Chikou Span**: Above price action (bullish)
*Future Cloud**: Bullish configuration continuing
** Moving Average Matrix
*SMA(20)**: 24,290
*EMA(20)**: 24,320
*SMA(50)**: 24,180
*EMA(50)**: 24,220
*SMA(200)**: 23,800
*Configuration**: All bullish alignment maintained
** 1H Position Strategy
*Bull Flag Pattern**: Breakout above 24,400
*Entry**: 24,420 with volume confirmation
*Stop**: 24,250 (170 point risk)
*Target 1**: 24,600 (R:R 1:1.06)
*Target 2**: 24,750 (R:R 1:1.94)
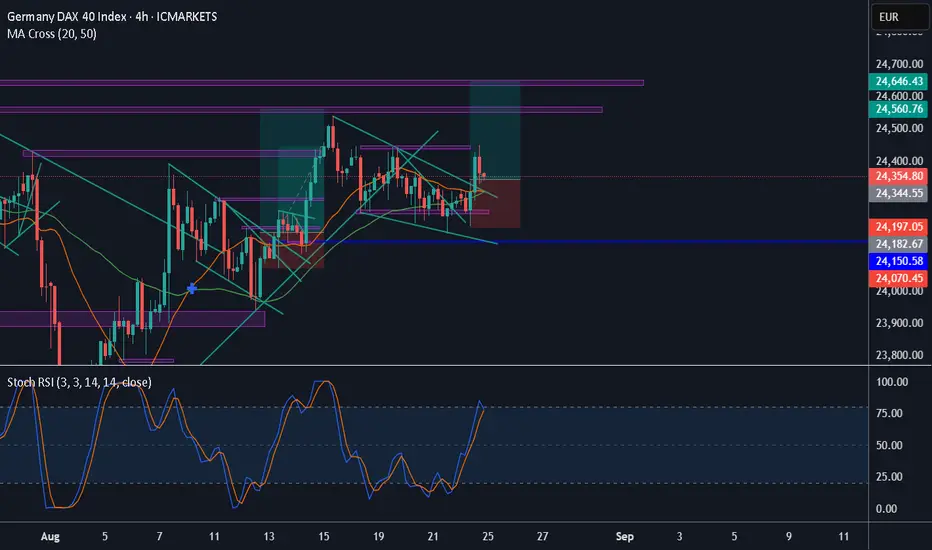
*# **4-Hour Timeframe Analysis**
** Advanced Pattern Recognition
*Ascending Triangle**: Base at 24,000, apex at 24,400
*Cup Formation**: Potential handle development
*Volume Profile**: Point of Control at 24,200
*Key Levels**:
*Major Support**: 24,000-24,100
*Minor Support**: 24,250-24,300
*Minor Resistance**: 24,400-24,450
*Major Resistance**: 24,600-24,700
** 4H Swing Strategy
*Pattern**: Bullish continuation setup
*Entry Zone**: 24,200-24,300 on pullbacks
*Stop Loss**: Below 24,000 (200-300 point risk)
*Target 1**: 24,650 (R:R 1:1.2)
*Target 2**: 25,000 (R:R 1:2.5)
*Target 3**: 25,350 (R:R 1:4)
---
# 📈 SWING ANALYSIS (Daily - Monthly)
*Daily Timeframe**
*# Elliott Wave Daily Structure
*Supercycle**: Wave (V) from 2009 lows continuation
*Cycle**: Wave 5 of (V) in final extension phase
*Primary**: Wave (3) of 5 targeting 25,500-26,000
*Current Status**: Mid-stage of primary wave advance
*# German DAX Historical Context
*All-Time Highs**: Recently achieved new records
*Long-term Trend**: Intact since 2009 crisis lows
*Resistance Levels**: Psychological 25,000 critical
*Support Structure**: 23,500-24,000 major zone
*# Wyckoff Daily Analysis
*Phase**: Late markup phase
*Accumulation**: Completed in 2022-2023 bear market
*Distribution Signals**: Not yet apparent
*Professional Activity**: Continued institutional buying
*# Gann Daily Forecasting
*Annual Cycle**: Traditionally strong Q3-Q4 for DAX
*Master Numbers**:
- 25,000 (major psychological resistance)
- 25,600 = 160² (Gann square target)
- 26,244 = 162² (extended projection)
*Time Cycles**: 180-day cycle bullish through year-end
*Weekly Timeframe**
*# Major Elliott Wave Structure
*Grand Supercycle**: Wave (III) from 1932 lows
*Supercycle**: Wave (V) of III in final stages
*Long-term Target**: 27,000-30,000 (secular peak)
*# Weekly Harmonic Analysis
*Shark Pattern**: Potential completion 25,800-26,200
*Butterfly Extension**: Maximum target 26,500-27,000
*ABCD Projects**: 1.272 extension at 25,400
*# European Sector Leadership
*Technology**: SAP, ASML driving performance
*Industrials**: Siemens, manufacturing strength
*Automotive**: Transition to EV leadership
*Financials**: ECB policy sensitivity
*Monthly Timeframe**
*# Macro Structural Analysis
*Primary Degree**: Final wave of multi-decade advance
*Completion Timeline**: Peak likely 2025-2026
*Post-Peak Risk**: Significant correction potential
*Demographic Headwinds**: Long-term growth challenges
*# Monthly Indicators
*RSI**: 65 (Elevated but not extreme)
*MACD**: Bullish momentum continuing
*Volume**: Institutional participation confirming
*Breadth**: German mid-caps participating
---
# 🎯 CRITICAL LEVELS & TARGETS
*Immediate Levels (24-48 Hours)**
*# Resistance Hierarchy
*R1**: 24,400-24,420 (immediate ceiling)
*R2**: 24,500-24,520 (psychological)
*R3**: 24,650-24,700 (measured move)
*R4**: 24,800-24,850 (extension)
*# Support Framework
*S1**: 24,280-24,300 (immediate floor)
*S2**: 24,200-24,250 (key retracement)
*S3**: 24,100-24,150 (major support)
*S4**: 24,000-24,050 (critical psychological)
*Short-term Projections (1-2 Weeks)**
*# Bullish Scenario (65% Probability)
*Target 1**: 24,600-24,750
*Target 2**: 24,900-25,100
*Target 3**: 25,200-25,400
*Catalysts**: ECB dovishness, China trade progress
*# Bearish Scenario (35% Probability)
*Target 1**: 23,800-24,000
*Target 2**: 23,500-23,700
*Target 3**: 23,200-23,400
*Catalysts**: ECB hawkishness, trade war escalation
---
# 📅 DAILY TRADING STRATEGIES WITH EUROPEAN OVERLAY
*MONDAY, AUGUST 26, 2025**
*# European Market Context
*ECB Watch**: Any policy communications from Frankfurt
*China Trade**: German export sensitivity to Asian developments
*Energy Prices**: Russian gas relationship impact
*Euro Strength**: Export competitiveness concerns
*# Opening Dynamics
*Asian Session**: China performance critical for DAX
*Currency Impact**: EUR/USD strength headwind for exports
*Gap Assessment**: Likely modest gap based on overnight news
*# **Trading Strategies**
** Setup 1: European Opening Gap
*Gap Up Scenario**: Above 24,380
- Entry: First pullback to 24,350-24,370
- Stop: 24,310 (40-60 point risk)
- Target: 24,480-24,520 (R:R 1:2)
** Setup 2: Export Sensitivity Play
*USD/EUR Strength**: Headwind for German exporters
*Strategy**: Fade strength on currency concerns
*Entry**: 24,400-24,420 resistance
*Target**: 24,280-24,320
** Setup 3: China Correlation
*Shanghai Performance**: Direct DAX correlation
*Bullish China**: Long DAX continuation
*Bearish China**: Defensive positioning
*# Risk Management Monday
*European Time Zones**: Active 8:00-16:30 CET
*News Sensitivity**: ECB officials, German data
*Position Size**: Standard risk given stable environment
---
*TUESDAY, AUGUST 27, 2025**
*# Technical Focus
*Gann Time Window**: Potential reversal date
*Pattern Completion**: Triangle/flag resolution expected
*Volume Analysis**: Institutional participation critical
*# **Primary Strategies**
** Setup 1: Breakout Confirmation
*Above 24,450**: Acceleration likely
- Entry: 24,470 with volume >150%
- Stop: 24,380 (90 point risk)
- Target 1: 24,600 (R:R 1:1.4)
- Target 2: 24,750 (R:R 1:3.1)
** Setup 2: Failed Breakout
*Rejection at 24,450**: Distribution signal
- Entry: Break below 24,320
- Stop: 24,380 (60 point risk)
- Target: 24,150-24,200 (R:R 1:2)
** Setup 3: Range Development
*Consolidation**: 24,250-24,450
*Buy Low**: 24,280-24,320
*Sell High**: 24,400-24,430
*Stops**: Outside range limits
---
*WEDNESDAY, AUGUST 28, 2025**
*# Mid-Week European Dynamics
*ECB Policy**: Watch for hawkish/dovish signals
*German Data**: Industrial production, business confidence
*Trade Relations**: US-Germany tariff developments
*# **Strategy Focus**
** Setup 1: ECB Policy Response
*Dovish ECB**: Bullish for equities
- Target: 24,600-24,800
- Strategy: Buy pullbacks aggressively
*Hawkish ECB**: Risk-off environment
- Target: 23,900-24,100
- Strategy: Short rallies, defensive sectors
** Setup 2: German Economic Data
*Strong Data**: Manufacturing strength confirmation
*Weak Data**: Global slowdown concerns
*Mixed Data**: Range-bound trading likely
---
*THURSDAY, AUGUST 29, 2025**
*# Pre-Weekend Positioning
*Month-End Flows**: Institutional rebalancing
*German Bund Impact**: Bond-equity relationship
*Export Orders**: Forward-looking indicators
*# **Advanced Strategies**
** Setup 1: Month-End Positioning
*Strong Close >24,400**: Bullish monthly signal
*Weak Close <24,200**: Caution for September
*Volume Critical**: For signal validation
** Setup 2: Sector Rotation
*Technology Leadership**: SAP, Infineon performance
*Industrial Strength**: Siemens, manufacturing
*Automotive Transition**: EV theme continuation
---
*FRIDAY, AUGUST 30, 2025**
*# Monthly Close Significance
*Technical Importance**: Long-term chart patterns
*Institutional Activity**: Quarter-end approaching
*Weekend Risk**: European geopolitical developments
*# **End-of-Week Strategies**
** Setup 1: Monthly Close Play
*Above 24,500**: September bullish setup
*Below 24,200**: Defensive September positioning
*Volume Confirmation**: Essential for validity
** Setup 2: Weekend Risk Management
*Geopolitical Headlines**: Reduce exposure if tense
*Economic Calendar**: Major data releases Monday
*Position Sizing**: Conservative over weekend
---
# 🇪🇺 EUROPEAN GEOPOLITICAL SCENARIO PLANNING
*Scenario 1: ECB Dovish Pivot (40% Probability)**
*# Triggers
*Inflation Decline**: Below 2% target sustainably
*Growth Concerns**: German recession risk
*Employment Weakness**: Labor market deterioration
*# DAX Impact
*Target**: 25,500-26,000 (5-7% rally)
*Timeline**: 2-4 months
*Sectors**: Banks negative, Tech/Growth positive
*Currency**: Euro weakness, export competitiveness
*# Trading Strategy
*Growth Positioning**: Technology, discretionary
*Export Play**: German multinational corporations
*Rate Sensitive**: REITs, utilities outperform
*Duration**: Long-term bullish positioning
*Scenario 2: Trade War Escalation (30% Probability)**
*# Catalysts
*US Tariffs**: Trump administration aggressive stance
*China Retaliation**: German export impact
*Supply Chain**: Manufacturing disruption
*# Market Impact
*DAX Target**: 22,500-23,500 (7-10% decline)
*Timeline**: 1-3 months
*Vulnerability**: Export-dependent companies
*Safe Havens**: Domestic-focused sectors
*# Trading Strategy
*Defensive Sectors**: Utilities, consumer staples
*Short Exports**: Automotive, industrials
*Currency Hedge**: USD strength plays
*Volatility**: Increased option premiums
*Scenario 3: Energy Crisis Resolution (20% Probability)**
*# Positive Developments
*Russian Relations**: Diplomatic progress
*Alternative Sources**: LNG infrastructure
*Green Transition**: Accelerated renewable adoption
*# DAX Implications
*Target**: 26,000-27,000 (8-12% rally)
*Leadership**: Energy-intensive industries
*Currency**: Euro strength potential
*Inflation**: Reduced energy cost pressures
*# Strategy Framework
*Industrial Revival**: Chemical, steel, manufacturing
*Energy Transition**: Green technology leaders
*Currency Play**: Euro strength beneficiaries
*Long Duration**: Multi-year positive theme
*Scenario 4: EU Integration Deepening (10% Probability)**
*# Structural Changes
*Fiscal Union**: Common debt issuance
*Defense Integration**: Military spending increase
*Capital Markets**: Single European market
*# Long-term Impact
*DAX Premium**: European integration multiple
*Sector Benefits**: Defense, infrastructure, banking
*Currency**: Euro as global reserve currency
*Timeline**: Multi-year structural theme
---
# ⚠️ COMPREHENSIVE RISK MANAGEMENT
*European-Specific Risk Framework**
*# Economic Risks
*German Recession**: Export-dependent vulnerability
*ECB Policy Error**: Premature tightening/easing
*Energy Dependence**: Geopolitical supply disruption
*Demographics**: Aging population, labor shortages
*# Political Risks
*Coalition Stability**: German government durability
*EU Integration**: Member state disagreements
*Populist Movements**: Anti-establishment sentiment
*Brexit Aftermath**: Trade relationship evolution
*Technical Risk Management**
*# Position Sizing Framework
*High Uncertainty**: 25-50% normal size
*Moderate Risk**: 50-75% normal size
*Stable Environment**: 75-100% normal size
*Crisis Mode**: 0-25% normal size
*# Stop Loss Methodology
*News-Driven**: Wider stops during ECB meetings
*Technical**: Support/resistance based
*Time-Based**: Intraday management
*Volatility**: ATR-adjusted stop distances
---
# 📊 PERFORMANCE MONITORING & ADAPTATION
*European Market Correlations**
*# Cross-Asset Analysis
*EUR/USD**: Inverse correlation with DAX exports
*German Bund**: Flight-to-quality during stress
*STOXX 600**: Regional market leadership
*Commodities**: Industrial input cost sensitivity
*# Sector Rotation Monitoring
*Technology**: Global growth proxy
*Industrials**: Domestic demand strength
*Financials**: ECB policy sensitivity
*Utilities**: Defensive characteristics
*Economic Calendar Integration**
*# High Impact Events
*ECB Meetings**: Every 6 weeks, policy changes
*German Data**: Industrial production, employment
*EU Summits**: Political integration progress
*Trade Negotiations**: Tariff policy changes
---
# 🚨 CRITICAL DECISION POINTS
*Immediate Technical Triggers (24-48 Hours)**
*# Bullish Catalysts
*24,450 Break**: Acceleration to 24,650-24,800
*Volume Surge**: >200% average confirms move
*ECB Dovish**: Policy pivot supportive
*# Bearish Warnings
*24,200 Break**: Correction to 23,800-24,000
*Volume Divergence**: Distribution signals
*Trade War News**: Export sensitivity acute
*Weekly Watchpoints**
*# Elliott Wave Validation
*Above 24,600**: Wave 5 extension continuing
*Below 24,000**: Correction wave beginning
*Volume Pattern**: Institutional commitment level
*# Geopolitical Escalation
*Energy Crisis**: Supply disruption impact
*Trade Tensions**: Export sector vulnerability
*ECB Communication**: Policy direction clarity
---
# 🎯 STRATEGIC FRAMEWORK SUMMARY
*Base Case (European Stability - 40%)**
*Range**: 24,000-25,000 for 2-4 months
*Strategy**: Range trading, sector rotation
*ECB**: Gradual policy normalization
*Bull Case (Integration/Recovery - 35%)**
*Target**: 25,500-26,500 by Q4 2025
*Strategy**: Growth momentum, technology leadership
*Catalysts**: ECB cuts, trade progress, energy security
*Bear Case (Crisis/Recession - 25%)**
*Target**: 22,000-23,500 correction
*Strategy**: Defensive positioning, safe havens
*Triggers**: ECB hawkishness, trade war, energy crisis
---
**⚡ EXECUTION SUMMARY**: GER40 at 24,355.1 represents strong YoY performance (+30.45%) but faces complex European geopolitical and economic crosscurrents. Technical analysis suggests continuation potential toward 25,000, but ECB policy uncertainty, trade tensions, and energy dependencies require careful risk management. Favor tactical trading over strategic positioning until clearer European policy direction emerges. Monitor ECB communications, German economic data, and trade developments as primary market drivers.
For those interested in further developing their trading skills based on these types of analyses, consider exploring the mentoring program offered by Shunya dot Trade.(world wide web shunya dot trade)
I welcome your feedback on this analysis, as it will inform and enhance my future work.
Regards,
Shunya.Trade
world wide web shunya dot trade
⚠️ Disclaimer: This post is educational content and does not constitute investment advice, financial advice, or trading recommendations. The views expressed here are based on technical analysis and are shared solely for informational purposes. The stock market is subject to risks, including capital loss, and readers should exercise due diligence before investing. We do not take responsibility for decisions made based on this content. Consult a certified financial advisor for personalized guidance.
Falling ChannelThe price formed a falling wedge in this corrective state and now the price has broken out, followed by a pullback, now the price looks ready for a bullish impulse
WE ONLY TRADE PULLBACKS
DAX: Move Up Expected! Long!
My dear friends,
Today we will analyse DAX together☺️
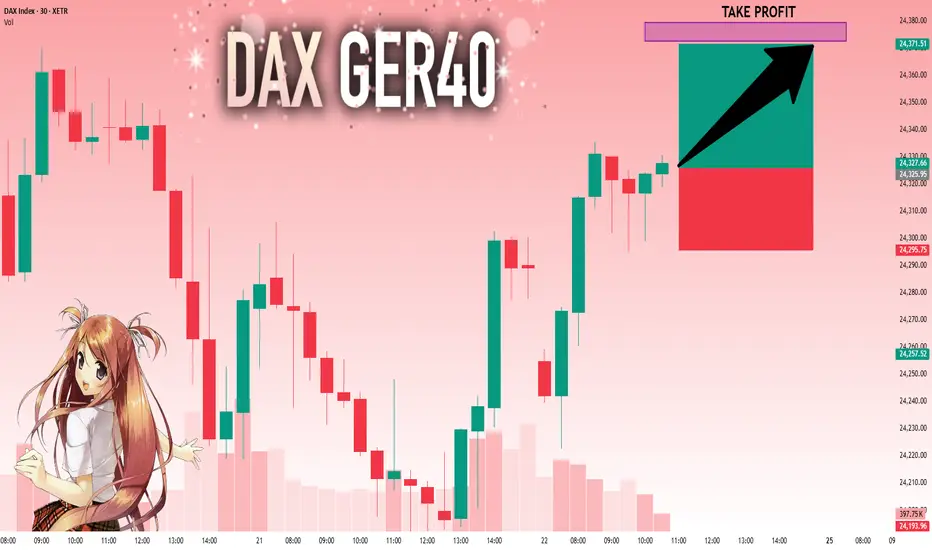
The recent price action suggests a shift in mid-term momentum. A break above the current local range around 24,325.95 will confirm the new direction upwards with the target being the next key level of 24,372.55 and a reconvened placement of a stop-loss beyond the range.
❤️Sending you lots of Love and Hugs❤️
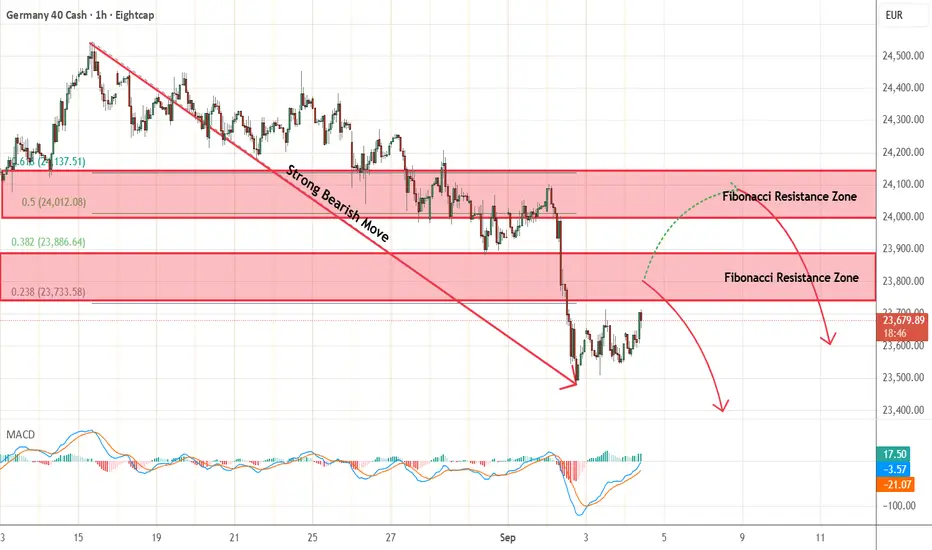
Dax - Short Term Sell IdeaH1 - Strong bearish move.
No opposite signs.
Currently it looks like a pullback is happening.
Expecting bearish continuation until the two Fibonacci resistance zones hold.
If you enjoy this idea, don’t forget to LIKE 👍, FOLLOW ✅, SHARE 🙌, and COMMENT ✍! Drop your thoughts and charts below to keep the discussion going. Your support helps keep this content free and reach more people! 🚀
-------------------------------------------------------------------------------------------------------------------
GER30 H4 | Bullish reversal from major supportGER30 is reacting off the buy entry at 23,513.79, which is a multi swing low support and could reverse from this level to the take profit.
Stop loss is at 23,216.12, which is a pullback support.
Take profit is at 23,835.14, which is a pullback resistance that lines up with the 38.2% Fibonacci retracement.
High Risk Investment Warning
Trading Forex/CFDs on margin carries a high level of risk and may not be suitable for all investors. Leverage can work against you.
Stratos Markets Limited (tradu.com ):
CFDs are complex instruments and come with a high risk of losing money rapidly due to leverage. 65% of retail investor accounts lose money when trading CFDs with this provider. You should consider whether you understand how CFDs work and whether you can afford to take the high risk of losing your money.
Stratos Europe Ltd (tradu.com ):
CFDs are complex instruments and come with a high risk of losing money rapidly due to leverage. 66% of retail investor accounts lose money when trading CFDs with this provider. You should consider whether you understand how CFDs work and whether you can afford to take the high risk of losing your money.
Stratos Global LLC (tradu.com ):
Losses can exceed deposits.
Please be advised that the information presented on TradingView is provided to Tradu (‘Company’, ‘we’) by a third-party provider (‘TFA Global Pte Ltd’). Please be reminded that you are solely responsible for the trading decisions on your account. There is a very high degree of risk involved in trading. Any information and/or content is intended entirely for research, educational and informational purposes only and does not constitute investment or consultation advice or investment strategy. The information is not tailored to the investment needs of any specific person and therefore does not involve a consideration of any of the investment objectives, financial situation or needs of any viewer that may receive it. Kindly also note that past performance is not a reliable indicator of future results. Actual results may differ materially from those anticipated in forward-looking or past performance statements. We assume no liability as to the accuracy or completeness of any of the information and/or content provided herein and the Company cannot be held responsible for any omission, mistake nor for any loss or damage including without limitation to any loss of profit which may arise from reliance on any information supplied by TFA Global Pte Ltd.
The speaker(s) is neither an employee, agent nor representative of Tradu and is therefore acting independently. The opinions given are their own, constitute general market commentary, and do not constitute the opinion or advice of Tradu or any form of personal or investment advice. Tradu neither endorses nor guarantees offerings of third-party speakers, nor is Tradu responsible for the content, veracity or opinions of third-party speakers, presenters or participants.

DAX .The chart [attern to watchThat looks to be the chart pattern ...Uneless it breaks
Looks bullish.Maybe that fades
DAX consolidation suported at 23950The DAX remains in a bullish trend, with recent price action indicating a potential oversold rally within the broader uptrend.
Support Zone: 23400 – a key level from previous consolidation. Price is currently testing or approaching this level.
A bullish rebound from 23400 would confirm ongoing upside momentum, with potential targets at:
23950 – initial resistance
24116 – psychological and structural level
24250 – extended resistance on the longer-term chart
Bearish Scenario:
A confirmed break and daily close below 23400 would weaken the bullish outlook and suggest deeper downside risk toward:
23250 – minor support
23094 – stronger support and potential demand zone
Outlook:
Bullish bias remains intact while the Dax40 holds above 23950. A sustained break below this level could shift momentum to the downside in the short term.
This communication is for informational purposes only and should not be viewed as any form of recommendation as to a particular course of action or as investment advice. It is not intended as an offer or solicitation for the purchase or sale of any financial instrument or as an official confirmation of any transaction. Opinions, estimates and assumptions expressed herein are made as of the date of this communication and are subject to change without notice. This communication has been prepared based upon information, including market prices, data and other information, believed to be reliable; however, Trade Nation does not warrant its completeness or accuracy. All market prices and market data contained in or attached to this communication are indicative and subject to change without notice.

DAX.Looking bearish short termThe character of this short term Price could easily turn it bullish.Support needs to come in and turn it round

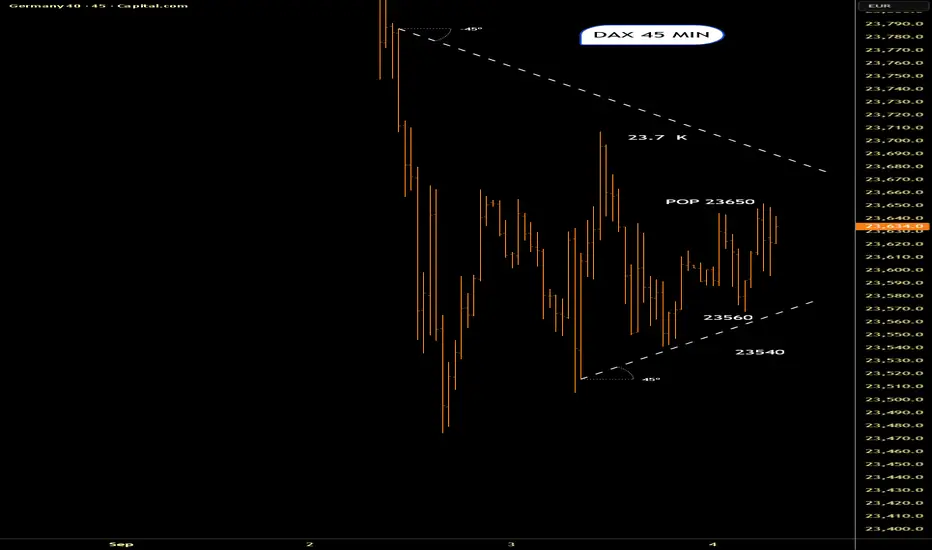
Dax,,,Will it catch a bidA fair bit of messing about around 23550.Could catch a bid tomorrow on good news.NFP on Friday


GER30 (DAX 40)GER30 (DAX 40) Bullish Outlook
The DAX 40 is showing steady strength, with buyers stepping in around 23,500. Momentum is building, and if it pushes past 23,800, we could see it testing 24,000 soon.
Pullbacks to support might be great spots to consider entering long, keeping an eye on how the market reacts. Overall, the vibe is bullish and the trend is looking healthy.

Weekly Technical Analysis- Germany 40 is range-bound at 23,938, under its VWAP of 24,213. RSI at 41 signals weaker momentum. Support at 23,00 is being tested while resistance is 24,524.
- UK 100 remains bullish but has pulled back from record highs down to its VWAP, trading at 9,193. RSI at 50 shows neutral momentum. Support is 9,042, resistance is 9,364.
- Wall Street has entered a new bullish trend and is consolidating under record highs, last at 45,550 above its VWAP 44,948. RSI at 64 leans bullish. Support is 43,934, resistance 45,962.
- Brent Crude is still in a choppy range, at 6,745 the price is back above its VWAP of 6,656. RSI at 51 reflects neutral momentum. Support stands at 6,490, resistance at 6,822.
- Gold has broken higher, trading at 3,447 above VWAP 3,368 and near the top of its 4-month range. RSI at 68 demonstrates the fresh bullish momentum. Support is 3,293, resistance is being
tested at 3,450.
- EUR/USD is testing the highs, trading at 1.1692 above VWAP 1.1692. RSI at 54 suggests balanced momentum. Support is 1.1596, resistance 1.1735.
- GBP/USD is consolidating in an extended correction of a bullish trend, trading at 1.3505 near VWAP 1.3500. RSI at 53 signals a stable tone. Support is 1.3405, resistance is 1.3581.
- USD/JPY stays range-bound at 147.00, now just below the VWAP at 147.45. RSI at 47 reflects a neutral outlook. Support is 146.60, resistance 148.27.
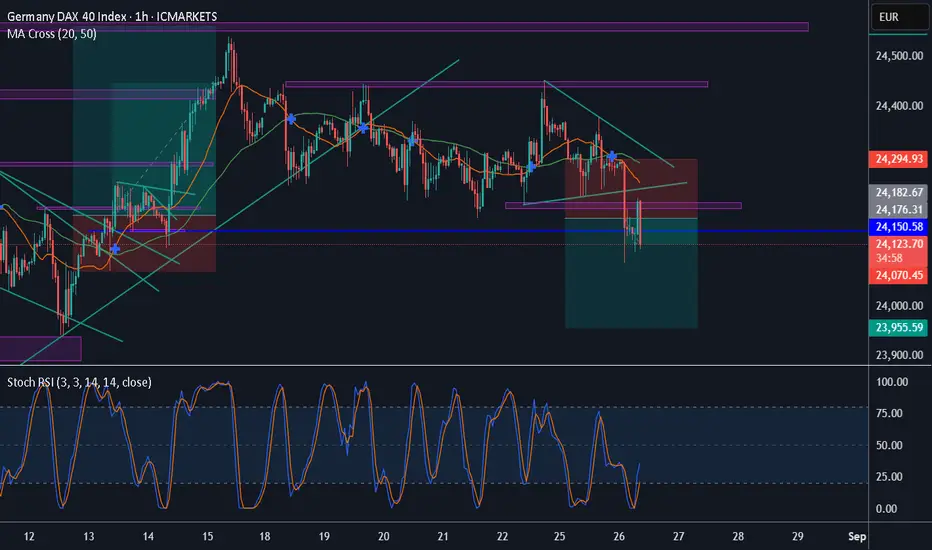
DAX: Will Go Down! Short!
My dear friends,
Today we will analyse DAX together☺️
The recent price action suggests a shift in mid-term momentum. A break below the current local range around 24,174.74 will confirm the new direction downwards with the target being the next key level of 24,103.39 and a reconvened placement of a stop-loss beyond the range.
❤️Sending you lots of Love and Hugs❤️
DAX is forming an interesting short-term patternLooking at the technical picture of DAX, we can see that the German index seems to be preparing for a breakout. Maybe Powell's speech could be that catalyst? Let's find out.
XETR:DAX
MARKETSCOM:DE30
Let us know what you think in the comments below.
Thank you.
75.2% of retail investor accounts lose money when trading CFDs with this provider. You should consider whether you understand how CFDs work and whether you can afford to take the high risk of losing your money. Past performance is not necessarily indicative of future results. The value of investments may fall as well as rise and the investor may not get back the amount initially invested. This content is not intended for nor applicable to residents of the UK. Cryptocurrency CFDs and spread bets are restricted in the UK for all retail clients.

DAX Corrective pullback supported at 23790The DAX remains in a bullish trend, with recent price action indicating a potential oversold rally within the broader uptrend.
Support Zone: 23790 – a key level from previous consolidation. Price is currently testing or approaching this level.
A bullish rebound from 23790 would confirm ongoing upside momentum, with potential targets at:
24540 – initial resistance
24670 – psychological and structural level
24980 – extended resistance on the longer-term chart
Bearish Scenario:
A confirmed break and daily close below 23790 would weaken the bullish outlook and suggest deeper downside risk toward:
23610 – minor support
23400 – stronger support and potential demand zone
Outlook:
Bullish bias remains intact while the FTSE holds above 23790. A sustained break below this level could shift momentum to the downside in the short term.
This communication is for informational purposes only and should not be viewed as any form of recommendation as to a particular course of action or as investment advice. It is not intended as an offer or solicitation for the purchase or sale of any financial instrument or as an official confirmation of any transaction. Opinions, estimates and assumptions expressed herein are made as of the date of this communication and are subject to change without notice. This communication has been prepared based upon information, including market prices, data and other information, believed to be reliable; however, Trade Nation does not warrant its completeness or accuracy. All market prices and market data contained in or attached to this communication are indicative and subject to change without notice.
