Dollar - Daily CLS - Model 1 - HTF FrameworkHi friends, new range created. As always we are looking for the manipulation in to the key level around the range. Don't forget confirmation switch from manipulation phase to the distribution phase to make the setup valid. Stay patient and enter only after change in order flow. If price reaches 50%
Related indices
DXY 1W — Weekly Impulse Completed, Compression Before ExpansionFundamental Snapshot
The 2026 narrative still supports a softer USD: rate-cut expectations + shrinking yield advantage + capital rotation.
Bounces can happen, but until major weekly highs are reclaimed, the macro backdrop stays corrective-to-bearish.
My Bias
The weekly impulse from the ma
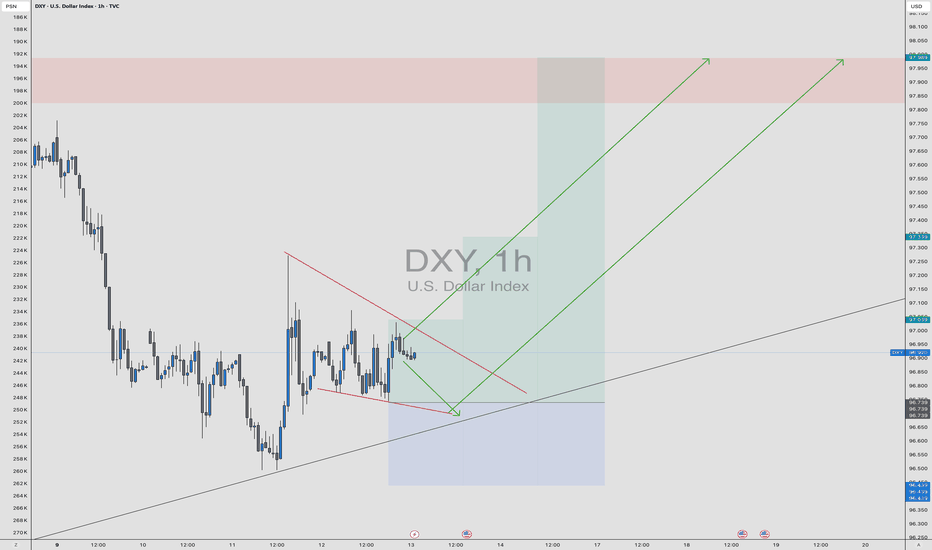
DXY Coiling for Expansion — Liquidity Grab Before the Move?DXY is currently compressing inside a descending wedge while holding above a rising trendline — a classic accumulation structure.
Price swept liquidity to the downside and reacted from higher-timeframe support, suggesting sellers are weakening. As long as the trendline holds, the probability shifts
Falling towards overlap support?US Dollar Index (DXY) is falling towards the pivot, which has been identified as an overlap support that aligns with the 61.8% Fibonacci retracement.
Pivot: 96.43
1st Support: 96.05
1st Resistance: 97.23
Disclaimer:
The opinions given above constitute general market commentary and do not constit
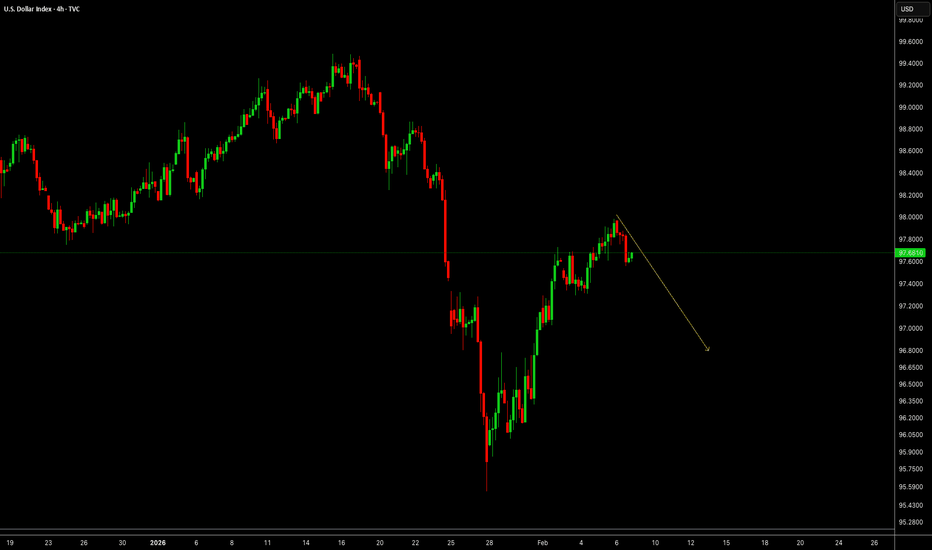
DXY – H4 | Short-Side Technical ContextThe U.S. Dollar Index recently completed a corrective bullish channel following a strong impulsive decline. Price respected the rising channel structure but failed to sustain acceptance near the upper boundary, indicating weak continuation strength.
A decisive move lower has now occurred, with pric
DXY: Lower lows or are we due for a bounce?Will the decline in US Unemployment boost TVC:DXY , or will the probability of further rate cuts push the price below support? Let's break down both scenarios and prepare a trading plan for either outcome.
Technicals:
- after tagging the 0.618 Fibonacci retracement, price action faced a sharp
US DOLLAR INDEX (DXY): Classic Breakout TradeThe Dollar Index successfully broke and closed above a significant daily horizontal resistance cluster earlier this week.
Following this, the pair started to consolidate on a 4-hour timeframe, retesting the previously breached structure.
A bullish breakout of this consolidation serve as a strong
DXY at a Decision Point : Momentum Building The U.S. Dollar Index is entering a critical phase where price action is tightening and momentum is gradually building. Recent structure suggests the market is preparing for its next directional move, with volatility likely to expand in the coming sessions.
Instead of chasing short-term noise, this
See all ideas
Displays a symbol's value movements over previous years to identify recurring trends.
Frequently Asked Questions
US Dollar Index reached its highest quote on Sep 28, 2022 — 114.687 USD. See more data on the US Dollar Index chart.
The lowest ever quote of US Dollar Index is 70.700 USD. It was reached on Mar 17, 2008. See more data on the US Dollar Index chart.
US Dollar Index is just a number that lets you track performance of the instruments comprising the index, so you can't invest in it directly. But you can buy US Dollar Index futures or funds or invest in its components.


