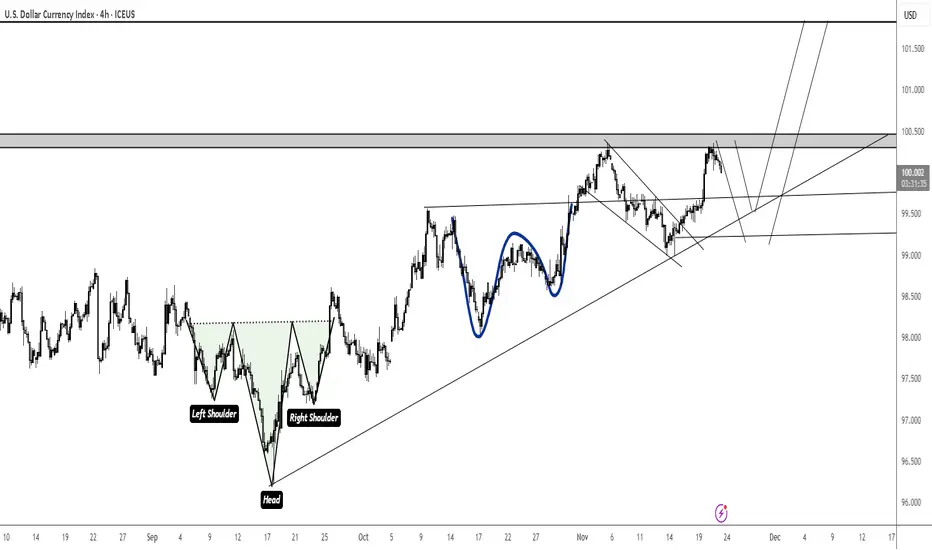
US DOLLAR INDEX (DXY): Bullish Movement Confirmed?!Following a recent bearish movement, the 📈DXY has corrected to a previously breached key structural level.
I have identified two significant bullish confirmations after this test: the price has violated the neckline of a double bottom pattern and the resistance line of a falling parallel channel pattern.
Both breakouts suggest a high probability of a bullish trend resumption.
The market will probably continue its upward trajectory and reach the 99.70 level in the near term.
Trade ideas

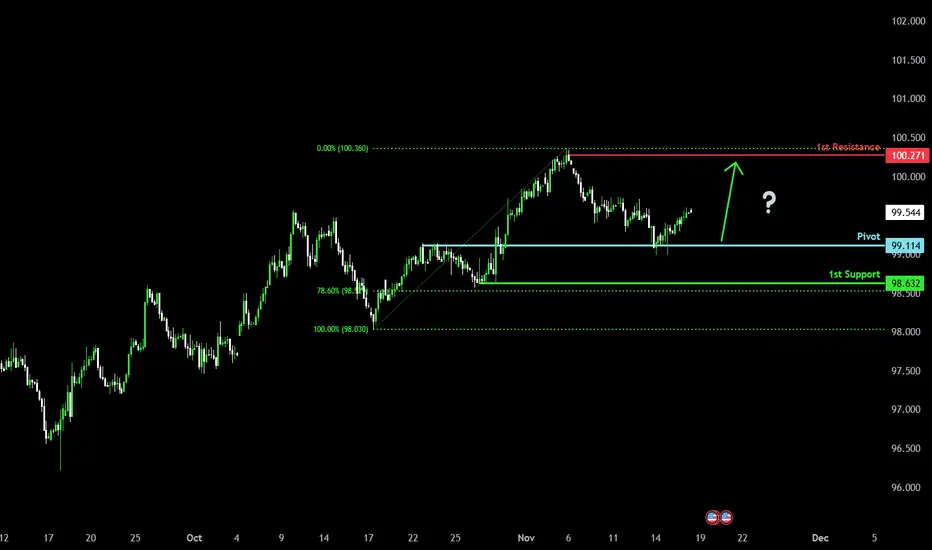
Bullish momentum to extend?US Dollar Index (DXY) has bounced off the pivot, which is a pullback support, and could potentially rise to the 1st resistance.
Pivot: 99.11
1st Support: 98.63
1st Resistance: 100.27
Disclaimer:
The opinions given above constitute general market commentary and do not constitute the opinion or advice of IC Markets or any form of personal or investment advice.
Any opinions, news, research, analyses, prices, other information, or links to third-party sites contained on this website are provided on an "as-is" basis, are intended to be informative only, and are not advice, a recommendation, research, a record of our trading prices, an offer of, or solicitation for, a transaction in any financial instrument and thus should not be treated as such. The information provided does not involve any specific investment objectives, financial situation, or needs of any specific person who may receive it. Please be aware that past performance is not a reliable indicator of future performance and/or results. Past performance or forward-looking scenarios based upon the reasonable beliefs of the third-party provider are not a guarantee of future performance. Actual results may differ materially from those anticipated in forward-looking or past performance statements. IC Markets makes no representation or warranty and assumes no liability as to the accuracy or completeness of the information provided, nor any loss arising from any investment based on a recommendation, forecast, or any information supplied by any third party.
NFP news for tom analysis NFP – meaning Non-Farm Payrolls
It’s the monthly report of jobs created in the US.
When NFP is high, it means many new jobs were added — which signals a strong economy.
So when the economy is strong, the US dollar (DXY) also tends to strengthen.
When the dollar is strong, it usually correlates with other currencies like EURUSD and GBPUSD, and also Gold (though sometimes Gold doesn’t follow this correlation).

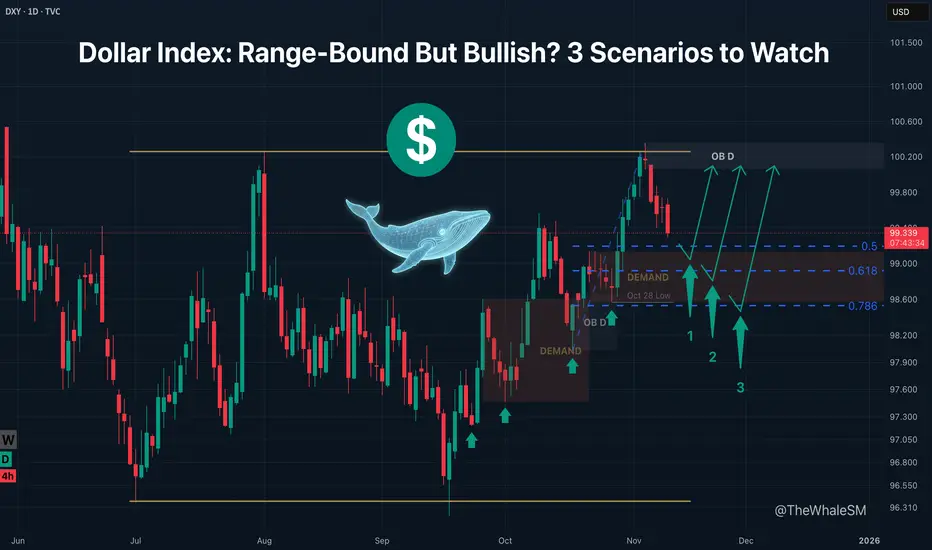
Dollar Index: Range-Bound But Bullish? 3 Scenarios to WatchThe Dollar Index ( TVC:DXY ) is in a global range, within which there is a bullish daily order flow. This flow is manifesting as a sequential mitigation of, and reversal from, imbalances and manipulation zones.
On November 5th, a deviation above the global range occurred, sweeping external liquidity. This was engineered by a manipulation in the form of a Daily Order Block . Following this, the index began a corrective decline and is now approaching a POI (Demand Zone) and potential Fibonacci reversal levels.
Long positions can be considered from one of these levels, targeting the upper boundary of the range (the mitigation of the Daily OB).
SCENARIO 1: Requires price to find acceptance above the 50% level upon reaching it and mitigating the Demand Zone.
SCENARIO 2: If this level is broken, the next 61.8% level (also inside the Demand Zone) may act as support.
SCENARIO 3: If this level is also broken, a liquidity sweep of the Oct 28 low is highly probable, which would be accompanied by a test of the 78.6% Fib level .
The entry condition for a long setup from each level is confirmed acceptance above it and the beginning of a bullish order flow on a lower timeframe .
~~~~~~~~~~~~~~~~~~~~~~~~~~~~~~~~~~~~~~~~~~~~~~~~~~~~~~~~~~~~~~~~~
The principles and conditions for forming the manipulation zones I show in this trade idea are detailed in my educational publication, which was chosen by TradingView for the "Editor's Picks" category and received a huge amount of positive feedback from this insightful trading community. To better understand the logic I've used here and the general principles of price movement in most markets from the perspective of institutional capital, I highly recommend checking out this guide if you haven't already. 👇
P.S. This is not a prediction of the exact price direction. It is a description of high-probability setups that become valid only if specific conditions are met when the price reaches the marked POI. If the conditions are not met, the setups are invalid. No setup has a 100% success rate, so if you decide to use this trade idea, always apply a stop-loss and proper risk management. Trade smart.
~~~~~~~~~~~~~~~~~~~~~~~~~~~~~~~~~~~~~~~~~~~~~~~~~~~~~~~~~~~~~~~~~
If you found this analysis helpful, support it with a Boost! 🚀
Have a question or your own view on this idea? Share it in the comments. 💬
► Follow me on TradingView for timely updates on THIS idea (entry, targets & live trade management) and not to miss my next detailed breakdown.
~~~~~~~~~~~~~~~~~~~~~~~~~~~~~~~~~~~~~~~~~~~~~~~~~~~~~~~~~~~~~~~~~
DXY key levels to look out for this week (WC 17/11)DXY key levels for the following week ahead.
Key fundamentals this week includes FOMC meeting minutes on Wednesday, NFP change along with unemployment rate on Thursday and to finish the week off on Friday- Manufacturing & Services PMI release on Friday.

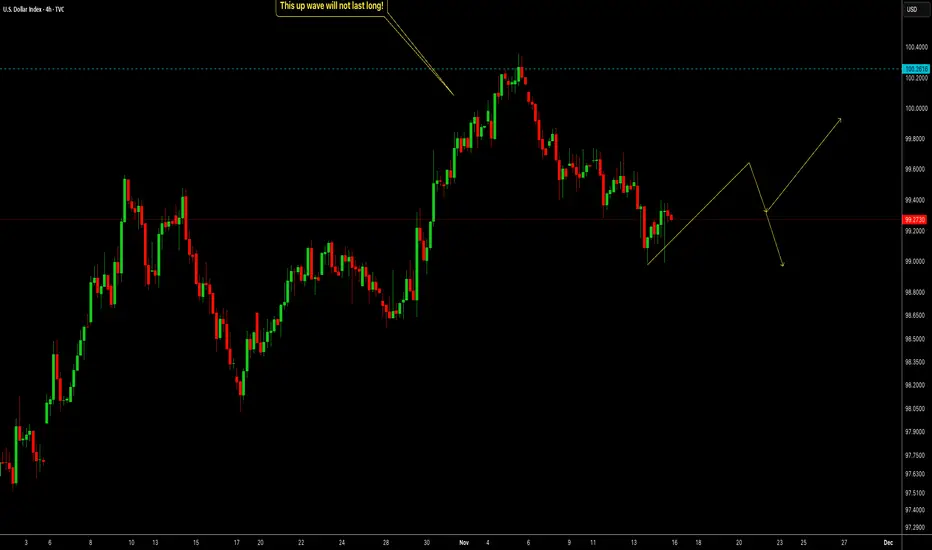
DXY - Short-Term Bounce, But the Bigger Drop Isn’t Done YetThe Dollar Index is forming a small corrective up-move on the 4H chart. This current rise still looks weak and is unlikely to last long. As long as price stays below the major zones above, the broader structure suggests one more push lower before any meaningful bullish reversal.
Short-term volatility is expected, but the higher-timeframe pressure remains to the downside. We’ll be watching for a final drop to complete the structure before the next big move.
Disclosure: We are part of Trade Nation's Influencer program and receive a monthly fee for using their TradingView charts in our analysis.
Bullish bounce off?US Dollar Index (DXY) is falling towards the pivot and could bounce to the 1st resistance resistance.
Pivot: 99.78
1st Support: 99.34
1st Resistance: 100.71
Disclaimer:
The opinions given above constitute general market commentary and do not constitute the opinion or advice of IC Markets or any form of personal or investment advice.
Any opinions, news, research, analyses, prices, other information, or links to third-party sites contained on this website are provided on an "as-is" basis, are intended to be informative only, and are not advice, a recommendation, research, a record of our trading prices, an offer of, or solicitation for, a transaction in any financial instrument and thus should not be treated as such. The information provided does not involve any specific investment objectives, financial situation, or needs of any specific person who may receive it. Please be aware that past performance is not a reliable indicator of future performance and/or results. Past performance or forward-looking scenarios based upon the reasonable beliefs of the third-party provider are not a guarantee of future performance. Actual results may differ materially from those anticipated in forward-looking or past performance statements. IC Markets makes no representation or warranty and assumes no liability as to the accuracy or completeness of the information provided, nor any loss arising from any investment based on a recommendation, forecast, or any information supplied by any third party.

NOV.23,2025 ANALYSIS- DXY, BTC, NAS100, SPX500, XAUUSD & XAGUSDDXY CAUTION: at weekly resistance but Uptrend with a huge bullish candle suggests continuation to the upside. I expect some sideway price action potential pullback to 99.365 level and then continuation to the upside target of 100.608. A break below 99.365 will invalidate upside targets.
BITCOIN: STILL BEARISH, All my initial bearish targets from previous analysis got smashed. BTC is now in a new bearish territory only finding support at the fib extension 1.618 from the $126,296 high. RSI is very oversold and potentially there could be a sideways price action around this level re-testing $80,524 this week. Ultimately the next bearish target is between $70k and $78k.
NAS100 & SPX500 BEARISH: Both indices closed with a strong bearish candle but found support around their 21EMA on the weekly chart. I observed some unconfirmed hidden divergence plus daily stochastics cycle lows so I expect some sideways consolidation and next leg down to targets of about $23,169 for Nas100 and $6,418 for SPX500.
GOLD & SILVER SIDEWAYS: Gold on the weekly chart showed only a doji candle consolidating price action but lower high of($4,194) confirmed on the chart. I envisage that this consolidation will continue into next week and finally breakdown to the $3,826 target. Silver has maintained the double tops on the weekly and daily charts. The lower high of $52.98 also suggest more downside price action with the initial target of $45 - $47 zone.
I hope my publications are helpful to your own analysis and perspective. Thank you and please show your support for these analysis with a boost or comment so it's shown to other traders. Have a great and profitable trading week and remember risk management is your first job as a trader. Cheers!!

Bretton Woods 2.0?Examining the long-term trend of TVC:DXY since the 1980s, we might be facing a staggering 40% reduction in valuation, potentially landing us around 60. If the US were to devalue the dollar this drastically, could it effectively erase the national debt? 🤔 Is Trump bold enough to consider such a move?
We know the FED is going to cut eventually, the question is when and by how much? Initial claims came in higher than estimated, with cracks beginning to show in the labor market, how much longer can JPow hold out?

DXY FRGNT Daily Forecast -Q4 | W47| D21 | Y25 |📅 Q4 | W47| D21 | Y25 |
📊 DXY FRGNT Daily Forecast
🔍 Analysis Approach:
I’m applying Smart Money Concepts, focusing on:
Identifying Points of Interest on the Higher Time Frames (HTFs) 🕰️
Using those POIs to define a clear trading range 📐
Refining those zones on Lower Time Frames (LTFs) 🔎
Waiting for a Break of Structure (BoS) for confirmation ✅
This method allows me to stay precise, disciplined, and aligned with the market narrative, rather than chasing price.
💡 My Motto:
"Capital management, discipline, and consistency in your trading edge."
A positive risk-to-reward ratio, paired with a high win rate, is the backbone of any solid trading plan 📈🔐
⚠️ Losses?
They’re part of the mathematical game of trading 🎲
They don’t define you — they’re necessary, they happen, and we move forward 📊➡️
🙏 I appreciate you taking the time to review my Daily Forecast.
Stay sharp, stay consistent, and protect your capital
— FRNGT 🚀
TVC:DXY

US Dollar: Look For Buys As The Pullback Ends!Welcome back to the Weekly Forex Forecast for the week of Nov. 17 - 21st.
In this video, we will analyze the following FX market: USD Dollar
The USD was in retracement last week. It looks like that may be ending, and a new bullish leg could potential start early this week.
Wait patiently for the bullish shift in the market at a key poi... like the Weekly +FVG highlighted in the video. The 1H TF should make this obvious, and look to long the USD against its currency counterparts.
Enjoy!
May profits be upon you.
Leave any questions or comments in the comment section.
I appreciate any feedback from my viewers!
Disclaimer:
I do not provide personal investment advice and I am not a qualified licensed investment advisor.
All information found here, including any ideas, opinions, views, predictions, forecasts, commentaries, suggestions, expressed or implied herein, are for informational, entertainment or educational purposes only and should not be construed as personal investment advice. While the information provided is believed to be accurate, it may include errors or inaccuracies.
I will not and cannot be held liable for any actions you take as a result of anything you read here.
Conduct your own due diligence, or consult a licensed financial advisor or broker before making any and all investment decisions. Any investments, trades, speculations, or decisions made on the basis of any information found on this channel, expressed or implied herein, are committed at your own risk, financial or otherwise.

After break failed DXY is rising DXY failed to break the support line now it's on the way to rise to 100
DXY Pulls Back from 100 – A Healthy Correction, Not a Reversal1. What Happened Since Last Week
In last week’s DXY analysis, I warned that although the U.S. Dollar Index remains in a broader uptrend, the 100.00 level represents both a strong technical and psychological resistance that could trigger a short-term retracement.
That scenario played out almost perfectly — after a brief spike above 100, DXY rolled over and is now trading near 99.70.
2. Market Context
The pullback so far looks orderly, not impulsive, suggesting that this move is a correction within an ongoing bullish structure, rather than the start of a major reversal. The market is simply digesting gains after a move higher.
3. Technical Outlook
The area between 99.00 and 99.20 stands out as a key confluence support zone, combining horizontal structure with the up trend line. This is where I expect buyers to reemerge if the index continues to drift lower.
4. Trading Plan
If DXY dips into 99.00–99.20, I’ll look for signs of USD strength resuming — specifically by considering short setups on GBP/USD and EUR/USD.
5. Conclusion
The dollar remains in an uptrend, and this pullback appears to be healthy, not bearish. As long as DXY holds above 99.00, the broader bullish bias remains intact, and traders should prepare for a possible rebound in the next sessions. 💵
DXY Bearish Setup- USD Weakness in Play..FINALLY! The DXY is showing a bearish bias, signaling potential USD weakness this week. Expect the following moves:
Bearish USD pairs:
USD/JPY (UJ): Selling pressure continues as USD loses momentum.
USD/CHF (UCHF): Weak USD drives the pair lower.
USD/CAD (UCAD): USD softness supports further downside.
Bullish non-USD pairs:
AUD/USD (AU): Strength in AUD pushes price higher.
EUR/USD (EU): EUR benefits from a weaker USD, moving up.
GBP/USD (GU): GBP rises as USD falls.
NZD/USD (NU): NZD continues upward momentum against USD.
Hashtags:
#Forex #DXY #USDWeakness #CurrencyTrading #ForexSetup #USDJPY #USDCHF #USDCAD #AUDUSD #EURUSD #GBPUSD #NZDUSD

DXY– Potential Shift After Momentum StallThe dollar index has shown a strong climb followed by signs of momentum slowing at recent highs. Current price behaviour suggests the possibility of a corrective move developing after this consolidation phase, with downside continuation becoming more likely if bullish follow-through fails to materialise. We’ll be monitoring structure and momentum closely as the next leg unfolds.
Disclosure: We are part of Trade Nation's Influencer program and receive a monthly fee for using their TradingView charts in our analysis


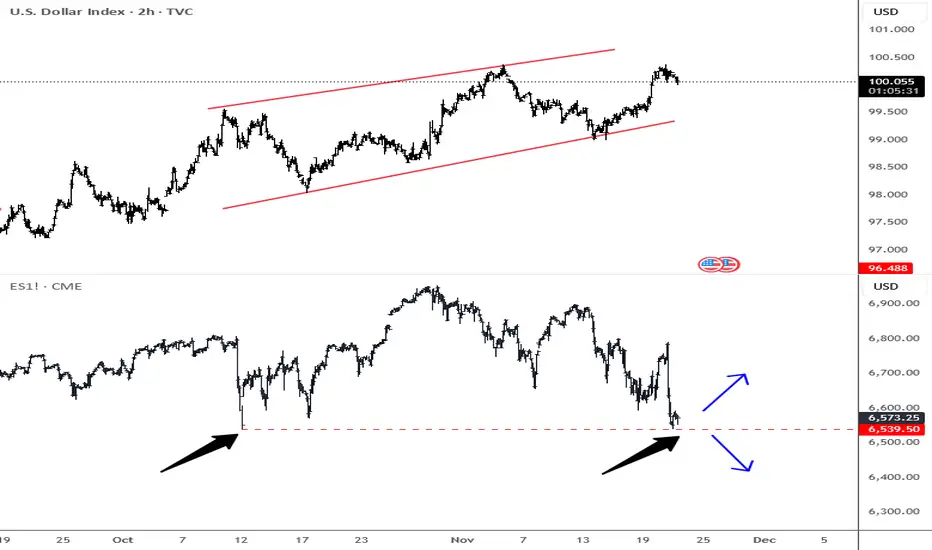
SP500 Testing Do-Die Support Stocks are seeing a pretty strong and aggressive decline, interestingly right after Nvidia delivered earnings that beat expectations, so it looks like the market still wants to move lower as AI-related valuations in the tech sector are simply too high and the market needs a deeper retracement. What stands out is that the S&P 500 has now retraced perfectly back to that October 10th Friday gap, when we saw a massive 3.5% sell-off in just one session, so I’m wondering if this zone could act as an interesting support for a potential rebound.
Keep in mind that despite the weakness in stocks over the last few sessions, we are not seeing that much strength on the dollar as you would normally expect in risk-off; so if stocks rebound the dollar could also slow down, ideally around 100.35–100.65 where the upside could be limited at the upper side of a wedge formation. I really want to see how the market will close today, because if we get a positive reaction in stocks then we may have some reason for a bounce next week, but if not and the market fails to recover today, then I’m afraid we can see much lower levels on the S&P 500 while DXY invalidate the diagonal formation.
2025 – The Year of the Normalized Dollar (Episode 2)2025 – The Year of the Normalized Dollar (Episode 2) 📉💵
📆 Feb 25 was just the beginning — and now we’ve got confirmation.
DXY couldn’t hold above structure, and the drop is on. What began as a quiet theme is turning into the macro headline:
The King Dollar is softening... on purpose.
🔍 Chart Context
• 🔴 Rejection at 112.3 — clean and brutal**
• 🔁 100.95 now flipped into resistance**
• 📉 Heading toward Target: 94.37** — the long-term structure low
The structure hasn’t changed — only the velocity has.
This isn’t a flash move. This is policy-meets-price.
🧨 Fundamentals: Trump’s Soft Dollar Doctrine
Back on January 23, Trump told the world exactly what he wanted:
“I’d like to see interest rates come down… a lot.”
“Oil down, prices down, inflation gone — and then rates down.”
Translation?
💵 A weaker dollar to fuel exports, ease debt loads, and juice the real economy.**
This is not weakness — it’s a recalibration.
Add in:
• Tariffs + labor policy inflation
• Pressure on Powell
• Geopolitical chess moves (Putin negotiations, Middle East detente)
→ and you’ve got a coordinated softening playbook.
📉 What’s Next?
• 🔹 Break 98 = Target 94.37 opens wide
• 🧱 If 94 cracks, we’ll re-assess — but for now, that’s the magnet
• DXY needs a miracle to reclaim strength without Fed resistance easing
2025 could be the year the dollar gets normalized by force — not finesse.
🔄 Perspective Shift 🔄
This isn’t dollar death — it’s dollar diplomacy.
Strong enough to hold global weight, soft enough to boost Main Street.
You think this isn’t coordinated? Look again. 📡
One Love,
The FXPROFESSOR 💙
First episode:
⚠️ I’m not a financial advisor — just a philosopher with better chart vision than 99% of the noise out there. What I share is my view, not a signal. You trade? You’re responsible. Just don’t blame me when I’m right again.

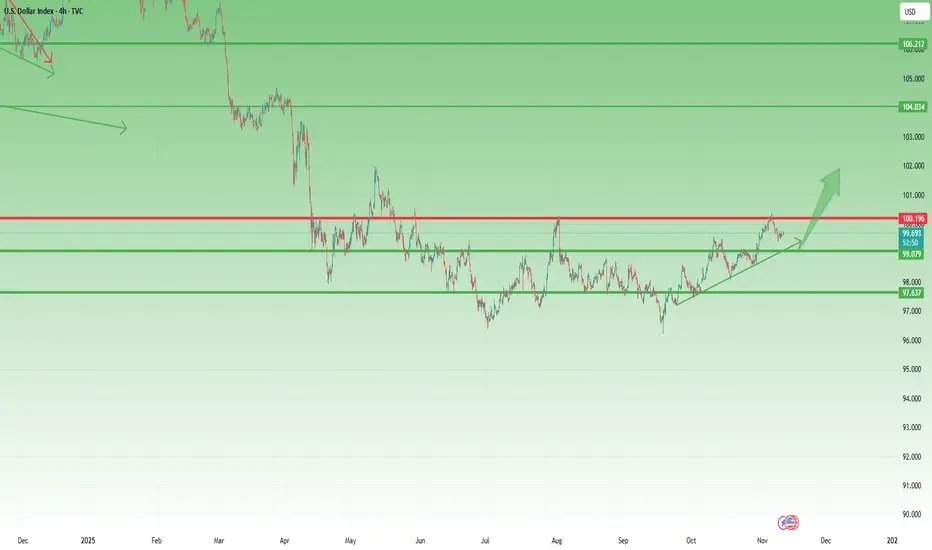
USD Re-Tests Massive Resistance Level as Rate Cut Rally Goes OnSeptember 18th of last year - that's when the Fed cut rates for the first time in that cycle, and the US Dollar set a fresh low at 100.22, building a falling wedge in the currency at the time.
That was a 'jumbo' rate cut, by the way, with the Fed knocking rates back by 50 basis points and it was the first rate cut since they had to quickly tighten rates to try to soften inflation following the spike in 2021 and 2022.
But that seemed to matter little, even though markets held expectation for more softening in 2024 which the Fed delivered with another 50 bps of moderation. That 100.22 level stood as key support - bulls rallied out of the falling wedge, and as we went into Q4, buyers took over in a very big way.
That rally held through the New Year open and then another theme took over - fear - driven by the very unknown prospect of massive tariffs levied by the US on pretty much the rest of the world. Quickly forecasts began to turn dim and fears of recession took over which, of course, were expected to be met by rate cuts.
While Trump took a step back from tariff implementation in April, allowing for both equities and USD/JPY to recover, there's remained an expectation for FOMC softening, and we've already seen two rate cuts.
But, interestingly, ever since the first cut on September 17th of this year, DXY has been pushing both higher-highs and higher-lows - and right now - the same swing low from last year of 100.22 is in-play as resistance.
This retains a bullish appearance for the greenback as the test at this level two weeks ago marked a fresh four month high. The monthly chart showed a morning star that completed in October, and the weekly and daily chart clearly shows the falling wedge breakout - all factors that point to potential strength.
Perhaps the bigger item at the moment is in that large component of DXY of the Euro, which is a 57.6% clip of the Dollar basket. EUR/USD is bearing down for another test of the 1.1500 figure, which, historically speaking, is not a level that gives way easily in the pair. - js

DXY General Trend Is Still Bullish But Pullback Highly ProbableThe trend is clearly still bullish. There is no sign yet of a reversal of a trend.
But a retracement is highly probable.
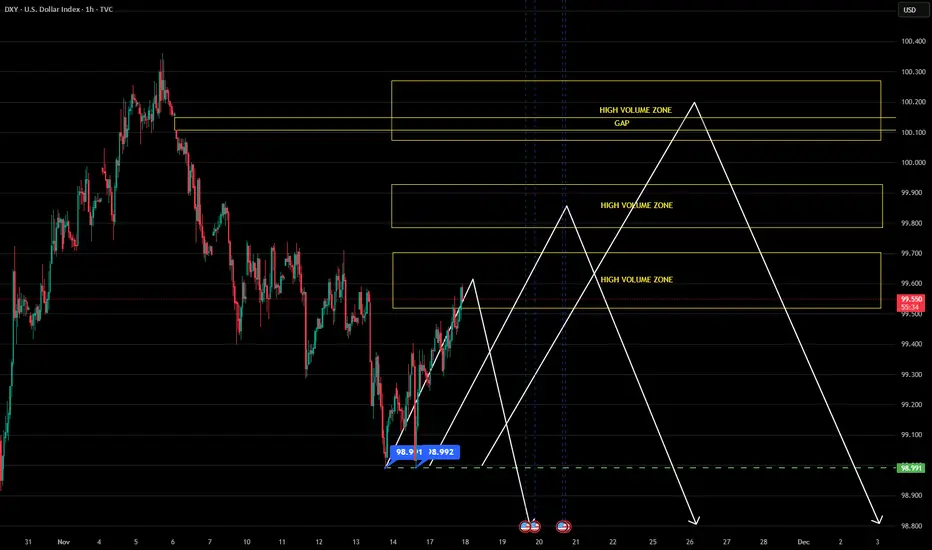
Trading Idea: DXY — Potential Reversal PointsTrading Idea: DXY — Potential Reversal Points
Technical Overview
The Dollar Index has formed a significant resistance level, from which price has moved toward the first high-volume zone. The chart highlights three potential areas of volume concentration, each capable of acting as a reaction point.
Key Zones
Zone 1 — The nearest high-volume area, serving as the first potential support level.
Zone 2 — An intermediate volume accumulation area.
Zone 3 — The most compelling zone, featuring an unfilled gap. The presence of this gap creates an additional price magnet, as markets tend to fill price gaps over time.
Trading Scenario
The primary hypothesis anticipates price movement toward the third high-volume zone with the objective of filling the gap. This area is expected to produce the strongest reaction and potential reversal.
However, monitoring price behavior in the first two zones remains essential. A clear bounce with confirmation could indicate an earlier conclusion to the downward movement.
Risk Management
Wait for price reaction in each designated zone and seek confirming signals before entering a position. While the unfilled gap in the third zone increases the probability of price reaching that level, it does not guarantee a reversal.
DXY FRGNT Daily Forecast -Q4 | W47| D19 | Y25 |📅 Q4 | W47| D19 | Y25 |
📊 DXY FRGNT Daily Forecast
🔍 Analysis Approach:
I’m applying Smart Money Concepts, focusing on:
Identifying Points of Interest on the Higher Time Frames (HTFs) 🕰️
Using those POIs to define a clear trading range 📐
Refining those zones on Lower Time Frames (LTFs) 🔎
Waiting for a Break of Structure (BoS) for confirmation ✅
This method allows me to stay precise, disciplined, and aligned with the market narrative, rather than chasing price.
💡 My Motto:
"Capital management, discipline, and consistency in your trading edge."
A positive risk-to-reward ratio, paired with a high win rate, is the backbone of any solid trading plan 📈🔐
⚠️ Losses?
They’re part of the mathematical game of trading 🎲
They don’t define you — they’re necessary, they happen, and we move forward 📊➡️
🙏 I appreciate you taking the time to review my Daily Forecast.
Stay sharp, stay consistent, and protect your capital
— FRNGT 🚀
TVC:DXY

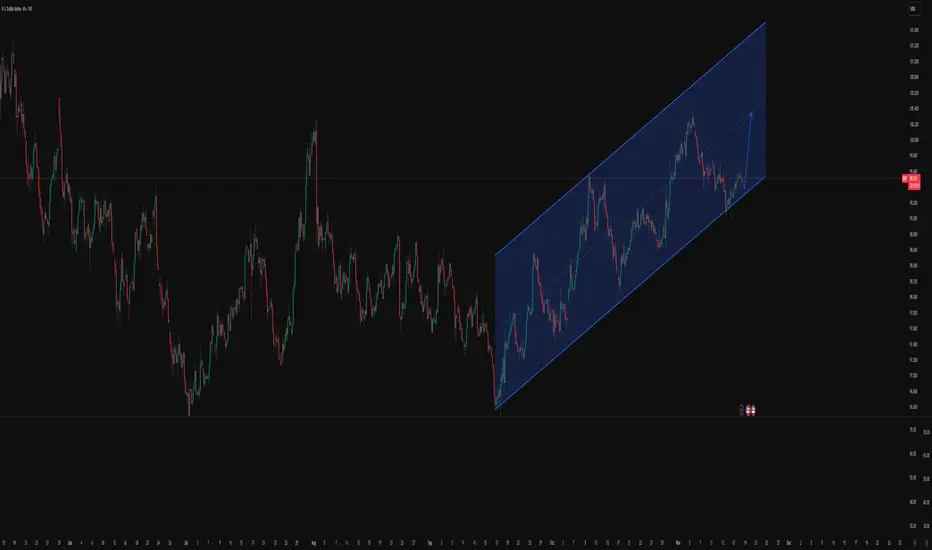
DXY ( Doller Index ) I expect to see the dollar index begin to rise from these areas. The wave will take months, perhaps even two years, to reach the upward target
