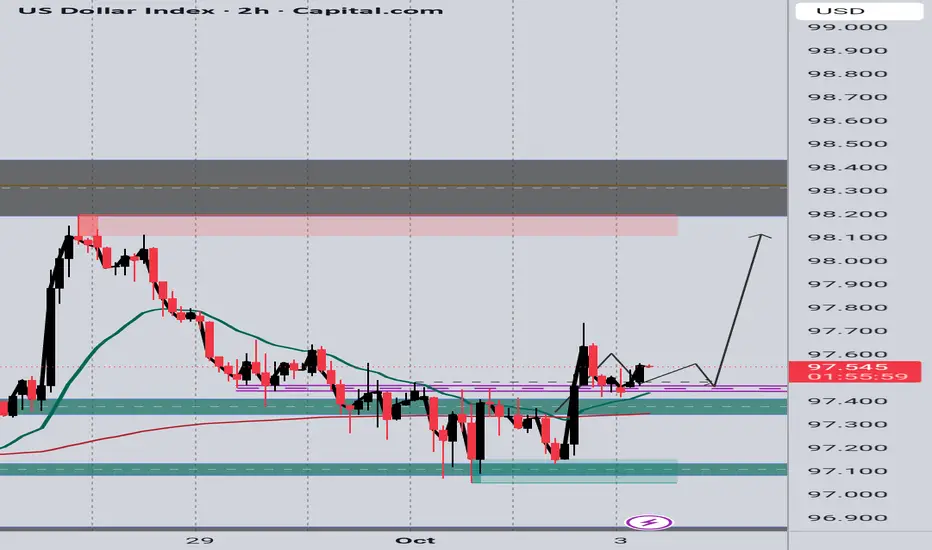
DXY – 2H Chart SetupThe Dollar Index is showing signs of strength after bouncing from the 97.20–97.30 demand zone and reclaiming short-term structure. Price is currently consolidating around 97.55, and holding above this support keeps the outlook bullish.
📈 Bullish Bias:
Above 97.50 support, price is likely to push higher.
Next upside targets are 97.80, then 98.20 – 98.40 key resistance zone.
Retests of the 97.50–97.40 area could provide buy opportunities before the next leg up.
DXY trade ideas
DXY Daily Outlook: Bearish Pressure BuildsLooking at the DXY (US Dollar Index) chart as of September 30, 2025, the long-term structure is clearly in a descending wedge pattern, showing sustained weakness since the sharp rejection from the 100.23 level earlier this year. Price action has been consistently making lower highs and lower lows, respecting the upper and lower trendline resistance and support. Currently, DXY is trading around 97.80, slightly above the mid-support zone, but momentum suggests that bears remain in control.
The chart also highlights multiple Change of Character (ChoCH) and Break of Structure (BOS) points, showing failed attempts by bulls to reverse the trend. Each rally has been capped below descending resistance, most recently around the 98–99 zone, which is now acting as a supply area. The ongoing compression in price suggests a possible breakout direction soon.
From a Fibonacci perspective, the major retracement levels drawn from the swing high (100.23) to the swing low (96.18) give clear downside targets. If the wedge breaks bearish, first support lies near 96.18, followed by Fib -0.382 (94.63), then deeper at -0.618 (93.67). A strong bearish continuation could extend toward the -1.618 projection (89.62), which aligns with long-term demand.
On the other side, if bulls manage to reclaim 98.50–99.00 with strong volume, it could trigger a corrective leg toward 100.23 (previous high and wedge resistance). However, given repeated rejections, this remains the less likely scenario unless macro fundamentals (such as Fed policy or global risk sentiment) strongly shift in favor of the dollar.
The RSI/Momentum structure would likely be neutral-to-bearish given the flat but declining structure. The price remains below the major moving averages (200-day SMA/EMA), adding weight to the bearish bias.
Momentum / indicators
Momentum on the daily appears neutral-to-bearish (rallies are weaker and get rejected).
RSI on daily (if checked) is likely flat-to-slightly below neutral, not showing strong bullish divergence — therefore rallies are corrective.
Price is trading under the major moving averages on the daily (200MA acts as dynamic resistance), reinforcing the bearish bias unless reclaimed decisively.
Key daily levels
Immediate resistance / supply: 98.00 – 99.00 (daily rejection zone).
Invalidation for bearish view (daily close basis): daily close above 100.23 / decisive break and hold above 100.5–101 would flip bias.
Near-term support: 96.18 (first target / pivot).
Secondary targets if 96.18 breaks: 94.63, 93.67 then 89.62 as extended target on a strong bearish continuation.
Price-action scenarios
Bearish continuation (favored): Price respects the upper descending trendline, forms a daily rejection or bearish engulfing at ~98.0–99.0 → short with first target at 96.18, partial take at 94.63 if momentum continues.
Neutral / consolidation: Price oscillates 97–98.5, chopping in wedge — wait for a daily close below 96.60 or above 99.50 before taking directional trade.
Bullish breakout (less likely): Daily close above 100.23 with follow-through and volume would signal trend change toward 102+ — invalidate shorts and look for long setups only after retest.
In Summary
Trend: Bearish within a descending wedge.
Resistance: 98.50 → 99.00 → 100.23.
Support: 96.18 → 94.63 → 93.67 → 89.62.
Long-term bias: As long as 99–100 zone is not broken decisively, DXY is likely to head lower toward 94–90 levels in coming months.
Risk factor: Only a macro-driven breakout above 100.23 would invalidate the bearish outlook and shift momentum toward 102+.
One-line Conclusion
Daily bias = bearish while price stays under the 98–100 supply zone; preferred approach is to short on daily rejections or after a break+retest of 96.18, with extended targets at 94.6 → 93.7 → 89.6, and clear invalidation only on a daily close above ~100.23.
Note
Please risk management in trading is a Key so use your money accordingly. If you like the idea then please like and boost. Thank you and Good Luck!

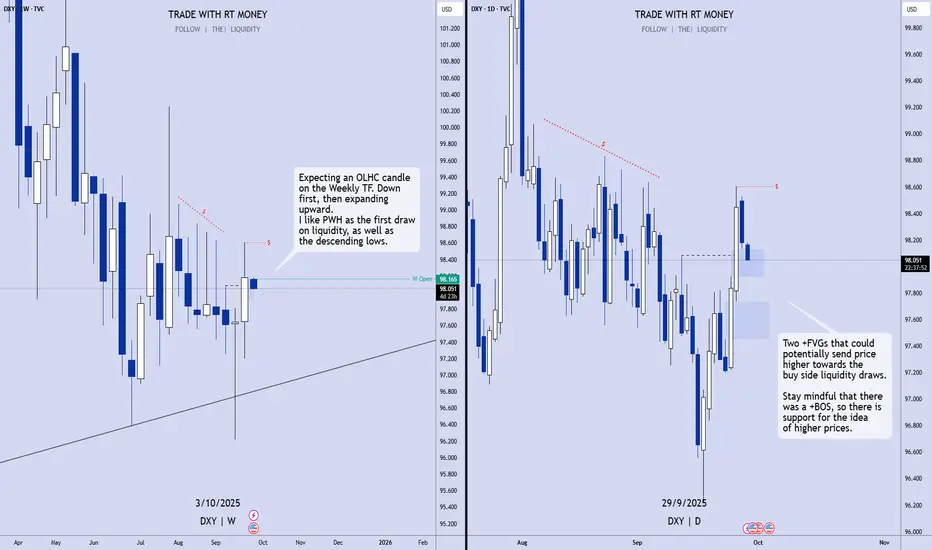
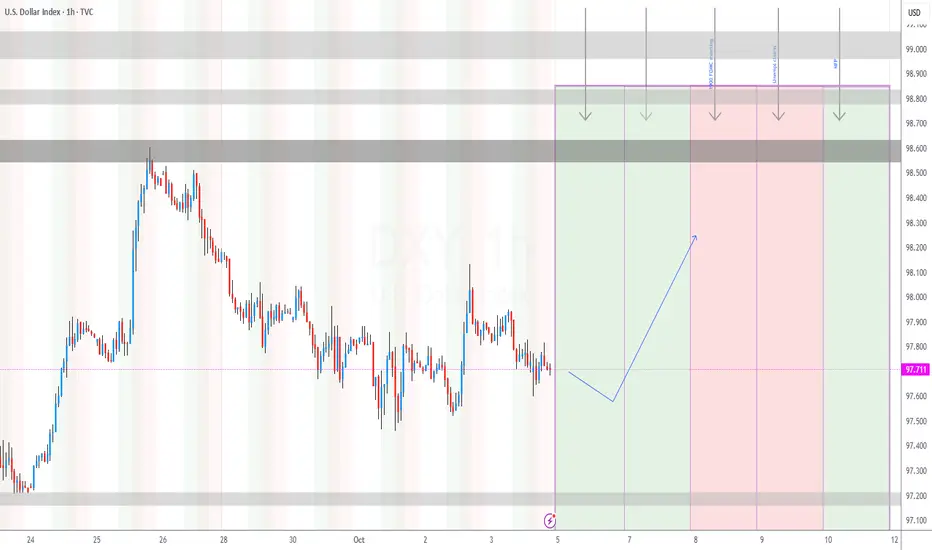
US Dollar: Wait For The +BOS, Then Buy It!Welcome back to the Weekly Forex Forecast for the week of Oct 6 - 10th.
In this video, we will analyze the following FX market: USD Dollar
The USD is technically still bearish, trying to find support for higher prices. A US government shutdown is not helping that case! However, personally, I am still looking toward the upside.
Price is still holding at a bullish discount array, an +OB. As long as the +OB is respected, I am looking for higher prices.
A bearish BOS will make looking for higher prices invalid.
So, let the market show its bias before entering a trade. Look for the confirmations to its direction.
Don't take trades inside the middle of consolidations!
Wait and react. Do not predict.
Enjoy!
May profits be upon you.
Leave any questions or comments in the comment section.
I appreciate any feedback from my viewers!
Disclaimer:
I do not provide personal investment advice and I am not a qualified licensed investment advisor.
All information found here, including any ideas, opinions, views, predictions, forecasts, commentaries, suggestions, expressed or implied herein, are for informational, entertainment or educational purposes only and should not be construed as personal investment advice. While the information provided is believed to be accurate, it may include errors or inaccuracies.
I will not and cannot be held liable for any actions you take as a result of anything you read here.
Conduct your own due diligence, or consult a licensed financial advisor or broker before making any and all investment decisions. Any investments, trades, speculations, or decisions made on the basis of any information found on this channel, expressed or implied herein, are committed at your own risk, financial or otherwise.

DXY Strategy Unlocked — Will Bulls Control the Next Swing?⚡ US Dollar Index (DXY) Swing/Day Trade Setup ⚡
💹 Asset: DXY (US Dollar Index)
📈 Plan: Bullish — Pending Order Strategy
📊 US Dollar Index (DXY) Real-Time Data
Daily Change: +0.55 (+0.56%)
Day's Range: 97.62 – 98.60
52-Week Range: 96.38 – 110.18
🔔 Trade Setup (Thief Plan)
Breakout Entry: 98.800 ⚡ (Set TradingView alarm to catch the move in real time)
Stop Loss: “Thief SL” @ 24,000.0 (only after breakout confirmation).
📝 Adjust your SL based on your strategy & risk appetite, Ladies & Gentlemen (Thief OG’s).
Target: Resistance/overbought zone at 100.20
🎩 Escape target: 100.000 (take profits before market flips).
😰 Fear & Greed Sentiment
Index Level: 64 (Greed)
Market Mood: Moderately greedy, driven by:
📉 Net new 52-week highs vs. lows (bullish)
📊 VIX near averages (neutral)
🛡️ Bonds underperforming stocks (risk-on)
📈 Junk bond demand narrowing spreads (greed signal)
🌍 Fundamental & Macro Score
Fed Rate Cut Probability: 90% (Sept 18 FOMC, 25 bps cut expected)
Key Drivers:
✅ Labor Data: NFP (Sept 5) is crucial for direction.
⚠️ Trade Policy: Court ruled Trump tariffs illegal (appeal pending).
⬇️ Consumer Confidence: Michigan Index at 3-month low (58.2).
⬆️ ISM Manufacturing: Ahead of release, possible USD support.
Safe-Haven Demand: Geopolitical tensions supporting USD.
🐂 Overall Market Outlook Score
Bullish (Long): 60%
Bearish (Short): 40%
Bias: Short-term bullish as long as 97.60 holds.
USD rebound + bond yield strength + equity weakness backing USD.
⚠️ Risk: Break below 97.60 → next target 96.55 (bearish).
💡 Key Takeaways
🎯 NFP Report (Sept 5) = decisive catalyst.
⚖️ Fed debates + trade policy = medium-term uncertainty.
📉 Breakout above 98.80 is the key to bullish continuation.
🔍 Related Markets to Watch
FX:EURUSD
FX:GBPUSD
FX:USDJPY
OANDA:XAUUSD
CAPITALCOM:US30
✨ “If you find value in my analysis, a 👍 and 🚀 boost is much appreciated — it helps me share more setups with the community!”
#DXY #USD #DollarIndex #Forex #DayTrading #SwingTrading #BreakoutStrategy #ThiefTrader #TradingSetup

DXY DOLLAR INDEX The DXY, or U.S. Dollar Index, measures the strength of the U.S. dollar relative to a basket of six major currencies. It reflects how the dollar is performing against these international peers and serves as a key indicator of the dollar’s global value.
Key Points about DXY:
It tracks the U.S. dollar against the euro (EUR), Japanese yen (JPY), British pound (GBP), Canadian dollar (CAD), Swedish krona (SEK), and Swiss franc (CHF).
The euro has the largest weighting in the index (~57.6%), making it the biggest influence on the DXY.
Movements in the DXY indicate whether the dollar is strengthening or weakening overall.
A rising DXY means the dollar is gaining value against this currency basket; a falling DXY means it is losing value.
The index impacts global trade, commodity prices (like gold and oil), and international investment flows.
Practical Use:
The DXY is widely followed by forex traders, economists, and policymakers to gauge dollar strength.
It helps assess the U.S. dollar's impact on global markets and forecast currency market trends.
#DXY #DOLLAR #US10Y

Bullish bounce?The US Dollar Index (DXY) is falling towards the pivot and could bounce to the 1st resistance, which is a pullback resistance.
Pivot: 97.96
1st Support: 97.49
1st Resistance: 98.77
Disclaimer:
The above opinions given constitute general market commentary, and do not constitute the opinion or advice of IC Markets or any form of personal or investment advice.
Any opinions, news, research, analyses, prices, other information, or links to third-party sites contained on this website are provided on an "as-is" basis, are intended only to be informative, is not an advice nor a recommendation, nor research, or a record of our trading prices, or an offer of, or solicitation for a transaction in any financial instrument and thus should not be treated as such. The information provided does not involve any specific investment objectives, financial situation and needs of any specific person who may receive it. Please be aware, that past performance is not a reliable indicator of future performance and/or results. Past Performance or Forward-looking scenarios based upon the reasonable beliefs of the third-party provider are not a guarantee of future performance. Actual results may differ materially from those anticipated in forward-looking or past performance statements. IC Markets makes no representation or warranty and assumes no liability as to the accuracy or completeness of the information provided, nor any loss arising from any investment based on a recommendation, forecast or any information supplied by any third-party.

DXYDXY is going sideways, we meed more sideways movement this week before going up.
Disclosure: We are part of Trade Nation's Influencer program and receive a monthly fee for using their TradingView charts in our analysis.

DXY nfp again breaking the support?Hello traders, this is a complete multiple timeframe analysis of this pair. We see could find significant trading opportunities as per analysis upon price action confirmation we may take this trade. Smash the like button if you find value in this analysis and drop a comment if you have any questions or let me know which pair to cover in my next analysis.

$DXY - Ballads of The Dollar (Q3/Q4 2025/26)TVC:DXY - Ballads of The Dollar
TVC:DXY
(Q3-Q4/2025)
(2026)
*** NOTE THAT THIS IS NOT FINANCIAL ADVISE !
PLEASE DO YOUR OWN RESEARCH BEFORE PARTAKING ON ANY TRADING ACITVITY BASED SOLEY ON THIS IDEA.
*Fundamental Summary
What to Watch out for :
-The Dollar Index ( TVC:DXY ) has recently retraced from mid-2025 highs as markets price an easing cycle for the Federal Reserve.
The Fed began cutting rates in 2025 and market pricing implies additional cuts through late-2025/early-2026.
That shift is the main near-term headwind for the dollar.
-The broad macro backdrop (slower global growth, easing inflation) supports a gradual AMEX:USD softening on average in 2026 — but risk events (hotter-than-expected inflation, geopolitical flight-to-safety, tariff shocks) could trigger episodic dollar strength.
+1
- Bank/Strategy Notes
(JPMorgan, market reports) show many Macro desks expecting some AMEX:USD weakness into 2026, but divergence in regional growth and rate paths keeps volatility and range trading likely.
+1
- Key current fundamentals and news drivers.
Fed policy path / rate cuts:
The OECD and market pricing expect more Fed easing (several 25bp cuts across late-2025 into 2026).
The magnitude and timing of cuts are the single largest driver for DXY.
A faster/larger easing path → weaker TVC:DXY ;
A delayed or shallower path → stronger OPOFINANCE:DXY.
+1
- U.S. GDP Growth & Labor data:
Slowing growth and softer payrolls increase rate-cut expectations;
any surprising strength in jobs or inflation would support the dollar.
+1
- Cross-Currency Central Bank Policies:
The European Central Bank, BoJ and others’ moves matter — if the ECB stops cutting or the BoJ tightens, that reduces one-sided USD weakening.
JPMorgan and other large banks note currency pairs (e.g., USD/JPY)
will be shaped by central bank divergence.
+1
- Global Growth & Inflation (IMF/World Bank):
Global growth is projected to remain modest in 2025–26.
Falling global inflation reduces the need for other central banks to keep rates high, which can compress rate differentials and weigh on USD upside.
+1
- Risk Sentiment(Geopolitics & Tariffs)
Episodes of risk-off (safe-haven flows) or trade/tariff headlines can push short-term USD strength even if the long-term trend is softer.
+1
- Data-Driven Events Risks:
watch out for U.S. CPI, PCE, non-farm payrolls and each FOMC statement/summary of economic projections — these are volatility catalysts that will determine whether the index follows the base case or a tail scenario.
Federal Reserve
+1
- Cross-Hedging:
If you expect the base-case mild USD weakening,
consider pairs where dollar weakness shows clearly (EUR/USD, AUD/USD, NZD/USD) or hedge with short-USD positions sized to risk tolerance.
If you fear tail-risk spikes, hold options or tight stop-losses because sudden rallies can be sharp.
TECHNICAL ANALYSIS :
- Charts show a macro Support/Demand zone ~96 (a historically important DXY floor) and a supply/resistance cluster around ~102–105 (multiple reaction highs).
That structure matches recent market commentary that the mid-90s acts as a key support and the low-to-mid-100s area is the principal resistance zone.
Use these bands to refeer as the primary range framework.
- Momentum/MA signals are mixed:
short-term pullbacks (to trendline/200-day EMA) are visible on several data summaries;
RSI/momentum in mid-2025 has shown episodic bullish runs followed by corrective phases—consistent with a choppy transition from a strong-dollar regime to a more range-bound market.
(Dovish / Hawkish tail risks)
Forecast — scenario framing and level ranges
Below we give a base case and two alternative scenarios
As presented expected TVC:DXY ranges (not precise dates) for the remaining part of 2025 (the next calendar quarter(s) from now) and for 2026.
-Best case-scnario (highest probability)
Fed cuts gradually; TVC:DXY drifts lower but remains range-bound
Q4 2025 (near term): TVC:DXY drifts toward 98–101 as markets price in further Fed easing and global risk appetite improves.
Occasional pullbacks to the 96–97 demand zone are possible on weak US data.
(Full-Year 2026)
Average 95–100 TVC:DXY , with the index oscillating between the mid-90s (95–97) on dovish surprises and re-testing ~100–103 on risk events or if other central banks disappoint.
This reflects expectations of a lower Fed funds rate by spring 2026 but still persistent inflation risk that keeps cuts measured.
- Dovish tail
(Fed cuts faster / Global resilience): AMEX:USD Weakens more
Q3 & Q4 2025:
Quick drop to 95–98 if the Fed signals a multi-cut path and U.S. real rates fall; EUR/JPY strength and reduced safe-haven flows accelerate the move.
2026:
TVC:DXY trades 92–97 on average.
This is the scenario many currency strategists price as the “USD softening” path if inflation cools quickly and global growth stabilizes.
- Hawkish tail
(Inflation Reaccelerates or Geopolitical shocks): AMEX:USD reasserts
Q3-Q4 2025:
A surprise inflation uptick or risk shock pushes markets back to a higher DXY 101–106 zone (testing the resistance cluster shown on your chart at ~102–105).
2026:
Intermittent surges to 103–108 on episodic safe-haven flows or delayed Fed easing; average could still be mid-to-high-90s if the hawkish episodes are episodic rather than structural.
- Practical Trade / Risk Managment recommendations (tactical)
If you’re trading price action on your charts: use the 96 area as a high-conviction support/demand entry (tight risk) and 102–105 as the primary supply zone to consider fading rallies.
Your annotated zones and boxed consolidation areas are a good place to set stop levels and scale positions.

U.S Dollar Index (DXY) Bullish Reversal Setup – Targeting 98.913Previous Trend:
There was a strong upward move, forming a rising channel (highlighted in pink).
Price reached the upper boundary of the channel and then reversed downward.
Current Price Action:
Price broke below the midline of the channel and is approaching a potential support zone.
This zone is marked by a blue rectangle (support/demand area).
Trade Idea: Long Setup (Buy Position)
Entry Point: Around 97.862
Stop Loss: Around 97.665–97.679 (just below support zone)
Target Point: 98.913 (near previous high)
✅ Trade Rationale
Support Zone: The marked area has previously acted as a demand zone, likely to support price again.
Bullish Recovery Expectation: The idea is that price will bounce from this support zone and resume upward movement.
Good Risk-Reward Ratio:
Risk: ~20 pips (from 97.862 to 97.665)
Reward: ~105 pips (from 97.862 to 98.913)
Risk-to-Reward Ratio: ~1:5 — a favorable setup.
⚠️ Cautions
Price is still above entry level (98.020) — the setup assumes a pullback to the 97.86 area before buying.
If price breaks below 97.665, the setup would be invalidated (stop loss hit).
Channel Breakout Risk: Since the channel is already broken to the downside, this trade assumes a temporary dip before a rebound — which may or may not happen.
📌 Summary
Parameter Value
Entry 97.862
Stop Loss 97.665
Target 98.913
Risk-Reward ~1:5
Trade Direction Long (Buy)
Confirmation Needed Pullback to support zone

Bearish drop?The US Dollar Index (DXY) is reacting off the pivot which aligns with the 61.8% Fibonacci retracement and could drop to the 1st support which acts as a multi-swing low support.
Pivot: 98.63
1st Support: 96.61
1st Resistance: 100.19
Disclaimer:
The above opinions given constitute general market commentary, and do not constitute the opinion or advice of IC Markets or any form of personal or investment advice.
Any opinions, news, research, analyses, prices, other information, or links to third-party sites contained on this website are provided on an "as-is" basis, are intended only to be informative, is not an advice nor a recommendation, nor research, or a record of our trading prices, or an offer of, or solicitation for a transaction in any financial instrument and thus should not be treated as such. The information provided does not involve any specific investment objectives, financial situation and needs of any specific person who may receive it. Please be aware, that past performance is not a reliable indicator of future performance and/or results. Past Performance or Forward-looking scenarios based upon the reasonable beliefs of the third-party provider are not a guarantee of future performance. Actual results may differ materially from those anticipated in forward-looking or past performance statements. IC Markets makes no representation or warranty and assumes no liability as to the accuracy or completeness of the information provided, nor any loss arising from any investment based on a recommendation, forecast or any information supplied by any third-party.

US Dollar Index: Bullish! Buy The Dip!Expecting price to retrace into the +FVGs below. Look on the 1H for a CISD when price comes into contact with either of the two poi's. Once a directional change is confirmed, buy it.
Enjoy!
May profits be upon you.
Leave any questions or comments in the comment section.
I appreciate any feedback from my viewers!
Disclaimer:
I do not provide personal investment advice and I am not a qualified licensed investment advisor.
All information found here, including any ideas, opinions, views, predictions, forecasts, commentaries, suggestions, expressed or implied herein, are for informational, entertainment or educational purposes only and should not be construed as personal investment advice. While the information provided is believed to be accurate, it may include errors or inaccuracies.
I will not and cannot be held liable for any actions you take as a result of anything you read here.
Conduct your own due diligence, or consult a licensed financial advisor or broker before making any and all investment decisions. Any investments, trades, speculations, or decisions made on the basis of any information found on this channel, expressed or implied herein, are committed at your own risk, financial or otherwise.
DXY idea We expect the Monday low to be sweeped to then continue in the HTF direction. A more HP setup will be if the sweep will be done on 4h Timeframe thru fvg higher after sweeping.
So we just wait. We let the price developing.
The setup is also valid if we continue higher directly without sweeping, but instead creating new 4h fvg higher.

EUR USD and DOLLAR UPDATE
The Dollar Index (DXY) is grinding through a daily order block and has just pierced 97.882.
Technical
If we close above 97.882, that confirms a break and opens continuation toward higher liquidity zones. With tomorrow’s heavy macro news, the setup has volume behind it for a potential massive move.
Macros
U.S. government shutdown is weighing on confidence and trimming growth forecasts (each week may shave 0.1–0.2pp off GDP).
The Fed remains cornered — markets price in rate cuts, but policy credibility is under scrutiny.
Safe-haven flows are mixed: gold at records, dollar stabilizing after Supreme Court support for Fed’s Cook.
Data releases are being delayed by the shutdown, which adds uncertainty and volatility.
EURUSD
We’re short and holding.
4-month rangebound structure remains
Be aware
Dollar strength is being fueled by technical break + macro volume. EURUSD is vulnerable if DXY confirms above 97.882.
But with policy risk and shutdown uncertainty, expect volatility spikes and liquidity hunts around tomorrow’s big data.

DXY ShortThe Butterfly Harmonic pattern signals a strong bearish trend for TVC:DXY , starting at 97.9.
Eyes on potential targets: TP1 & TP2. 📉

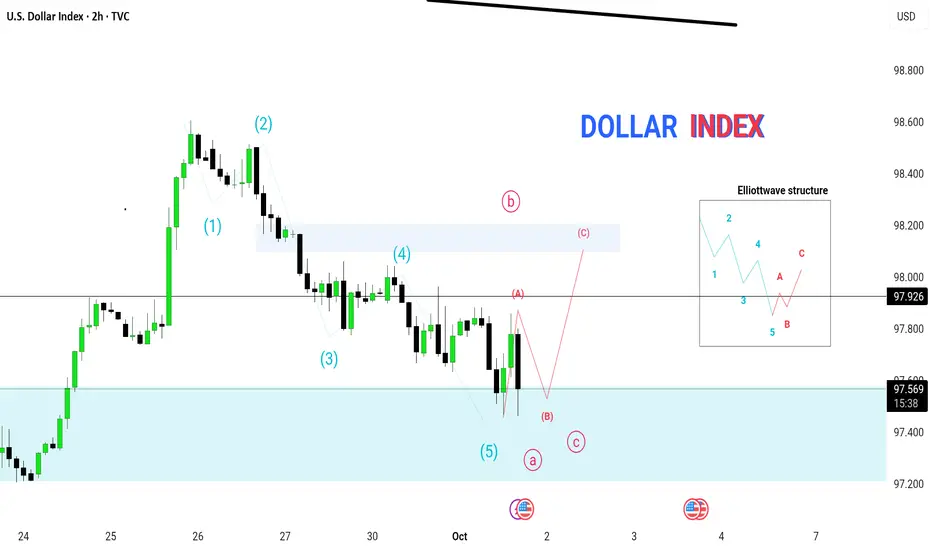
Dollar Index Elliott Wave Analysis | next move ABCIn this , we break down the U.S. Dollar Index (DXY) using Elliott Wave Theory. 📊
✅ 5-wave impulsive structure (1–5) has completed
✅ Market entering corrective phase (ABC)
✅ Key support: 97.40 – 97.20
✅ Resistance zone: 98.00
✅ Short-term bias: Possible corrective upside before continuation
This analysis is crucial for EUR/USD traders, as Dollar Index movement directly impacts Euro strength. Watch till the end to understand the upcoming correction and trading opportunities. 🚀
#ElliottWave #DollarIndex #ForexAnalysis #DXY #EURUSD
Bullish DXYPotential Inverted Head and Shoulders display.
Am very Bullish on USD Index right now and Bearish on most xxx/USD pairs.

DXY: Move Up Expected! Long!
My dear friends,
Today we will analyse DXY together☺️
The recent price action suggests a shift in mid-term momentum. A break above the current local range around 97.331 will confirm the new direction upwards with the target being the next key level of 97.393 and a reconvened placement of a stop-loss beyond the range.
❤️Sending you lots of Love and Hugs❤️
DXY BUYING SETUPmarket trend in daily time-frame and lower time-frame is uptrend
formation of dimunation in 4hrs time-frame
there was a impulsive movement before correction

Dollar IndexDXY - U.S Dollar Index
- Completed " 12345 " Impulsive Waves
- Change of Characteristics
- Break of Structure
- Falling Wedge as an corrective pattern in Short Time Frame
- Demand Zone

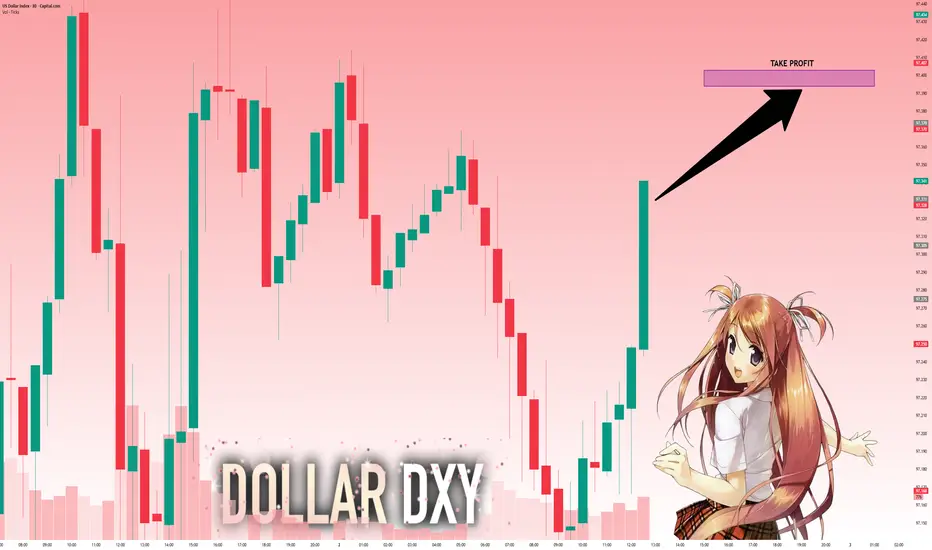
DOLLAR DXYDOLLAR INDEX ON CLOSE OF FRIDAY DUE to oversight i didn't see a descending trendline cross which is also a valid structure for buy and could technically reverse EURUSD,USDJPY,AUDUSD,USDCAD,GBPUSD USDZAR.
DOLLAR OPEN on STRONG BULLISH RALLY ABOVE Friday supply roof my long for dxy will extend into 97.644 supply roof and final TP @99.081

DXY key levels to look out for this week (WC 06/10)DXY key levels for the following week ahead of FOMC meeting, Unemployment claims & Non-Farm Payroll releases
DXY DAILY TIMEFRAME ANALYSIS 1. Market Context & Structure
Timeframe: Daily
Current Price: 97.711
Trend Bias: Medium-term bearish structure still intact, though currently in a corrective bullish retracement.
Structure Flow:
Lower highs and lower lows dominate since mid-July.
Current price action shows a potential pullback within a bearish trend.
---
🧩 2. Key Technical Zones
🔵 Supply Zone (99.50–100.20 area)
This area represents an institutional short-entry zone, where large orders previously triggered aggressive selling pressure.
Expect liquidity inducement — price may push into this zone to grab stops above prior highs before reversing down.
Aligns with the fair value gap below, which provides imbalance liquidity magnetism.
🟥 Fair Value Gap (around 99.00)
The gap between bullish and bearish candles created inefficiency in price delivery.
The market often revisits such imbalances to fill orders left behind by institutional players.
Expect a short-term rally into this gap before a reversal.
🟪 Demand Zone (96.20–96.50)
Marked as a strong previous accumulation point.
Each retest here in the past has produced bullish rejection wicks — suggesting pending liquidity below.
This is likely the final downside target if the bearish continuation unfolds.
---
📉 3. Institutional Flow Outlook
Scenario A (High-Probability Bearish Path):
1. Price retraces upward into the fair value gap / supply zone.
2. Smart money executes sell programs once liquidity above minor highs is swept.
3. Momentum shifts downward, leading price to revisit the 97.00 mid-support and ultimately the 96.20 demand zone.
Scenario B (Less Likely Bullish Continuation):
Only if DXY reclaims and holds above 100.50, confirming institutional demand, then bias could shift bullish — but current chart doesn’t support this yet.
---
💼 4. Macro Correlation
A weak DXY typically strengthens:
EUR/USD → bullish continuation toward higher liquidity pools.
Gold (XAU/USD) → potential upside resumption as dollar weakens.
Watch for confirmation from upcoming CPI or FOMC data — a dovish Fed stance will likely accelerate the bearish DXY scenario.
---
🧠 5. Professional Summary
Factor Observation Implication
Market Structure Lower highs & lower lows Bearish continuation likely
Supply Zone 99.50–100.20 Institutional sell area
Fair Value Gap 98.80–99.20 Liquidity magnet (retracement target)
Demand Zone 96.20–96.50 Final downside liquidity target
Bias Bearish Look for shorts after retracement
---
📊 Conclusion:
DXY is likely setting up a liquidity-grab rally into the 99.00–100.00 supply zone, followed by a bearish continuation toward 96.20.
Institutional players are expected to use that retracement to load shorts, maintaining bearish macro bias.
