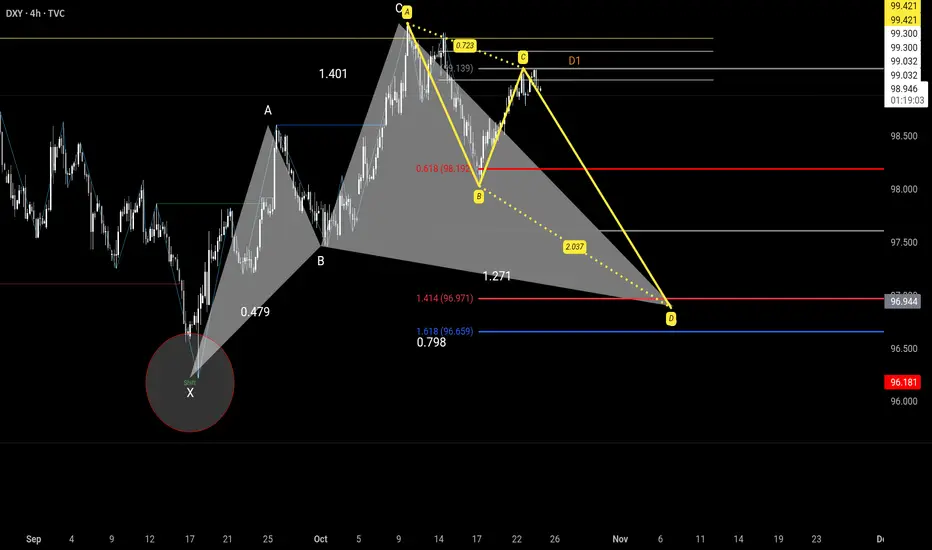
Dxy follow upABCD extension with target PRZ. Pattern is projection alongside previous idea which will be linked below.
Trade ideas
DOLLAR INDEX The Dollar Index (DXY) is a measure of the value of the US dollar relative to a basket of major foreign currencies, including the euro, Japanese yen, British pound, Canadian dollar, Swedish krona, and Swiss franc. It provides an overall indication of the dollar’s strength or weakness in the global foreign exchange market.
How the Dollar Index Works
The index is weighted based on trade volumes between the US and these countries, with the euro having the largest weight (~57.6%).
A rising Dollar Index means the US dollar is strengthening against the basket currencies; a falling index indicates dollar weakness.
Impact of Interest Rates and Bond Yields on the Dollar Index
Interest Rates:
Higher US interest rates generally attract foreign capital because they offer better returns on dollar-denominated assets, increasing demand for the US dollar and pushing the Dollar Index higher. Conversely, lower rates can weaken the dollar.
Bond Yields:
US Treasury yields are closely linked to interest rates. Rising bond yields attract yield-seeking investors from around the world, boosting demand for the dollar. Higher yields improve the dollar’s appeal relative to other currencies, often driving the Dollar Index up.
Rate Differentials:
The key driver is the differential between US interest rates/bond yields and those of other major economies. If US rates or yields rise more than those abroad, the dollar tends to strengthen.
The next Federal Open Market Committee (FOMC) meeting is scheduled for October 28-29, 2025. The key federal funds rate decision will be announced on October 29, typically at 2:00 PM Eastern Time, followed by a press conference led by Fed Chair Jerome Powell.
Regarding the Dollar Index (DXY), FOMC rate decisions have significant effects:
If the Fed cuts rates, as widely expected at this meeting due to a weakening labor market and inflation concerns, the US dollar tends to weaken against the basket of major currencies, putting downward pressure on the Dollar Index.
A dovish tone from the Fed, signaling further rate cuts ahead, typically extends dollar weakness.
Conversely, if the Fed surprises with a pause or hawkish stance, the dollar could strengthen, supporting an increase in the Dollar Index.
Market consensus currently leans toward a 25 basis point cut, implying a likely bearish impact on the Dollar Index near the announcement.
Summary
The Dollar Index gauges the overall value of the US dollar versus a currency basket.
Rising US interest rates and bond yields increase demand for US dollar assets, pushing the Dollar Index higher.
International rate differentials are key to understanding dollar strength or weakness in global forex markets.
This interrelationship influences trade, capital flows, and monetary policy impacts across economies..
trade direction based on structure.
the last analysis on dollar /gold inverse reaction was a complete reaction on Friday 17th at 97.999 and we have seen gold sell off on the dollar buy floor .
the next anticipation will be on 96.361 floor which will come along FOMC rate outcome ,if the rate decision and outlook becomes positive ,technical correction might continue for the yellow metal before rally.
the us-china tension is cooling off ,technically slowing central banks demand for the yellow metal.
GOODLUCK
#XAUUSD #GOLD #DOLLAR #DXY

DXY WEEKLY FRGNT FORECAST - Q4 | W44 Y25 |📅 Q4 | W44 Y25 |
📊 DXY WEEKLY FRGNT FORECAST
🔍 Analysis Approach:
I’m applying Smart Money Concepts, focusing on:
Identifying Points of Interest on the Higher Time Frames (HTFs) 🕰️
Using those POIs to define a clear trading range 📐
Refining those zones on Lower Time Frames (LTFs) 🔎
Waiting for a Break of Structure (BoS) for confirmation ✅
This method allows me to stay precise, disciplined, and aligned with the market narrative, rather than chasing price.
💡 My Motto:
"Capital management, discipline, and consistency in your trading edge."
A positive risk-to-reward ratio, paired with a high win rate, is the backbone of any solid trading plan 📈🔐
⚠️ Losses?
They’re part of the mathematical game of trading 🎲
They don’t define you — they’re necessary, they happen, and we move forward 📊➡️
🙏 I appreciate you taking the time to review my Daily Forecast.
Stay sharp, stay consistent, and protect your capital
— FRNGT 🚀
TVC:DXY

DXYDXY can have one more up and without breaking the top it can breakdown one more time.
Disclosure: We are part of Trade Nation's Influencer program and receive a monthly fee for using their TradingView charts in our analysis.

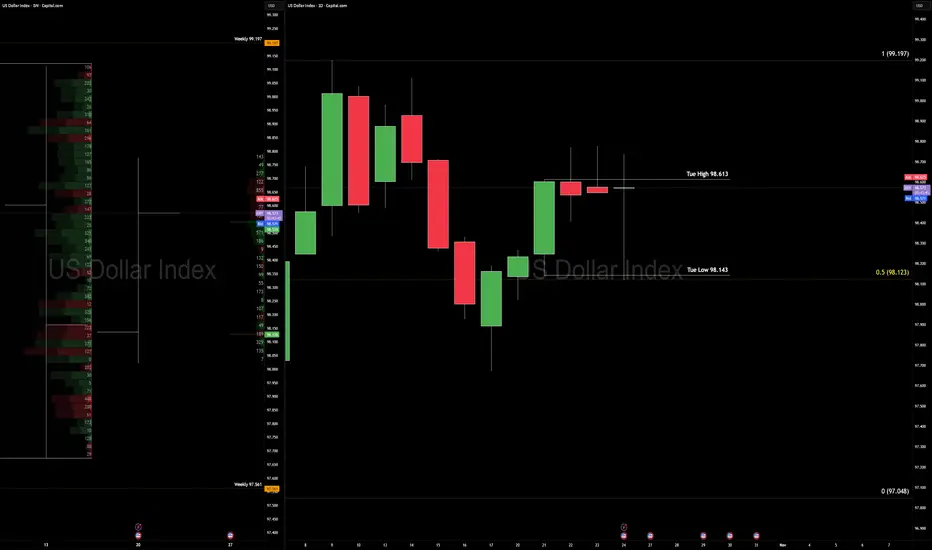
DXY — Triple Compression: CPI Meets a 3rd Weekly & 4th Daily Ins
The U.S. Dollar Index is locking in tight — 3rd consecutive weekly inside bar, and a 4th possible daily inside bar — as U.S. inflation holds firm and Japan’s core inflation uptick adds fuel.
Context
We’re locked in structural compression: three weeks of internal price action, and today presents a 4th daily inside bar formation.
Weekly key range: low 97.561 and high 99.197. Price is stuck in the mid-zone, patiently waiting.
For bias confirmation: Break of Tuesday’s 21 Oct daily candle low at 98.143 or high at 98.613 will signal directional bias.
Macro queue: Big data hits next week (inflation prints, central-bank focus). Volatility is coiled.
Technical
Weekly frame: Still inside the bearish range (97.561 – 99.197).
Daily frame: Bias leans bullish until the range breaks — think “bullish inside bar pending expansion”.
In symmetrical measures: Risk of overbought cognition; if today’s low holds and Monday fails to trade through it, we may see a higher low setup. Execution: Wait for clean breakout of the inside bar structure; use volume confirmation; avoid getting sucked into a false squeeze.
Fundamentals
U.S. inflation: The Consumer Price Index for September is published today (24 Oct) after delay due to shutdown.
Bureau of Labor Statistics +2
The Financial Express +2
Japan inflation: September core inflation rose to 2.9% YoY, moving above the Bank of Japan target and adding pressure to the JPY‐rate story.
Trading Economics
+2
Bloomberg
+2
Impact mechanism: Sticky inflation → reduces odds of immediate rate cuts → supports USD strength; yet structural squeeze in DXY means the market is holding its breath for breakout.
Plan & Mindset
Plan: Hold off trading until Monday’s price action gives clarity through breakout of the inside-bar structure. Then map cross-assets (EURUSD, GBPUSD) accordingly.
Mindset
Structure rules story. Don’t fight a tight coil. Today you “wait with purpose.” If price breaks, act decisively; if it breaks wrong, adapt quickly.
- Like waiting for the popcorn — you don’t eat the kernels while still heating.
DXY: 3mo timeline channel, BULLISH
Interest rates (relative to global peers) in the US remain relatively high. Global peers dropping rates at a much quicker pace when compared to the FED.
US GDP growth continues at a fast pace thanks to expanding margins through efficiency thanks to AI. I believe we'll also begin to see small to mid caps perform as well as large caps currently are in the next year or so.
Continued drop in commodity prices like oil
From a technical perspective, on the 3mo timeline, the 50 sma is about to cross above the 200 sma. Current price is also bouncing off bothe the 50 and 200 sma. I believe the DXY is clearly bottoming in a multi decade long channel.
As much tension as there is in the world today, we are still grinding forward. Nothing is perfect, but the sentiment shows clear promise in future growth which would help accelerate DXY value relative to the rest of the worlds currency.
This doesn't mean stocks must come down. We can have both.
...But I'm an optimist.
All the best.

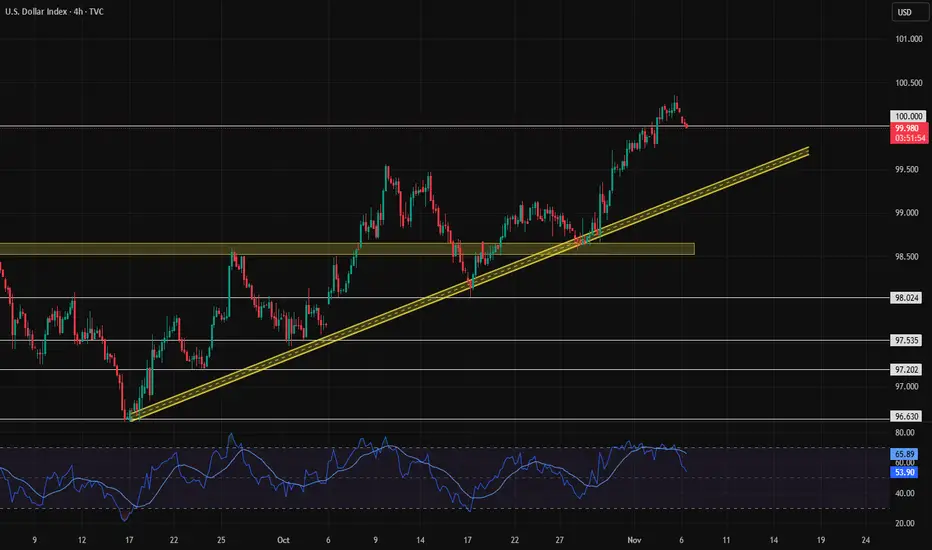
DXY and EURUSD Consolidate Near Key Breakout LevelsOn the 4-hour chart, both DXY and EURUSD are consolidating near key levels, with DXY leaning bullish and EURUSD leaning bearish.
DXY Outlook
A breakout above 99.15 could redirect gains toward 99.50, setting up another test before confirming a move higher toward 100.20 (July 2023-September 2024 resistance), then 101 and 103.
On the downside, a hold below 98.80 could extend the consolidation between 98.60 and 98.40.
EURUSD Outlook
A breakout below 1.1600–1.1560 could extend the decline toward 1.1520, with deeper losses possible toward 1.1480 and 1.1380.
From the upside, holding above 1.1620 may allow a rebound toward 1.1680 and 1.1730, before targeting yearly highs if momentum builds further.
Razan Hilal, CMT

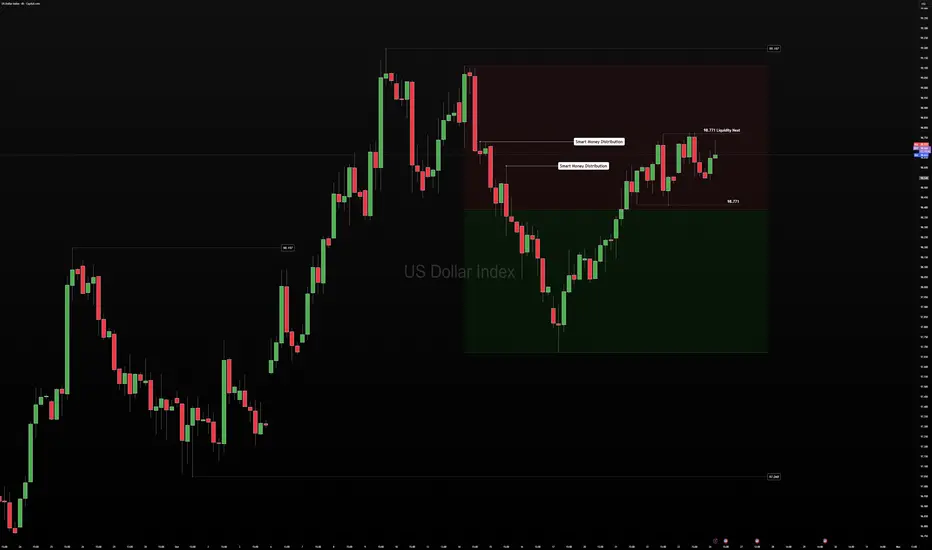
US Dollar — Pre-London Market NoteSmart Money Distribution — The Dollar’s Quiet Exit
🧭 Context
The U.S. Dollar Index is sitting in a premium range, absorbing liquidity near the highs.
This isn’t random — it’s the textbook signature of smart money distribution.
When professionals unload into late sellers and buyers end of week , the market looks stable… until it isn’t.
We’re watching the same pattern unfold into week’s end — a slow bleed of premium selling to generate liquidity for next week’s open.
📊 Technical Frame
Structure remains bearish on the weekly, bullish on the daily — a structural crossfire.
Retail eyes see a bounce; institutions see exit liquidity.
Dynamic structure math says: chasing longs here is paying premium for risk.
The 4H range low at 98.0 is under pressure; a sweep toward 98.77 during London would complete the liquidity cycle.
🌐 Fundamental Pulse
GDP and Core PCE ahead — both can shift yield expectations.
Yields up → stronger dollar, liquidity drains from risk assets.
Yields down → softer dollar, risk finds temporary relief.
This tug-of-war defines positioning — not headlines, but how liquidity behaves around them.
🧠 Trader’s Mindset
Smart money doesn’t predict — it prepares.
This week’s goal isn’t to be early; it’s to read how the distribution completes.
Patience preserves capital — and perspective.
💡 Takeaway
When everyone sees strength, the pros are already selling into it.
That’s smart money distribution in motion.
Learn to spot it, and you’ll stop donating to those who already have.

DXY: Bulls Are Winning! Long!
My dear friends,
Today we will analyse DXY together☺️
The recent price action suggests a shift in mid-term momentum. A break above the current local range around 99.374 will confirm the new direction upwards with the target being the next key level of 99.512 and a reconvened placement of a stop-loss beyond the range.
❤️Sending you lots of Love and Hugs❤️

Dollar index analysisAccording to our previous analysis, the Dollar Index finally managed to reach the 100 zone. Now we need to see whether it can close above the 100 level without making a fake breakout downward. If it can give a solid close above 100, then we can start considering long positions on the Dollar Index or sell positions on EUR/USD.
dxy 1h🔹 Overall Outlook and Potential Price Movements
In the charts above, we have outlined the overall outlook and possible price movement paths.
As shown, each analysis highlights a key support or resistance zone near the current market price. The market’s reaction to these zones — whether a breakout or rejection — will likely determine the next direction of the price toward the specified levels.
⚠️ Important Note:
The purpose of these trading perspectives is to identify key upcoming price levels and assess potential market reactions. The provided analyses are not trading signals in any way.
✅ Recommendation for Use:
To make effective use of these analyses, it is advised to manually draw the marked zones on your chart. Then, on the 5-minute time frame, monitor the candlestick behavior and look for valid entry triggers before making any trading decisions.

DXY Analysis — Tracking Dollar Strength This WeekThe DXY has cleared buy-side liquidity and closed below the Point of Control, signaling potential weakness in the dollar. I’m expecting continued selling on USD pairs (USDCAD, USDJPY) while looking for buying opportunities on EURUSD, GBPUSD, NZDUSD, and AUDUSD. Overall bias: bearish on the Dollar Index.

DXY - Long Term Trade - Double Bottom - Swing TradeTrade Plan shared on chart. 1:3 Trade Target set. Buy Stop pending Trade set at break of Neckline of the Double Bottom. Analysis shared with detail.

DXY-USD Game PlanDXY-USD Game Plan
📊 Market Sentiment
On 29/10, the FED lowered rates by 25BPS as expected. However, Powell’s remarks introduced uncertainty regarding December’s potential cut, stating that decisions will depend on upcoming data.
One FED member dissented, preferring no cut, a shift from September’s unanimous decision.
As a result, rate cut expectations dropped from 95% to 68%, sparking short-term bullish sentiment for the USD, as traders adjusted portfolios toward defensive positioning.
📈 Technical Analysis
The Dollar Index (DXY) hit its HTF Weekly Bullish Trendline and got rejected, forming a structural reversal pattern.
We’ve now seen a break of short-term daily bearish trend, confirming strength and a potential leg higher toward 102.00 (Monthly FFVG).
📌 Game Plan / Expectations
Expecting price to wick or close above 100.25, then potentially retrace before resuming the bullish leg.
Primary upside target: Monthly FFVG zone at 102.00.
Sentiment remains bullish for the dollar short term, which may pressure risk assets (stocks and crypto) temporarily.
💬 If this DXY breakdown supports your macro view, like, comment, and follow.
For deeper insights and liquidity-based macro models, subscribe to my Substack (free access available).
⚠️ Disclaimer
This analysis is for educational purposes only and does not constitute financial advice. Always conduct your own research before trading or investing.

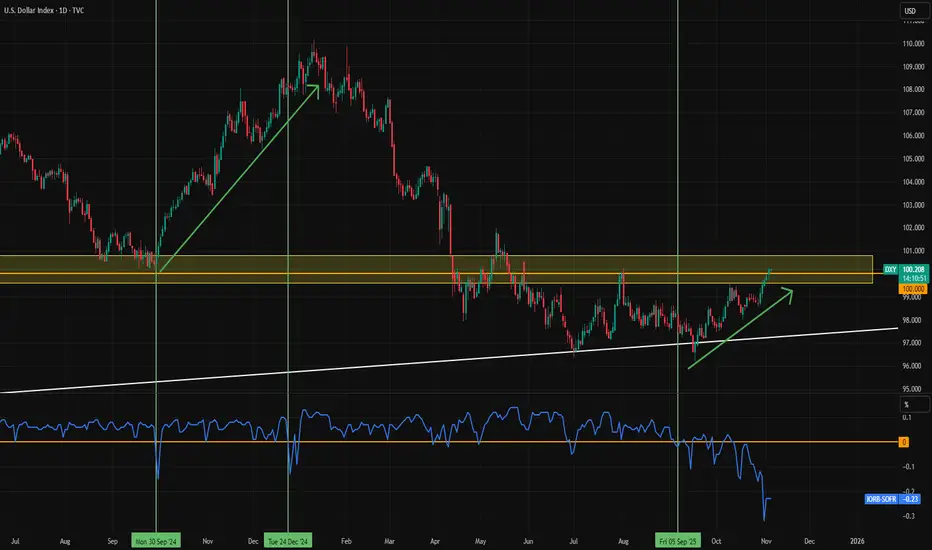
Dollar Rises Amid Record US Shutdown and Liquidity ShortageThe dollar index is climbing as the US faces its longest government shutdown on record. The FRED:SOFR rate is trading 0.23 percentage points above the FRED:IORB , signaling a liquidity shortage. Unfortunately, TradingView data doesn’t cover the 2019 liquidity crunch, but the current situation looks similar.
Earlier this week, Logan highlighted the elevated repo rate and noted that the Fed may need to step in and purchase assets if conditions persist. The liquidity shortage is putting upward pressure on the dollar index. A breakout above 101 could accelerate that pressure further.
If the US shutdown ends, renewed government spending could ease the liquidity strain, allowing the dollar to retreat. Until then, upward momentum is likely to continue.
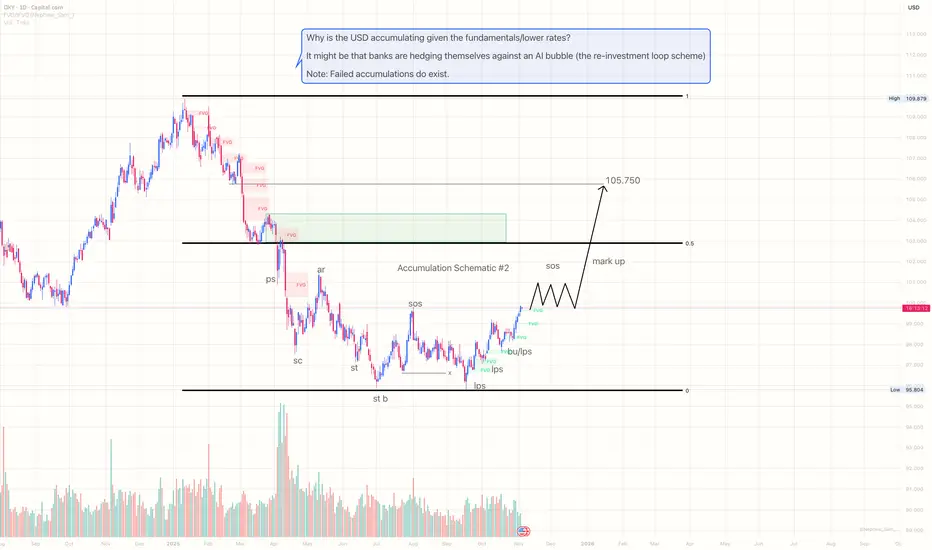
Why is the dollar in Accumulation mode?It might be that banks are hedging themselves against an AI bubble (the re-investment loop scheme)
Note: Failed accumulations do exist.
Could reduced Fed rate-cut expectations keep the dollar strong?
The dollar index extended its gains as the Fed’s increasingly cautious stance on additional rate cuts strengthened sentiment.
Dallas Fed President Logan noted that without clear evidence of inflation falling or a sharp cooling in the labor market, another rate cut in December would be difficult to justify. Similarly, Cleveland Fed President Hammack emphasized the need to maintain a degree of tightening to bring inflation back to target.
Meanwhile, the federal government shutdown reached its 35th day, tying the record from Trump’s first term. The CBO estimated that the shutdown has already shaved about 1% off Q4 GDP, with the impact potentially widening to 2% by the end of November if it continues.
DXY extended its uptrend, briefly testing the resistance at 100.20. Diverging bullish EMAs indicate a potential extension of bullish momentum. If DXY breaches above 100.20, the index may advance toward the following resistance at 100.50. Conversely, if DXY breaks below 100.00, the index could retreat toward the next support at 99.50.

DXY: Still waiting for sell confirmationDXY has continued to push to the upside, but i am still expecting shorts any point from now. The volume for longs has significantly dropped indicating possible shorts soon. Even if we push up to break the current high, I will still wait for my sell confirmations. Kindly manage risk. Best of Luck!
-TD


DXY MAX BUTTERFLYThe pattern is as title says a max butterfly. The xd ratio should be between 1.272 and 1.618. Risky short taken, maybe some relief on the shitcoins. 97.5 is obvious target.


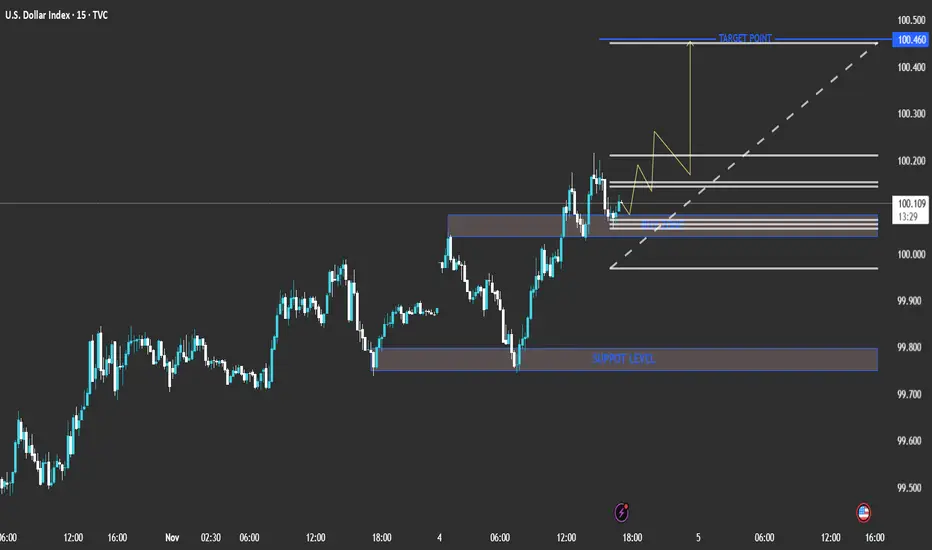
technical analysis of the chart you shared (U.S. Dollar Index Current Price: 100.112
Bias: Bullish short-term
Timeframe: 15-min
The chart shows a clear bullish structure with higher highs and higher lows forming. The price recently bounced from a minor support zone around the 100.00 level and is showing momentum to the upside.
📊 Key Levels
Support Level: 99.750 – 99.850 (major zone from previous lows)
Buy Zone: 100.000 – 100.050 (minor support/entry zone)
Target Point: 100.460
⚙️ Analysis Summary
Price has broken above short-term resistance and is now retesting the buy zone, suggesting a possible continuation higher.
The ascending trendline (dotted white line) supports this bullish bias.
The yellow zigzag projection indicates expected consolidation before a push upward.
🎯 Trading Plan (Based on Chart Setup)
Entry Zone: Around 100.000 – 100.050
Stop Loss: Below 99.900 (below structure support)
Take Profit: 100.460 (target zone)
Risk/Reward Ratio: Approximately 1:3
🔍 Conclusion
The chart suggests a short-term bullish scenario for DXY (U.S. Dollar Index). A successful bounce from the 100.00 zone could lead to a move toward the 100.46 target point. However, a break below 99.90 would invalidate the setup and shift bias to neutral or bearish. TVC:UKX FTSE:UKX FTSE:MCX FTSE:FBMKLCI FTSE:AIM1 FTSE:ASX FTSE:NMX FTSE:AW01 FTSE:JAPAN FTSE:GEISAC FTSE:FBM100 FTSE:AIM5 CBOEEU:BUK100P FTSE:XIN0 FTSE:AXX FTSE:XIN0U