Trade ideas

USD Re-Tests Massive Resistance Level as Rate Cut Rally Goes OnSeptember 18th of last year - that's when the Fed cut rates for the first time in that cycle, and the US Dollar set a fresh low at 100.22, building a falling wedge in the currency at the time.
That was a 'jumbo' rate cut, by the way, with the Fed knocking rates back by 50 basis points and it was the first rate cut since they had to quickly tighten rates to try to soften inflation following the spike in 2021 and 2022.
But that seemed to matter little, even though markets held expectation for more softening in 2024 which the Fed delivered with another 50 bps of moderation. That 100.22 level stood as key support - bulls rallied out of the falling wedge, and as we went into Q4, buyers took over in a very big way.
That rally held through the New Year open and then another theme took over - fear - driven by the very unknown prospect of massive tariffs levied by the US on pretty much the rest of the world. Quickly forecasts began to turn dim and fears of recession took over which, of course, were expected to be met by rate cuts.
While Trump took a step back from tariff implementation in April, allowing for both equities and USD/JPY to recover, there's remained an expectation for FOMC softening, and we've already seen two rate cuts.
But, interestingly, ever since the first cut on September 17th of this year, DXY has been pushing both higher-highs and higher-lows - and right now - the same swing low from last year of 100.22 is in-play as resistance.
This retains a bullish appearance for the greenback as the test at this level two weeks ago marked a fresh four month high. The monthly chart showed a morning star that completed in October, and the weekly and daily chart clearly shows the falling wedge breakout - all factors that point to potential strength.
Perhaps the bigger item at the moment is in that large component of DXY of the Euro, which is a 57.6% clip of the Dollar basket. EUR/USD is bearing down for another test of the 1.1500 figure, which, historically speaking, is not a level that gives way easily in the pair. - js

This is a very tough market/ a look at gold and silver and dxyOctober 19th I'm sure most people listening to this are also listening to their favorite show that helps them make a decision about the markets and the more services you start to look at the more confused you will be. Personally I'm spending very little time looking at the market but I try to take a quick glance of it either at the middle or beginning of the current day and then I can determine whether the market looks interesting or not. However the pattern on Bitcoin which I do not trade is the setup I would be looking for the markets that I would be looking to trade. Bitcoin is taking a little bit of a drawdown and there's a lot of information out there saying that Bitcoin is in trouble.... Probably from people who trade gold and silver///so you have to be careful of other people's biases.... But it will probably be tradable tomorrow on Bitcoin defined a reversal pattern going higher.... And you should be able to take a trade with a very small stop but you want to let the market come to you if you don't see a 2 bar reversal indicating that Bitcoin is going to go higher you can't take the trade.

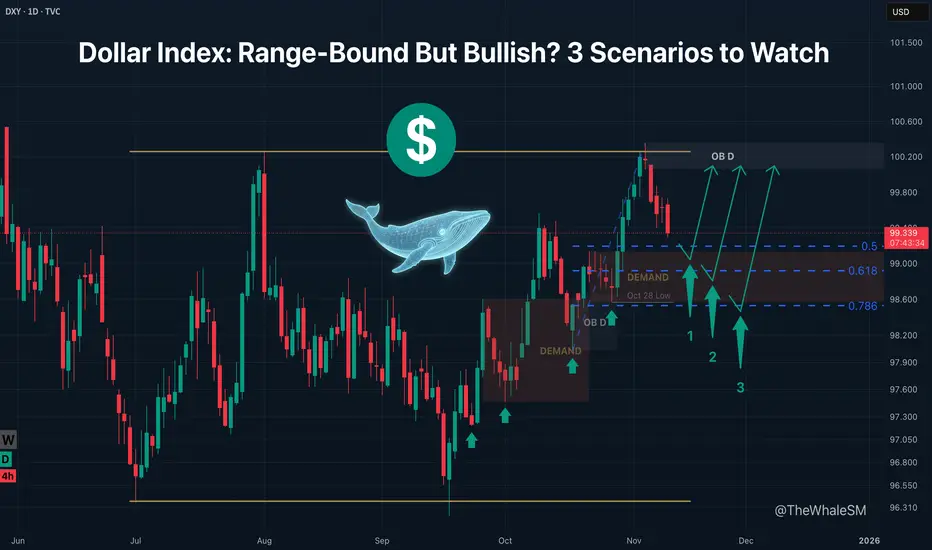
Dollar Index: Range-Bound But Bullish? 3 Scenarios to WatchThe Dollar Index ( TVC:DXY ) is in a global range, within which there is a bullish daily order flow. This flow is manifesting as a sequential mitigation of, and reversal from, imbalances and manipulation zones.
On November 5th, a deviation above the global range occurred, sweeping external liquidity. This was engineered by a manipulation in the form of a Daily Order Block . Following this, the index began a corrective decline and is now approaching a POI (Demand Zone) and potential Fibonacci reversal levels.
Long positions can be considered from one of these levels, targeting the upper boundary of the range (the mitigation of the Daily OB).
SCENARIO 1: Requires price to find acceptance above the 50% level upon reaching it and mitigating the Demand Zone.
SCENARIO 2: If this level is broken, the next 61.8% level (also inside the Demand Zone) may act as support.
SCENARIO 3: If this level is also broken, a liquidity sweep of the Oct 28 low is highly probable, which would be accompanied by a test of the 78.6% Fib level .
The entry condition for a long setup from each level is confirmed acceptance above it and the beginning of a bullish order flow on a lower timeframe .
~~~~~~~~~~~~~~~~~~~~~~~~~~~~~~~~~~~~~~~~~~~~~~~~~~~~~~~~~~~~~~~~~
The principles and conditions for forming the manipulation zones I show in this trade idea are detailed in my educational publication, which was chosen by TradingView for the "Editor's Picks" category and received a huge amount of positive feedback from this insightful trading community. To better understand the logic I've used here and the general principles of price movement in most markets from the perspective of institutional capital, I highly recommend checking out this guide if you haven't already. 👇
P.S. This is not a prediction of the exact price direction. It is a description of high-probability setups that become valid only if specific conditions are met when the price reaches the marked POI. If the conditions are not met, the setups are invalid. No setup has a 100% success rate, so if you decide to use this trade idea, always apply a stop-loss and proper risk management. Trade smart.
~~~~~~~~~~~~~~~~~~~~~~~~~~~~~~~~~~~~~~~~~~~~~~~~~~~~~~~~~~~~~~~~~
If you found this analysis helpful, support it with a Boost! 🚀
Have a question or your own view on this idea? Share it in the comments. 💬
► Follow me on TradingView for timely updates on THIS idea (entry, targets & live trade management) and not to miss my next detailed breakdown.
~~~~~~~~~~~~~~~~~~~~~~~~~~~~~~~~~~~~~~~~~~~~~~~~~~~~~~~~~~~~~~~~~
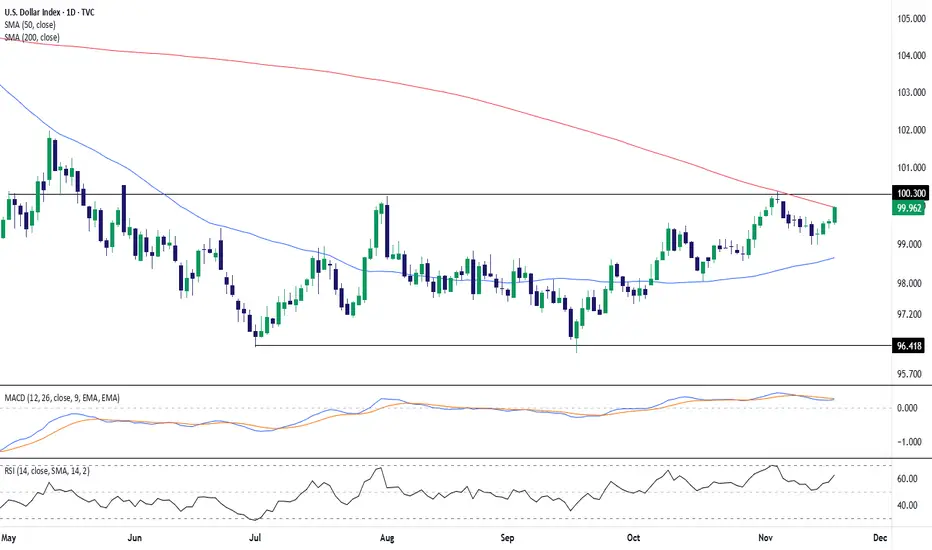
US Dollar Index Tests Key Resistance Near 100 as Momentum BuildsThe U.S. Dollar Index (DXY) continues to hover near the psychological 100.00 level after recovering from its October lows. Price is currently consolidating just below the 200-day simple moving average (SMA), which aligns closely with horizontal resistance around 100.30 — a level that has capped rallies several times this year.
The 50-day SMA (near 98.65) has begun to slope upward, suggesting short-term momentum remains constructive, though the broader trend still leans cautious below the 200-day SMA.
Momentum indicators are showing gradual improvement. The MACD histogram is slightly positive, hinting at renewed bullish pressure, while the RSI holds above 60, reflecting strengthening momentum without yet entering overbought territory.
A decisive close above 100.30 could signal a potential shift in medium-term sentiment, whereas rejection from this zone would reinforce the prevailing range between 96.40 and 100.30.
Overall, the index shows cautious bullish momentum approaching a major technical test.
-MW
NFP news for tom analysis NFP – meaning Non-Farm Payrolls
It’s the monthly report of jobs created in the US.
When NFP is high, it means many new jobs were added — which signals a strong economy.
So when the economy is strong, the US dollar (DXY) also tends to strengthen.
When the dollar is strong, it usually correlates with other currencies like EURUSD and GBPUSD, and also Gold (though sometimes Gold doesn’t follow this correlation).

DXY FRGNT Daily Forecast -Q4 | W47| D19 | Y25 |📅 Q4 | W47| D19 | Y25 |
📊 DXY FRGNT Daily Forecast
🔍 Analysis Approach:
I’m applying Smart Money Concepts, focusing on:
Identifying Points of Interest on the Higher Time Frames (HTFs) 🕰️
Using those POIs to define a clear trading range 📐
Refining those zones on Lower Time Frames (LTFs) 🔎
Waiting for a Break of Structure (BoS) for confirmation ✅
This method allows me to stay precise, disciplined, and aligned with the market narrative, rather than chasing price.
💡 My Motto:
"Capital management, discipline, and consistency in your trading edge."
A positive risk-to-reward ratio, paired with a high win rate, is the backbone of any solid trading plan 📈🔐
⚠️ Losses?
They’re part of the mathematical game of trading 🎲
They don’t define you — they’re necessary, they happen, and we move forward 📊➡️
🙏 I appreciate you taking the time to review my Daily Forecast.
Stay sharp, stay consistent, and protect your capital
— FRNGT 🚀
TVC:DXY

DXYDollar annotated fib channel. Dollar is braving FED cuts and QT end shenanigans. All the while gold and silver are hitting ath, crypto is still relatively interesting, and megacaps have no fear

Dollar on the way down!This is on the daily timeframe.
Support has now become resistance.
Look for the dollar to be rejected at
these levels once again before heading
down to 90 cents. Watch for BTC to start
slowly grinding it's way back up to ATH by
early 2026. Good luck out there!!!

DXY SellsFor DXY price has been moving up in a corrective manner towards a supply area. Price is currently in the supply area and I am expecting shorts from this region. If I see any break and retest to the downside, I will be selling DXY.
Do not jump in blindly. Manage Risk!
-TD

DXY Turning Bearish: This Week’s Best USD Sell Setups!This week I’m watching the DXY closely, and the structure is giving a bearish outlook, opening the door for multiple USD sell opportunities across the board.
I’m analyzing high-probability sell setups on:
🔹 USDCAD – looking for downside continuation
🔹 USDCHF – bearish momentum building
🔹 USDJPY – potential reversal and sell structure forming
🔹 AUDUSD – bullish strength as USD weakens
🔹 GBPUSD – clean bullish flow against the dollar
🔹 NZDUSD – continuation buys as USD trends lower
🔹 GBPJPY – watching for yen strength + risk flow shifts
📊 With the dollar losing steam, these pairs are lining up for possible trend continuation or reversal plays. In this video, I’ll break down structure, key zones, confluences, and what confirmations I want before entering.
👍 Don’t forget to like, comment, and subscribe if you want weekly market breakdowns and trade ideas.

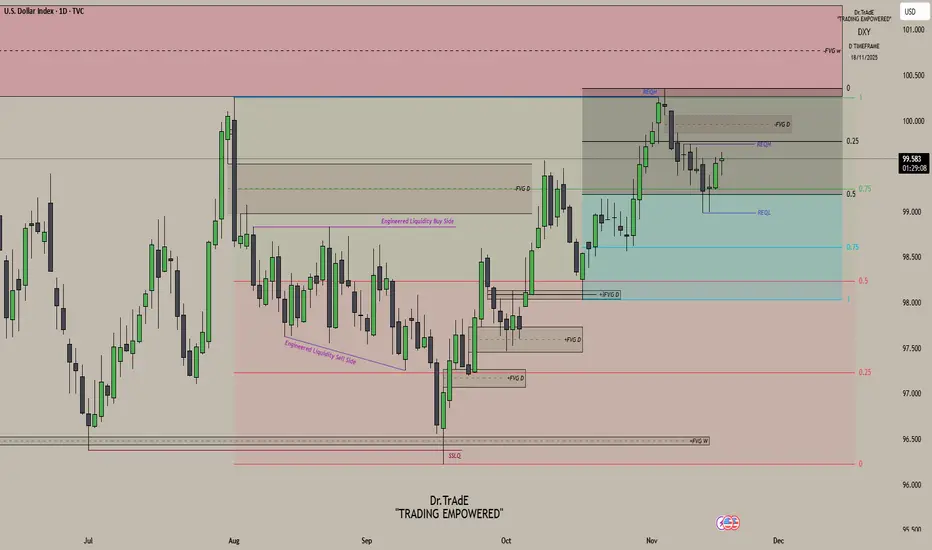
Understanding Dollar Structure and DeliveryCurrent price action is unfolding inside the Intermediate Dealing Range, defined by the November 5 high and the October 17 low. DXY is trading in the premium of its 20 day IPDA range, with equal highs sitting just under the 0.25 level as my first draw on liquidity and a Daily SIBI resting right above it. If price reacts at those equal highs, fine, that is expected. But if it keeps pressing higher, the Daily SIBI is the next draw, no question. And if price shifts with displacement from either of those levels, I am looking straight to the relative equal lows first, then 98.563 below the 0.75 level. With NFP coming up, the fundamentals can blow through structure, but if the dollar shows weakness, price is reaching into discount. That is the only direction it can go.
If you want to understand the delivery here, study this chart from August 1. Watch how price cleans up inefficiencies, hunts liquidity, and moves between premium and discount with every shift in order flow. Every displacement points to the next target. The PD arrays along the path are not decoration, they are the roadmap. I have marked the August 1 high and the September 18 low as the larger dealing range, and the November 5 high with the October 17 low as the Intermediate Dealing Range. That is the framework. That is where price is operating right now. If you want to understand the current delivery, this is the range you need to focus on.
Study the chart and you will see exactly why price moved the way it did. Yes, it is hindsight, and that is the whole point. Understanding past delivery helps you see future price action with real precision. The levels that got targeted here were not random. They were the logical draws. Learn that, and you stop guessing. The same delivery repeats again and again.
U.S Dollar Index DXY
No great deal for now,, i just wanna Buy at 98.00 or 95.00 or Sell at 102,, so set Alerts then forget it,, go looking for another one.

DXY FRGNT Daily Forecast - Q4 | W47| D18 | Y25 |📅 Q4 | W47| D18 | Y25 |
📊 DXY FRGNT Daily Forecast
🔍 Analysis Approach:
I’m applying Smart Money Concepts, focusing on:
Identifying Points of Interest on the Higher Time Frames (HTFs) 🕰️
Using those POIs to define a clear trading range 📐
Refining those zones on Lower Time Frames (LTFs) 🔎
Waiting for a Break of Structure (BoS) for confirmation ✅
This method allows me to stay precise, disciplined, and aligned with the market narrative, rather than chasing price.
💡 My Motto:
"Capital management, discipline, and consistency in your trading edge."
A positive risk-to-reward ratio, paired with a high win rate, is the backbone of any solid trading plan 📈🔐
⚠️ Losses?
They’re part of the mathematical game of trading 🎲
They don’t define you — they’re necessary, they happen, and we move forward 📊➡️
🙏 I appreciate you taking the time to review my Daily Forecast.
Stay sharp, stay consistent, and protect your capital
— FRNGT 🚀
TVC:DXY

DXY firmed between the hawkish Fed and Waller call of cuts.
The dollar strengthened despite the contrast between the Fed’s overall hawkish tone and Waller’s support for rate cuts.
Cleveland Fed President Hammack noted that policy must remain somewhat restrictive to bring inflation back to target, while St. Louis Fed President Musalem also emphasized that any policy easing should proceed cautiously.
In contrast, Fed Governor Waller said he is not concerned about a renewed acceleration in inflation and argued that several months of labor-market softness justify additional rate cuts. He added that tariffs are unlikely to have a lasting impact on inflation and that restrictive policy is increasingly weighing on the economy, particularly on lower- and middle-income households.
DXY briefly tested the support at 99.30 before climbing above both EMAs. The converging EMAs indicate a potential shift toward a bullish trend.
If DXY closes above both EMAs, the index may advance toward 99.80.
Conversely, if DXY breaks below both EMAs and 99.30, the index could retreat toward the next support at 99.00.

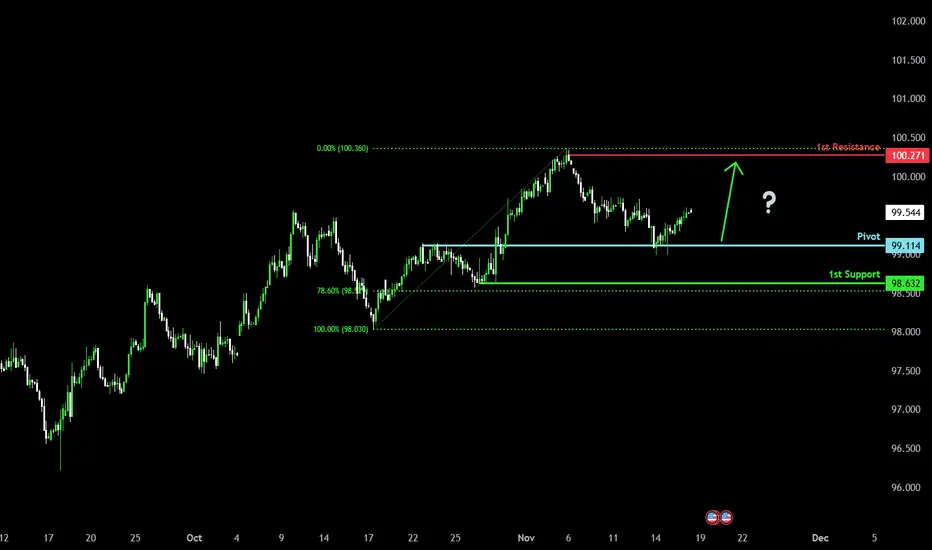
Bullish momentum to extend?US Dollar Index (DXY) has bounced off the pivot, which is a pullback support, and could potentially rise to the 1st resistance.
Pivot: 99.11
1st Support: 98.63
1st Resistance: 100.27
Disclaimer:
The opinions given above constitute general market commentary and do not constitute the opinion or advice of IC Markets or any form of personal or investment advice.
Any opinions, news, research, analyses, prices, other information, or links to third-party sites contained on this website are provided on an "as-is" basis, are intended to be informative only, and are not advice, a recommendation, research, a record of our trading prices, an offer of, or solicitation for, a transaction in any financial instrument and thus should not be treated as such. The information provided does not involve any specific investment objectives, financial situation, or needs of any specific person who may receive it. Please be aware that past performance is not a reliable indicator of future performance and/or results. Past performance or forward-looking scenarios based upon the reasonable beliefs of the third-party provider are not a guarantee of future performance. Actual results may differ materially from those anticipated in forward-looking or past performance statements. IC Markets makes no representation or warranty and assumes no liability as to the accuracy or completeness of the information provided, nor any loss arising from any investment based on a recommendation, forecast, or any information supplied by any third party.
DXY Structure Remans Weak, short itDXY broader structure remans weak and best time to short , sell on rse

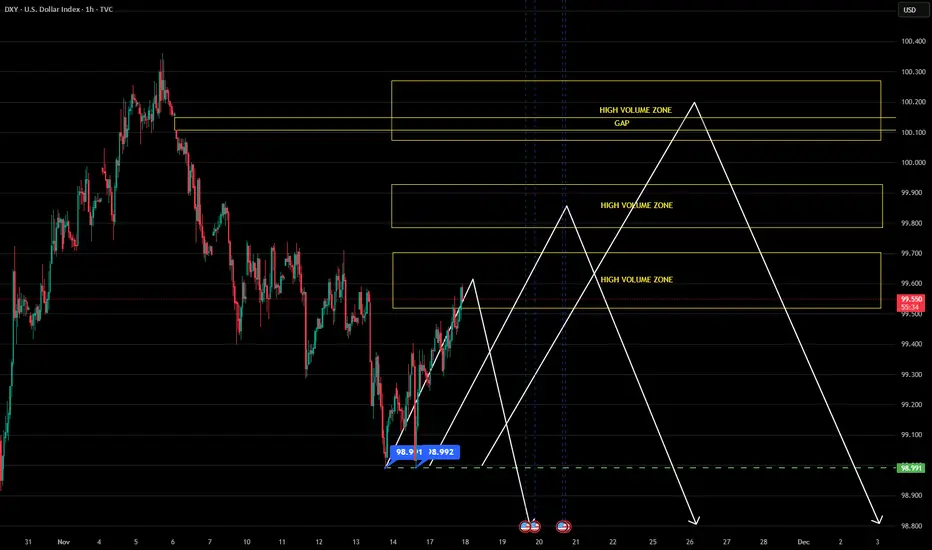
Trading Idea: DXY — Potential Reversal PointsTrading Idea: DXY — Potential Reversal Points
Technical Overview
The Dollar Index has formed a significant resistance level, from which price has moved toward the first high-volume zone. The chart highlights three potential areas of volume concentration, each capable of acting as a reaction point.
Key Zones
Zone 1 — The nearest high-volume area, serving as the first potential support level.
Zone 2 — An intermediate volume accumulation area.
Zone 3 — The most compelling zone, featuring an unfilled gap. The presence of this gap creates an additional price magnet, as markets tend to fill price gaps over time.
Trading Scenario
The primary hypothesis anticipates price movement toward the third high-volume zone with the objective of filling the gap. This area is expected to produce the strongest reaction and potential reversal.
However, monitoring price behavior in the first two zones remains essential. A clear bounce with confirmation could indicate an earlier conclusion to the downward movement.
Risk Management
Wait for price reaction in each designated zone and seek confirming signals before entering a position. While the unfilled gap in the third zone increases the probability of price reaching that level, it does not guarantee a reversal.
US DOLLAR INDEX (DXY): Bullish Movement Confirmed?!Following a recent bearish movement, the 📈DXY has corrected to a previously breached key structural level.
I have identified two significant bullish confirmations after this test: the price has violated the neckline of a double bottom pattern and the resistance line of a falling parallel channel pattern.
Both breakouts suggest a high probability of a bullish trend resumption.
The market will probably continue its upward trajectory and reach the 99.70 level in the near term.

DXY key levels to look out for this week (WC 17/11)DXY key levels for the following week ahead.
Key fundamentals this week includes FOMC meeting minutes on Wednesday, NFP change along with unemployment rate on Thursday and to finish the week off on Friday- Manufacturing & Services PMI release on Friday.

DXY Will Go Lower! Short!
Please, check our technical outlook for DXY.
Time Frame: 5h
Current Trend: Bearish
Sentiment: Overbought (based on 7-period RSI)
Forecast: Bearish
The market is approaching a significant resistance area 99.554.
Due to the fact that we see a positive bearish reaction from the underlined area, I strongly believe that sellers will manage to push the price all the way down to 99.097 level.
P.S
We determine oversold/overbought condition with RSI indicator.
When it drops below 30 - the market is considered to be oversold.
When it bounces above 70 - the market is considered to be overbought.
Like and subscribe and comment my ideas if you enjoy them!

DXYU.S Dollar Index
- Completed " 12345 " Impulsive Waves and " AB " Corrective Wave
- Break of Structure
- Demand Zone
- Order Block
- Change of Characteristics

DXY FRGNT Daily Forecast -Q4 | W47| D17 | Y25 |📅 Q4 | W47| D17 | Y25 |
📊 DXY FRGNT Daily Forecast
🔍 Analysis Approach:
I’m applying Smart Money Concepts, focusing on:
Identifying Points of Interest on the Higher Time Frames (HTFs) 🕰️
Using those POIs to define a clear trading range 📐
Refining those zones on Lower Time Frames (LTFs) 🔎
Waiting for a Break of Structure (BoS) for confirmation ✅
This method allows me to stay precise, disciplined, and aligned with the market narrative, rather than chasing price.
💡 My Motto:
"Capital management, discipline, and consistency in your trading edge."
A positive risk-to-reward ratio, paired with a high win rate, is the backbone of any solid trading plan 📈🔐
⚠️ Losses?
They’re part of the mathematical game of trading 🎲
They don’t define you — they’re necessary, they happen, and we move forward 📊➡️
🙏 I appreciate you taking the time to review my Daily Forecast.
Stay sharp, stay consistent, and protect your capital
— FRNGT 🚀
TVC:DXY
