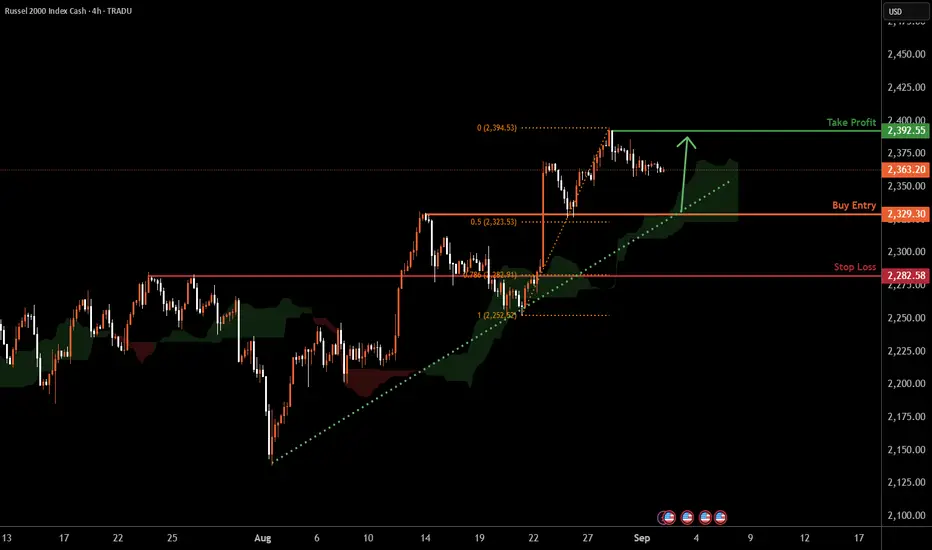
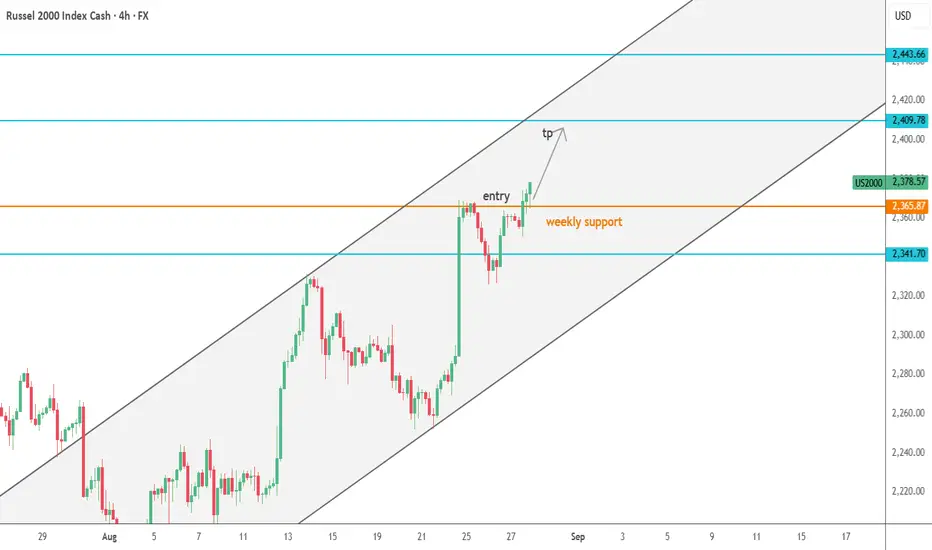
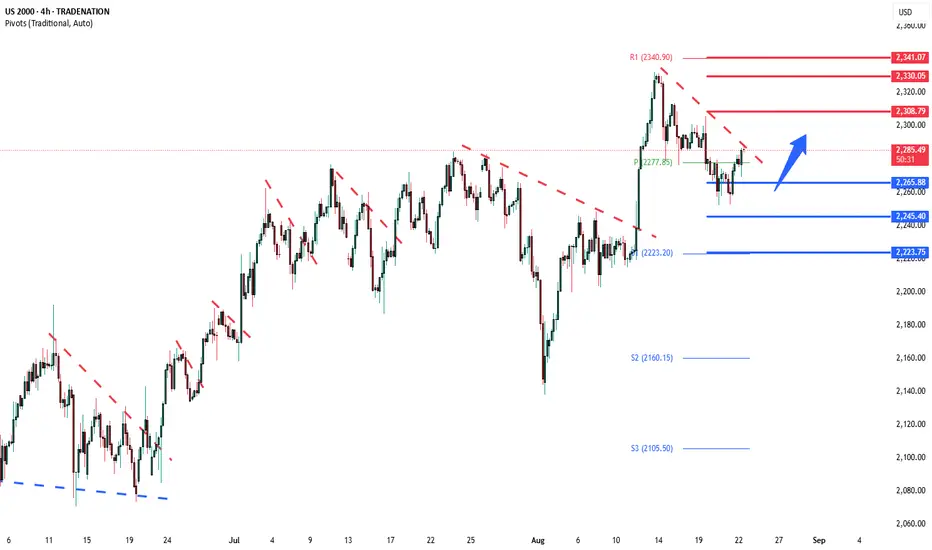
US2000 H4 | Bullish momentum to extendBased on the H4 chart analysis, we could see the price fall to the buy entry at 2,329.30, which is an overlap support that is slightly above the 50% FIbonacci retracement and could bounce from this levle to the upside.
Stop loss is at 2,282.58, which is a pullback support that aligns with the 78.6%
Related indices
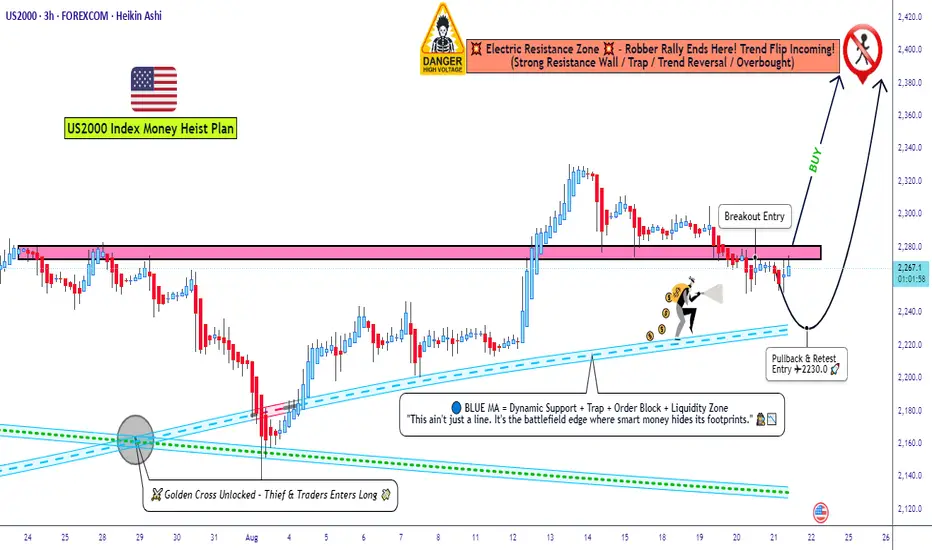
Russell 2000 Heist Plan – Breakout or Pullback Entry Layers?🔥Thief Trader's US2000/Russell 2000 Bullish Heist Plan 🚨💰
🌟 Dear Thief OG's, Ladies & Gentlemen of the Market Robbery Crew! 🌟Get ready to pull off a slick bullish heist on the US2000/Russell 2000 Index using the infamous Thief Trader Layering Strategy! 🤑💸 This is a Swing/Scalping Trade with a high-
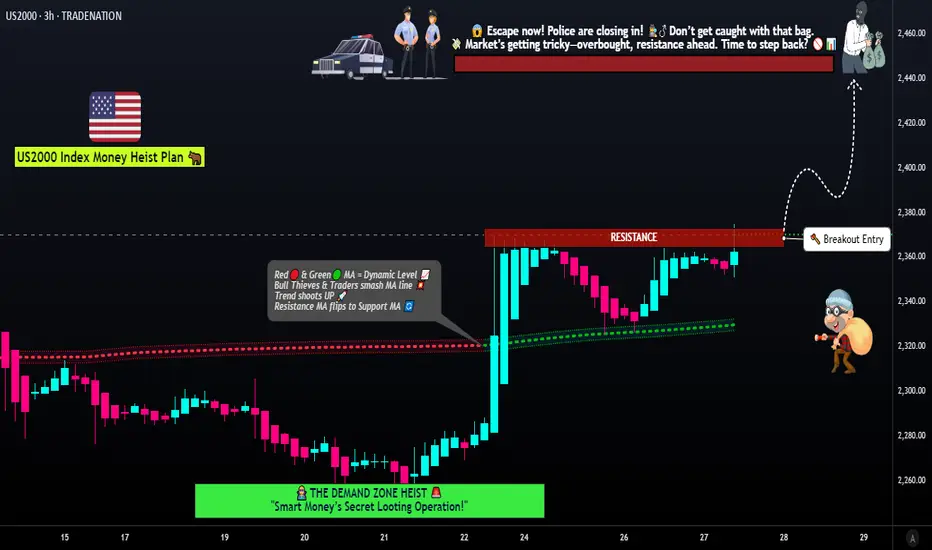
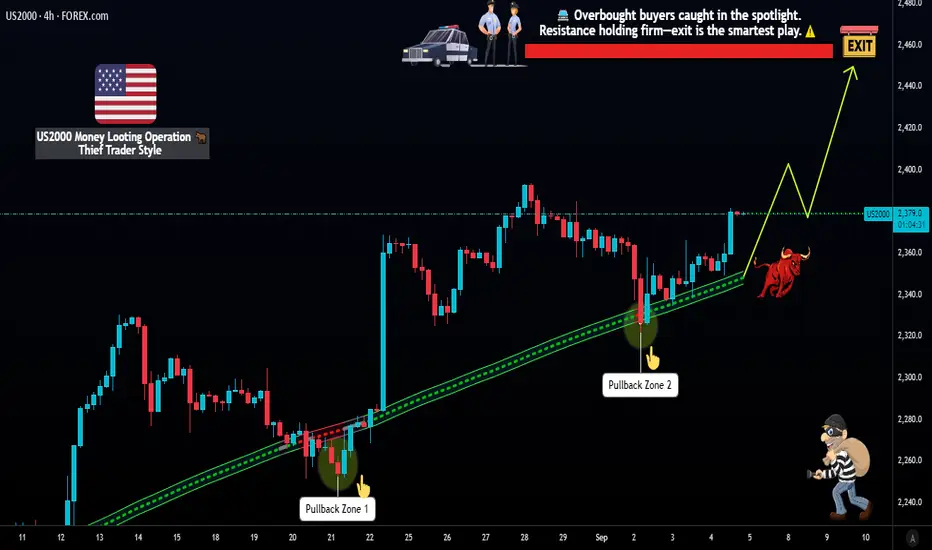
US2000 Bullish Breakout Strategy! Layer Entries and Escape Plan🚨💰 US2000 / RUSSELL2000 Index Market Robbery Plan 🏦💸 (Swing/Scalping Trade)
🌟Hi! Hola! Ola! Bonjour! Hallo! Marhaba!🌟
Dear Money Makers & Robbers, 🤑💰💸✈️
Based on 🔥 Thief Trading Strategy 🔥 here is our heist plan to rob the US2000 / RUSSELL2000 Index Bank Vault. Stick to the strategy outlined below
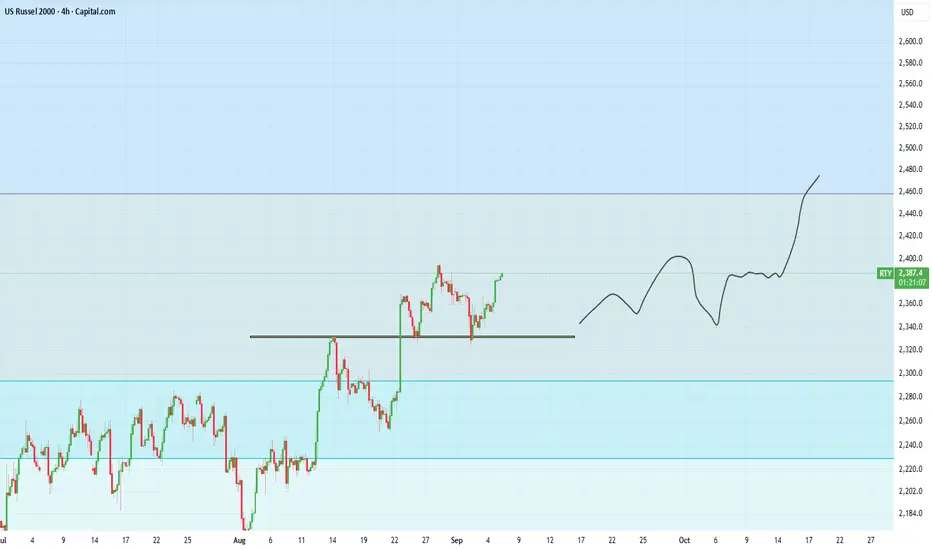
RUSSELL Generational Bullish Cup & Handle pattern Russell has created a generational sized bullish cup and handel pattern, with the crypto alt season heating up along side, i have highlighted the 2021 alt coin season to show that alts moed hundreds of percent where Russell made a strong impulsive move upwards but then consoldated, i believe this wi
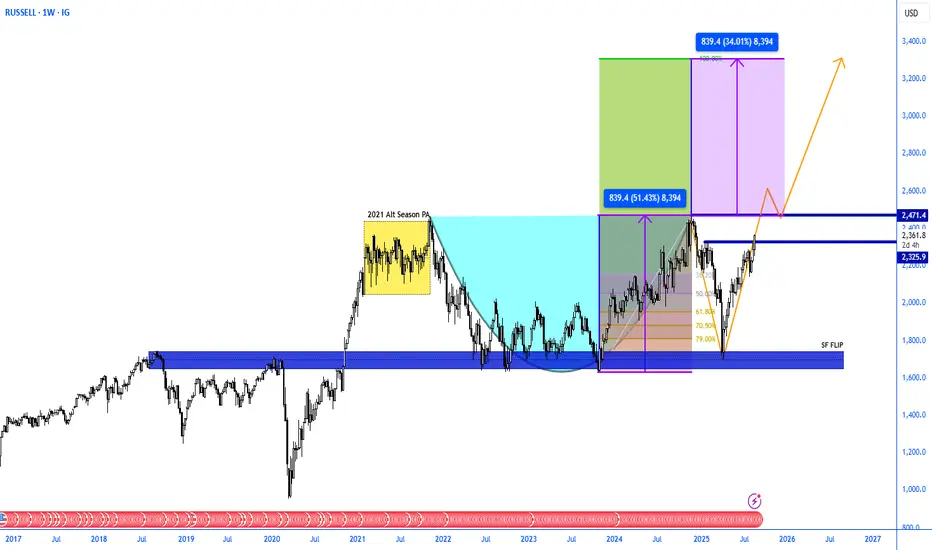
the breakout pattern for the RusselThis breakout pattern willget the russel into a new ATH.
This will also result in the crypto market to start its next and final push of this cycle.
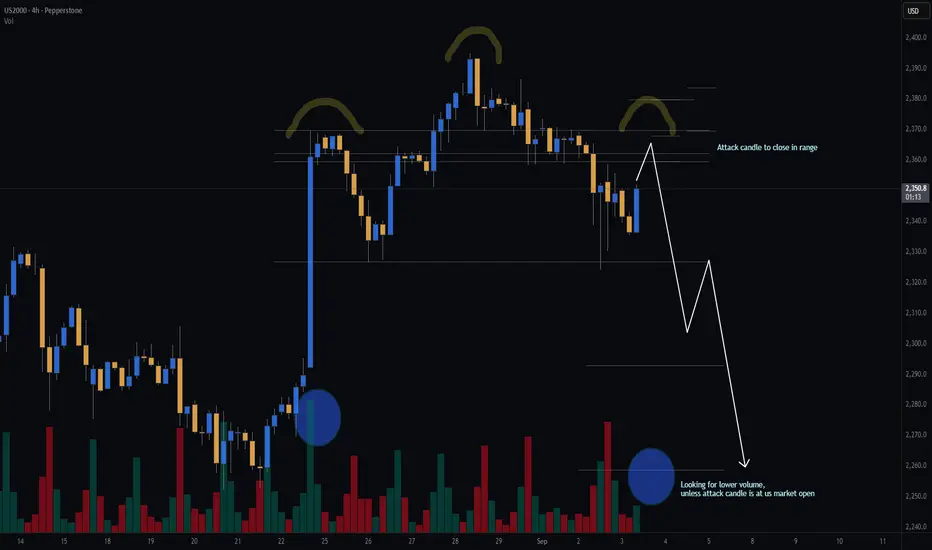
Russel 2000 | H4 Head and Shoulders | GTradingMethodHello Traders.
Welcome to today's trade idea by GTradingMethod.
🧐 Market Overview:
Since April 2025, this rally has been powering higher, leaving little room for pullbacks. But momentum is starting to show cracks — indicators are flashing signs of exhaustion. This doesn’t mean a sharp drop is guara
US2000 Layered LSMA Pullback Strategy – Bullish Opportunity🚀 US2000 Index – Thief Plan: LSMA Pullback + Layered Entries 📊
📌 Trading Plan (Swing / Day Trade)
Strategy: Bullish LSMA moving average pullback plan 📈
Thief Style Entries (Layering Method):
Multiple buy-limit layers at 2340 / 2350 / 2360 / 2370
You can increase layers based on your own strategy &
Russell continues to paint bullish PA for small capsSmall caps have surged higher in recent days as investors warm towards companies most exposed to the domestic US economy, in part thanks to rising expectations for interest rate cuts.
The Russell is also showing clean price action from a bullish point of view: breaking key levels and defending the
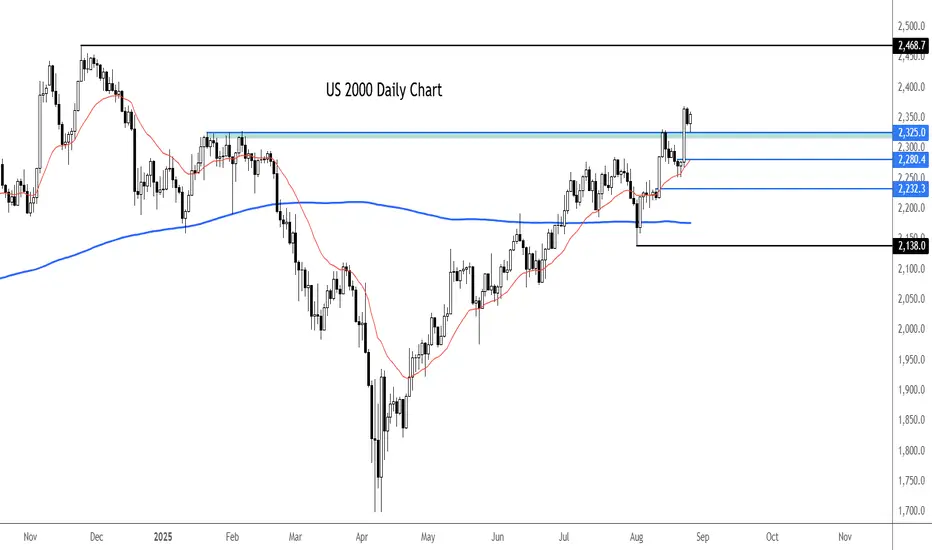
Russell2000 key trading levels Key Support and Resistance Levels
Resistance Level 1: 2320.70
Resistance Level 2: 2336.20
Resistance Level 3: 2352.80
Support Level 1: 2280.00
Support Level 2: 2264.10
Support Level 3: 2240.35
This communication is for informational purposes only and should not be viewed as any form of recomm
See all ideas
Displays a symbol's price movements over previous years to identify recurring trends.
Frequently Asked Questions
US Russel 2000 reached its highest quote on Nov 25, 2024 — 2,471.3 USD. See more data on the US Russel 2000 chart.
The lowest ever quote of US Russel 2000 is 105.5 USD. It was reached on Oct 28, 1987. See more data on the US Russel 2000 chart.
US Russel 2000 is just a number that lets you track performance of the instruments comprising the index, so you can't invest in it directly. But you can buy US Russel 2000 futures or funds or invest in its components.